Program expanding to map Colorado mountain snowpack
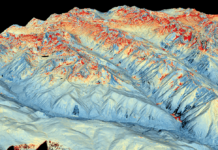
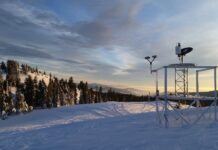
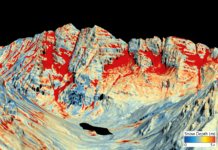
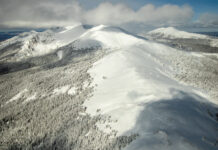
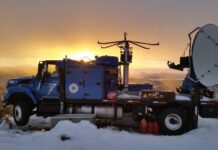
Front Range water providers hope to expand a program that uses a new technology they say will revolutionize water management in Colorado.
Vail Resorts’ cancellation of cloud seeding this winter could mean less water in streams
Due to budget shortfalls, Vail Resorts has pulled this winter’s funding for its cloud seeding program, potentially reducing the amount of water flowing down the Colorado River this spring.
Weak 2020 water year comes to a close
What started as a promising water year for Colorado with above-average snowpack ended Sept. 30 with the entire state in some level of drought.
Studying the snowpack in a changing climate – Water Buffs Podcast ep. 5 – Noah...
The snowpack is crucial to the West’s water supply, ecosystems and economy. But climate change threatens to make the region’s snowpack thinner and less reliable. We talk to a leading snowpack researcher about how scientists are analyzing the past, present and future of the West’s snow.
Aspen officials want more data to plan for drought, seeking $59k for more tools
The city of Aspen is hoping some grant money can help it collect more data on snow and streams in the high country so it can better predict and plan for droughts.
Melting away in a hot drought
The snowpack that 40 million people rely on for water was supposed to provide a bounty this year. Instead, much of it melted away fast and early — part of a long-term trend associated with climate change.
Critical April snowpack above average, but potential for dry spring causes concern
While snowpack and reservoirs are strong, forecasts for streamflows, which build as melting snow reaches streams, are expected to be below normal across southwestern and southeastern parts of the state.
Streamflow forecast down for Roaring Fork despite above-normal snowpack
Although snowpack in the mountains near Aspen is hovering above normal for this time of year, streamflows in the Roaring Fork River are predicted to be just 85% of normal for April.
One year later: What the March 2019 avalanche cycle hints at on climate change
In studying what led to this historic avalanche cycle, snow scientists are identifying some elements — such as warmer temperatures, wetter air and snow, and more-intense storms — that are consistent with a warming climate.
Cloud seeding study validates ski industry staple
Cloud seeding disperses dust-sized silver iodide particles into clouds so that ice crystals can form on those particles and fall to the ground as snow.


