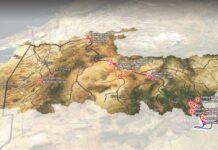
Map: Winter photo galleries
Use this interactive map to browse photos and videos taken in wintertime from our expanding collection of free-to-use media captured by drones, planes and ground-based photographers.
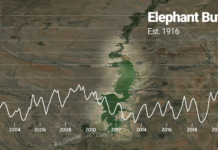
Data viz: Elephant Butte Reservoir levels
Last update: September 21, 2022
Percent of total capacity
Source: US Bureau of Reclamation
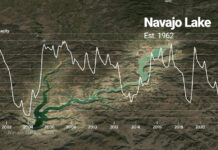
Data viz: Navajo Lake levels
Last update: September 21, 2022
Percent of total capacity
Source: US Bureau of Reclamation
Map: Rio Grande drought tracker
This map depicts data from the National Drought Mitigation Center. Drought intensity categories are based on numerous indicators and local reports from more than 350 expert observers around the...
Map: New Mexico drought tracker
This map depicts data from the National Drought Mitigation Center. Drought intensity categories are based on numerous indicators and local reports from more than 350 expert observers around the...
Map: New Mexico monthly precipitation
This map shows total rain and snowfall in the New Mexico every month from 1981 to the present. The map's color scale runs from white (no precipitation), to blue (significant precipitation) to red (intense precipitation)....
Data viz: Lake Powell levels
Last update: September 21, 2022
Percent of total capacity
Source: US Bureau of Reclamation
Data viz: Lake Mead levels
Last update: September 21, 2022
Percent of total capacity
Source: US Bureau of Reclamation
Map: Explore drone, aerial and terrestrial imagery from The Water Desk
Use this interactive map to browse our expanding collection of free-to-use photos and videos captured by drones, planes and ground-based photographers.
Data viz: explore our interactive dashboards for drought, precipitation and snowpack
These maps and visualizations let you interact with vital data on our water supply.


