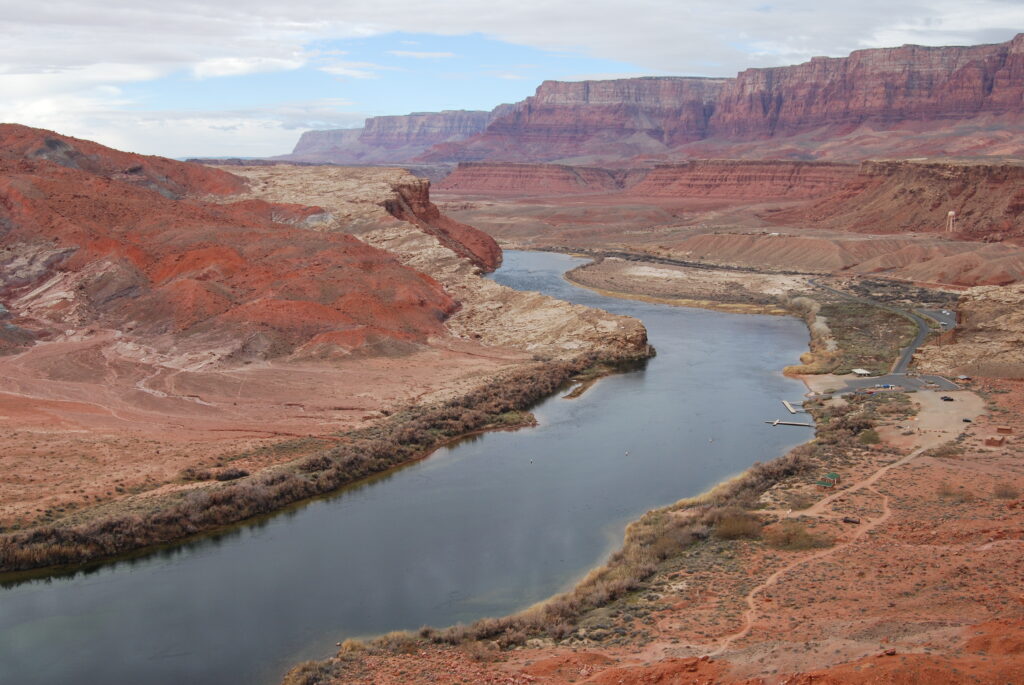
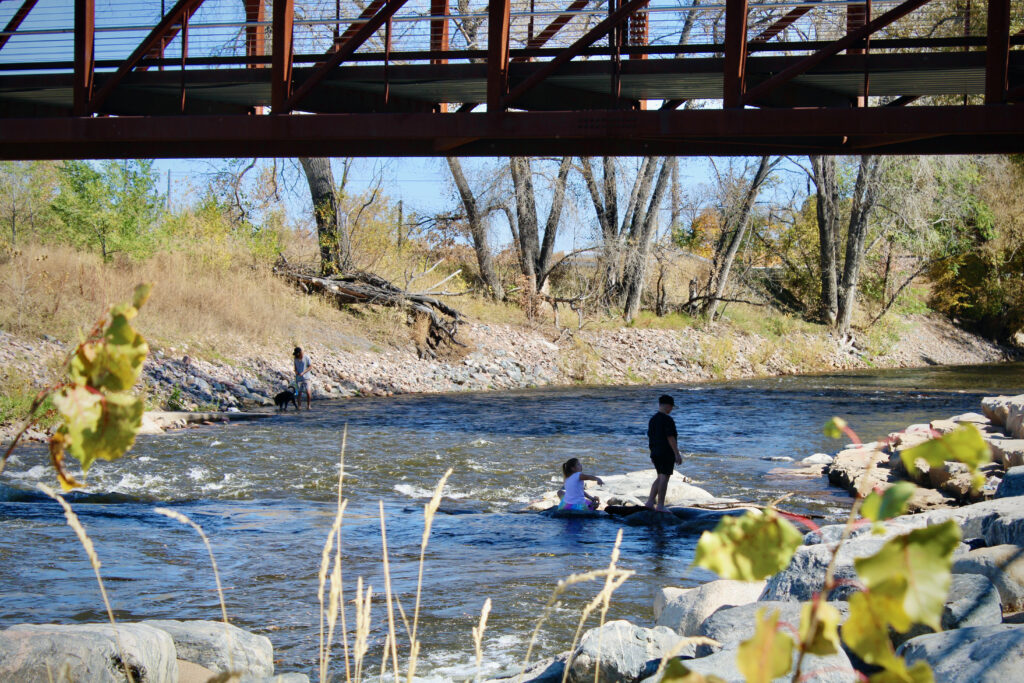
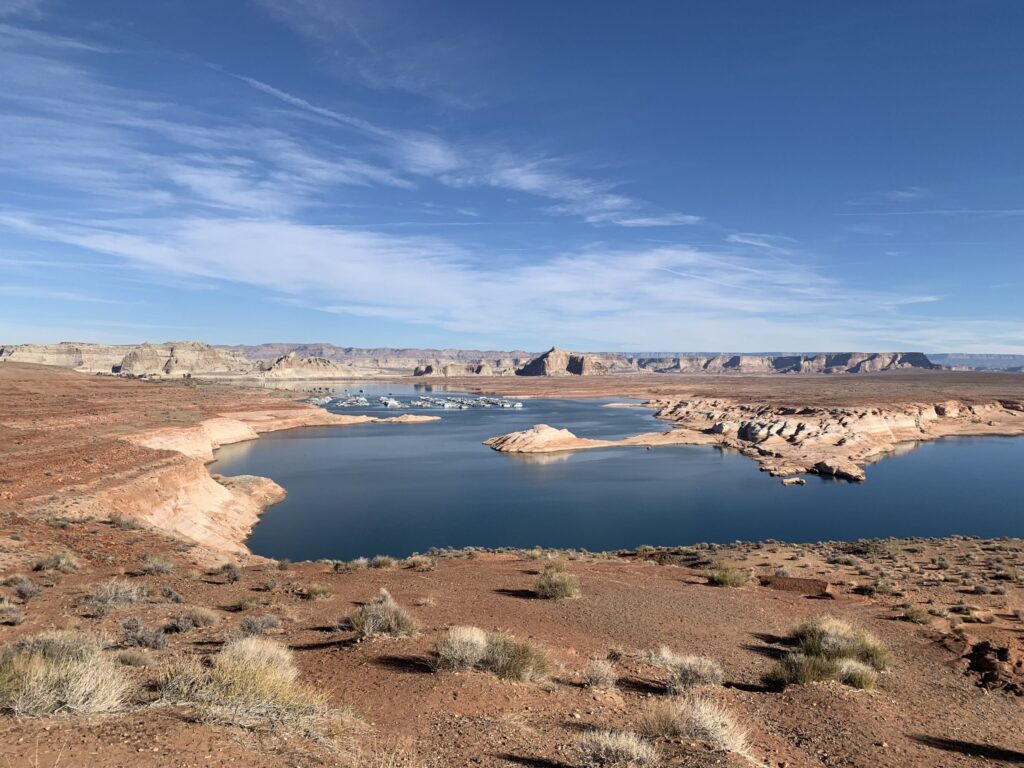
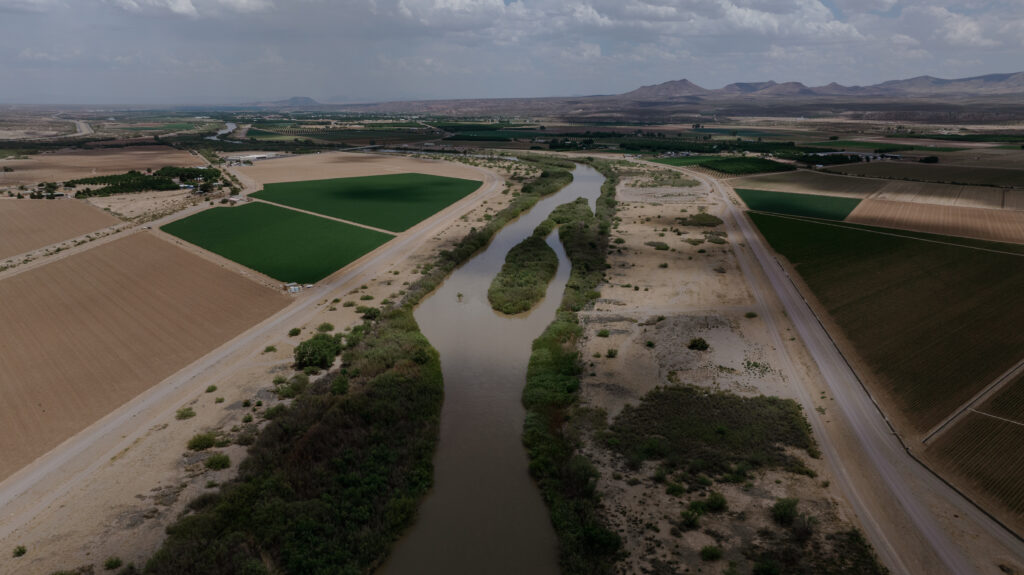
Lees Ferry in Arizona marks the point on the Colorado River where the Upper and Lower basins split. The two entities have been deadlocked over how to divide the scarce resource. (Caroline Llanes/Rocky Mountain Community Radio)Rocky Mountain Community Radio’s Caroline Llanes reports
The Colorado River Basin is in crisis.
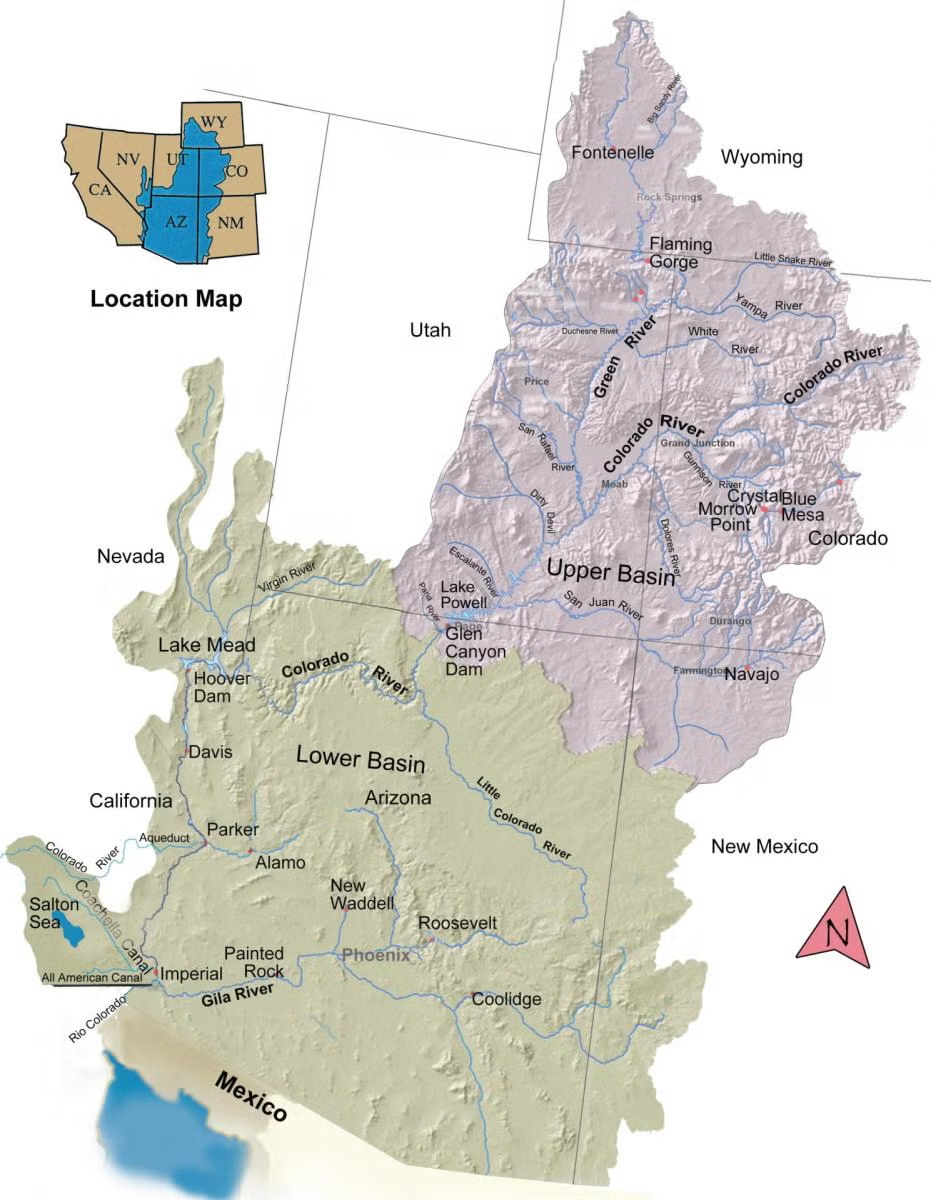
Climate change is reducing its flow and its biggest reservoirs are shrinking. The seven U.S. states that use the river are negotiating cutbacks to their water use. The Upper Basin states of Colorado, Utah, Wyoming, and New Mexico are deadlocked with the Lower Basin states of California, Arizona, and Nevada.
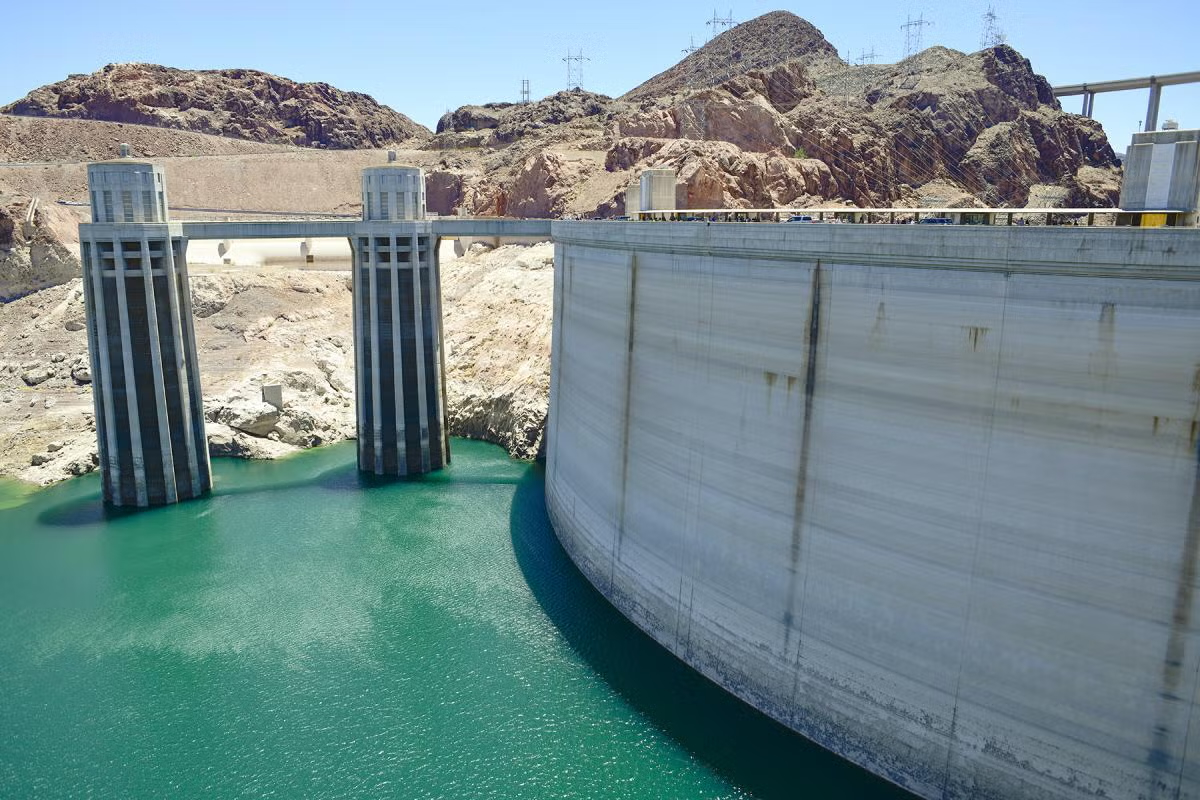
But the federal government has a big stake in the negotiations, too. It oversees and operates some of the most critical infrastructure on the river, including dams that create its biggest reservoirs. Dwindling water levels hurt its ability to generate and sell hydropower. Lower flows degrade the federally-managed national parks the river flows through. Diminishing supplies threaten the viability of the river’s core legal document, the Colorado River Compact.
With all of those layered interests, it’s led some to ask: Why aren’t federal officials applying more pressure to get a deal finalized?
This would not be the first time the federal government has tried to decrease water use on the Colorado River. A little over 20 years ago, California was using about 800,000 acre feet of water more than it was allotted. Federal officials stepped in, with the goal of reining in the river’s single biggest water user, the Imperial Irrigation District.
“If you’re going to solve a water shortage, you don’t go to the little guys, you go to the big guy,” said Tina Shields, one of the water managers at IID. Shields was at the district during QSA negotiations and currently oversees its compliance with the agreement.
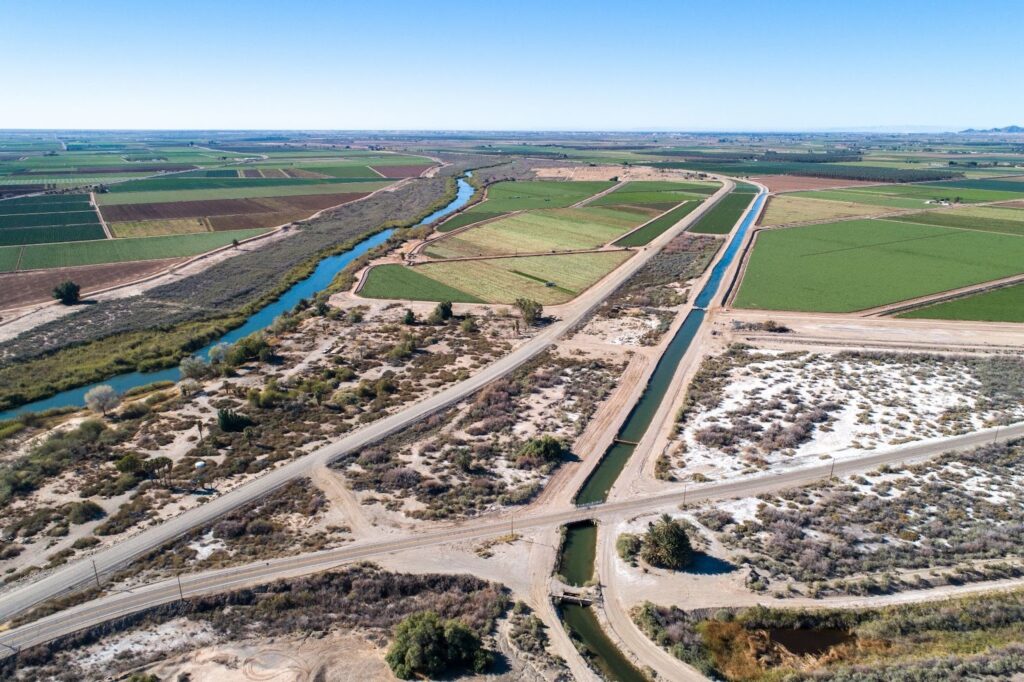
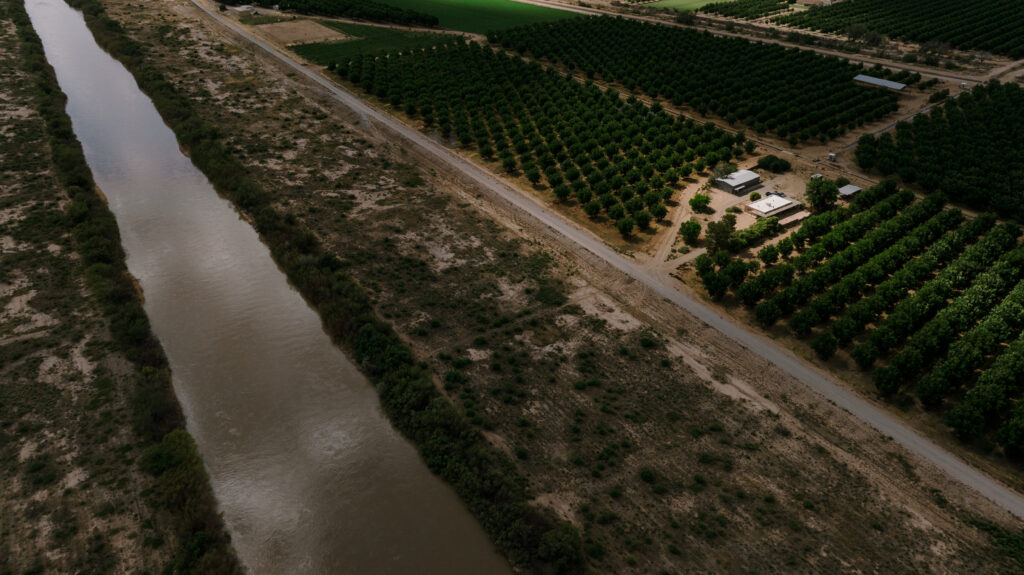
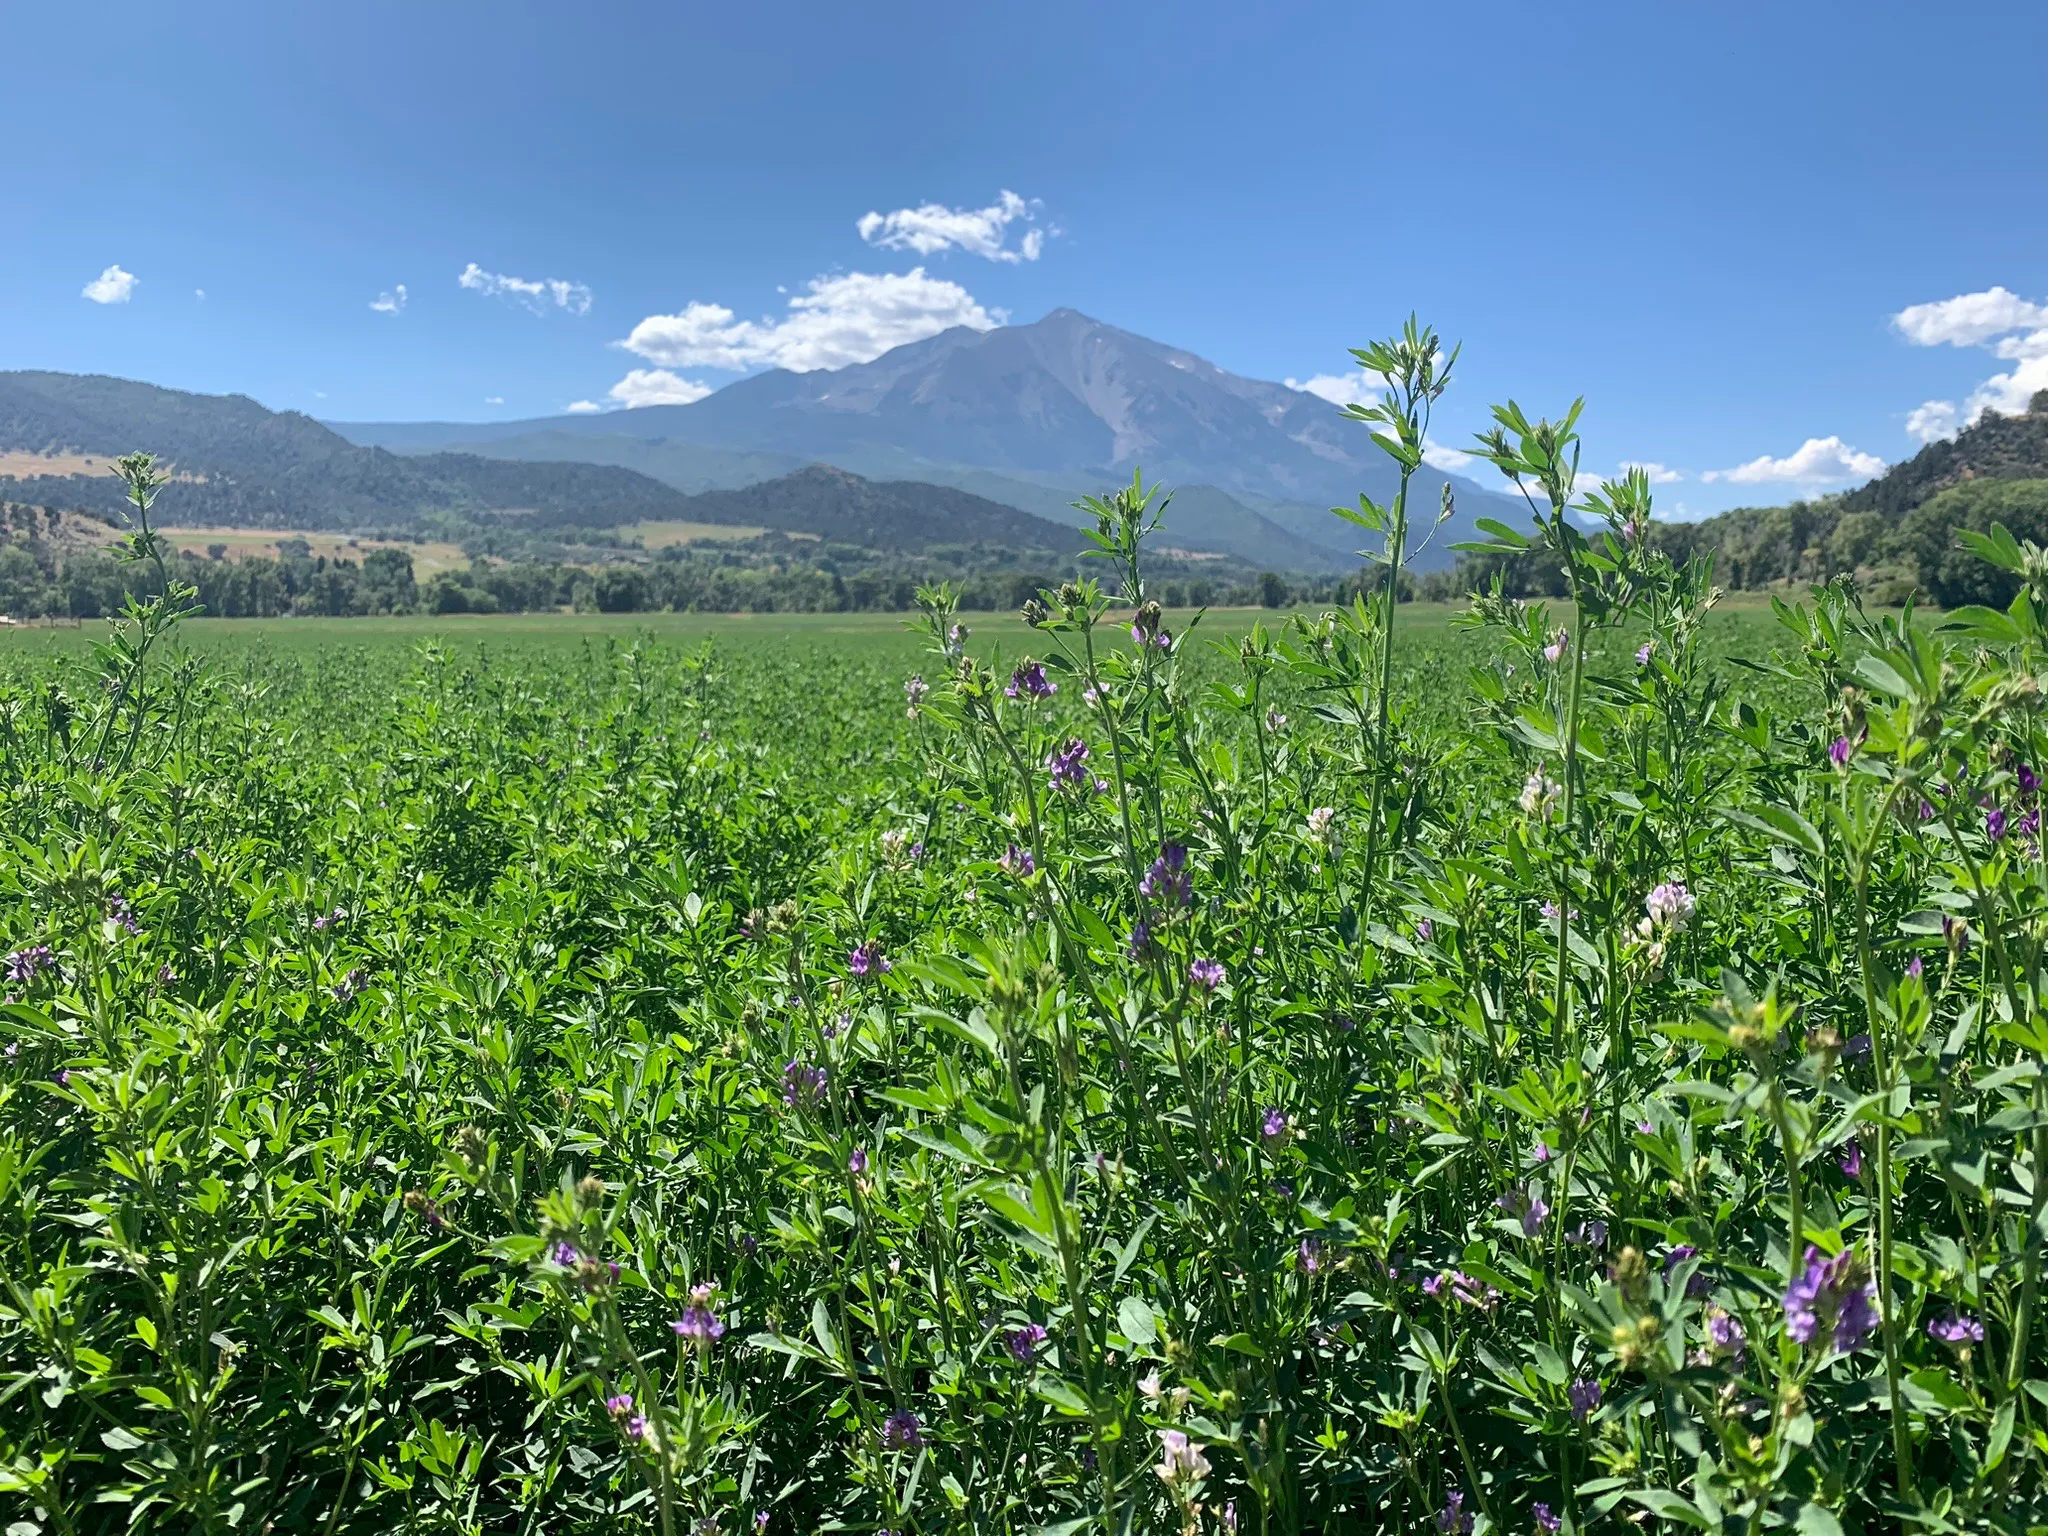
Farms in Southern California’s Imperial Valley—an agricultural powerhouse that grows some of the nation’s winter produce—rely on the powerful district to deliver Colorado River water.
The All American Canal, the largest diversion on the Colorado River, passes through Winterhaven, CA on its way to the Imperial Valley. The Colorado River is seen flowing next to it. (Ted Wood/The Water Desk)
Recounting the fight over California’s overuse, Shields says the district was presented with a deal to reduce their take in 2002, with a deadline to sign it. IID’s board declined. Interior Secretary at the time, Gale Norton, threatened to cut off water deliveries to the district. The secretary is considered the “water master” among the river’s Lower Basin states.
“Essentially it was a coordinated federal and state attack on IID to get us to agree to the deal,” she said.
In 2003, IID agreed to a deal that drastically reduced its water use in exchange for payments from large municipal water providers in the state, which is now known as the Quantification Settlement Agreement. But the year between IID’s rejection of the initial deal and its signing was marked by resistance from the district, playing out in lawsuits and court battles—and lots of federal pressure.
“At the time, it was not good,” Shields said. “We had a gun to our head and our arm twisted behind our back. But through the 20 years since then, we’ve developed the relationships with the management and the staff of these other agencies.”
IID says that since 2003, it has conserved 9 million acre feet of water, and Shields said the QSA could be a model for other states looking to cooperate on conservation measures. But, she reflected, the QSA saga is in sharp contrast to the way the federal government is currently handling the Colorado River.
“Back then, when a deadline wasn’t met, there were consequences to it, right?”
Since then, the warming and drying trend in the Colorado River Basin has gotten much worse, necessitating cutbacks. The Upper and Lower Basins have not been able to agree on who will take those cuts, bypassing deadline after deadline set by Reclamation to come up with a deal. Another deadline looms: February 14, 2026 marks a deadline for the states to present the Bureau of Reclamation with a deal that outlines the conservation commitments between the basins.
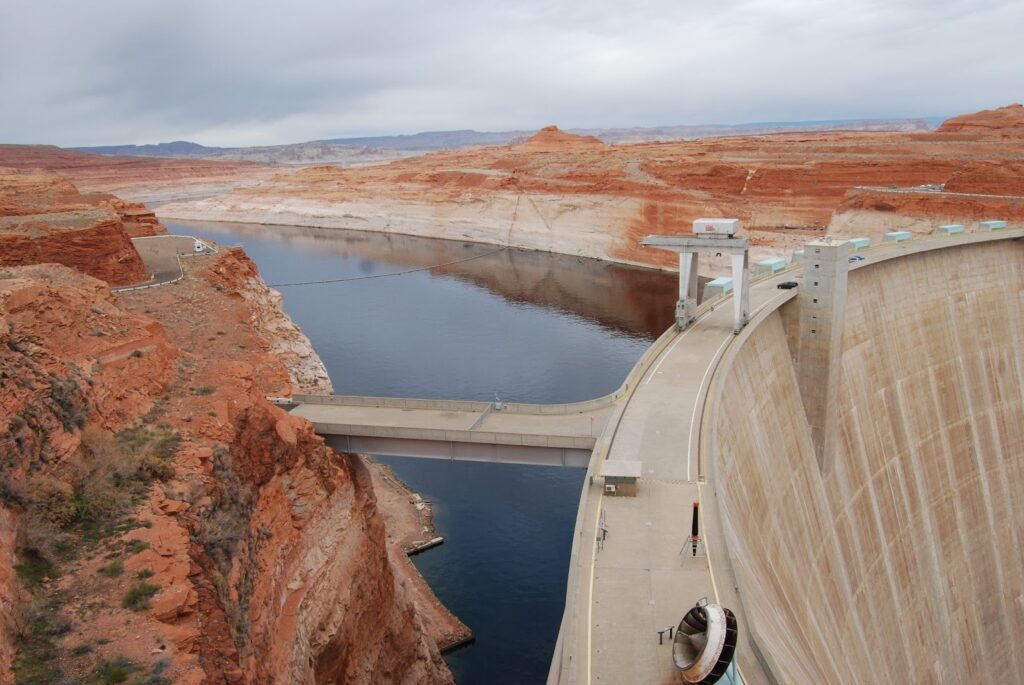
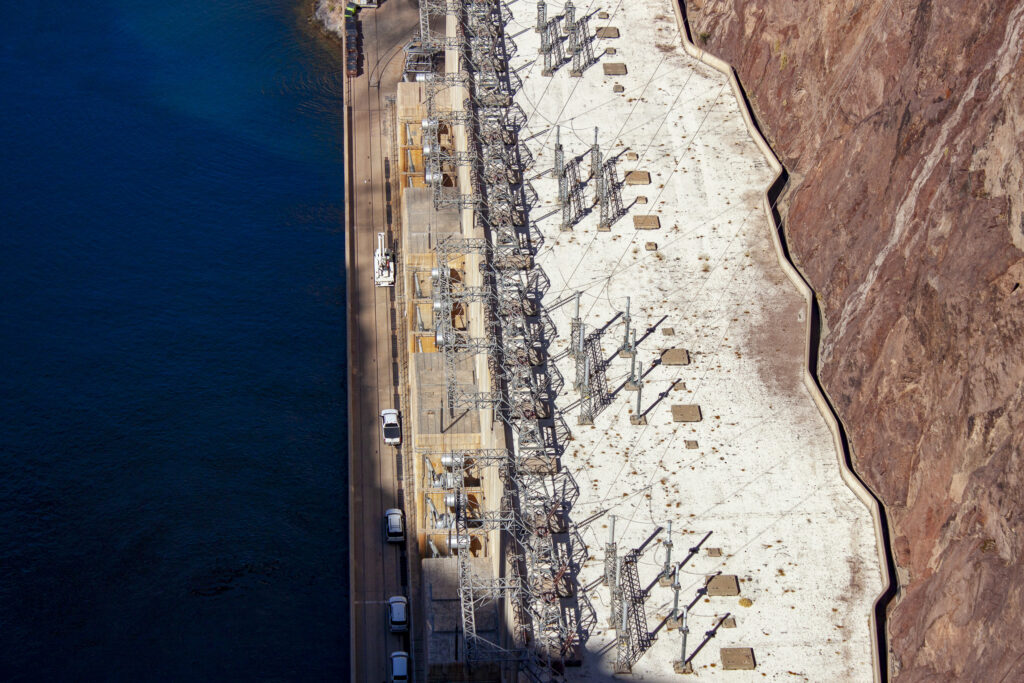
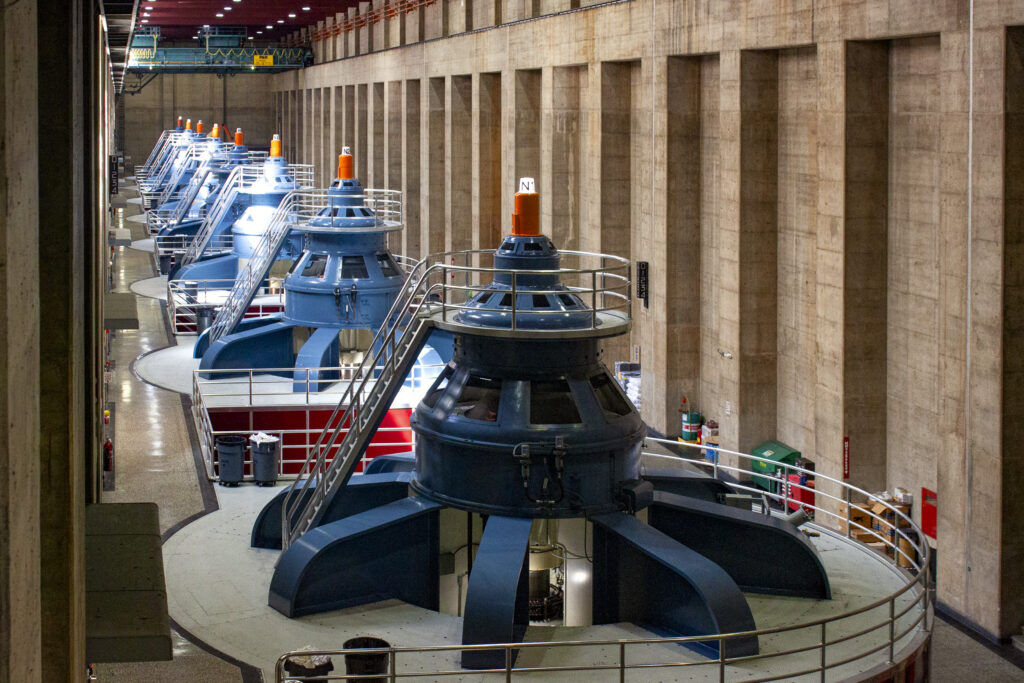
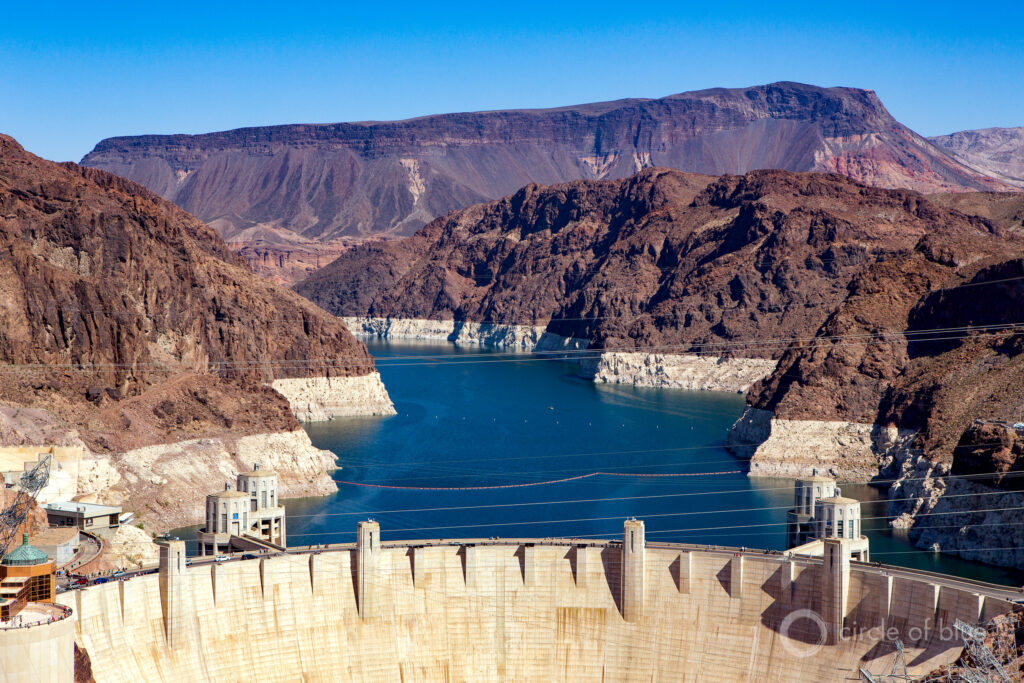
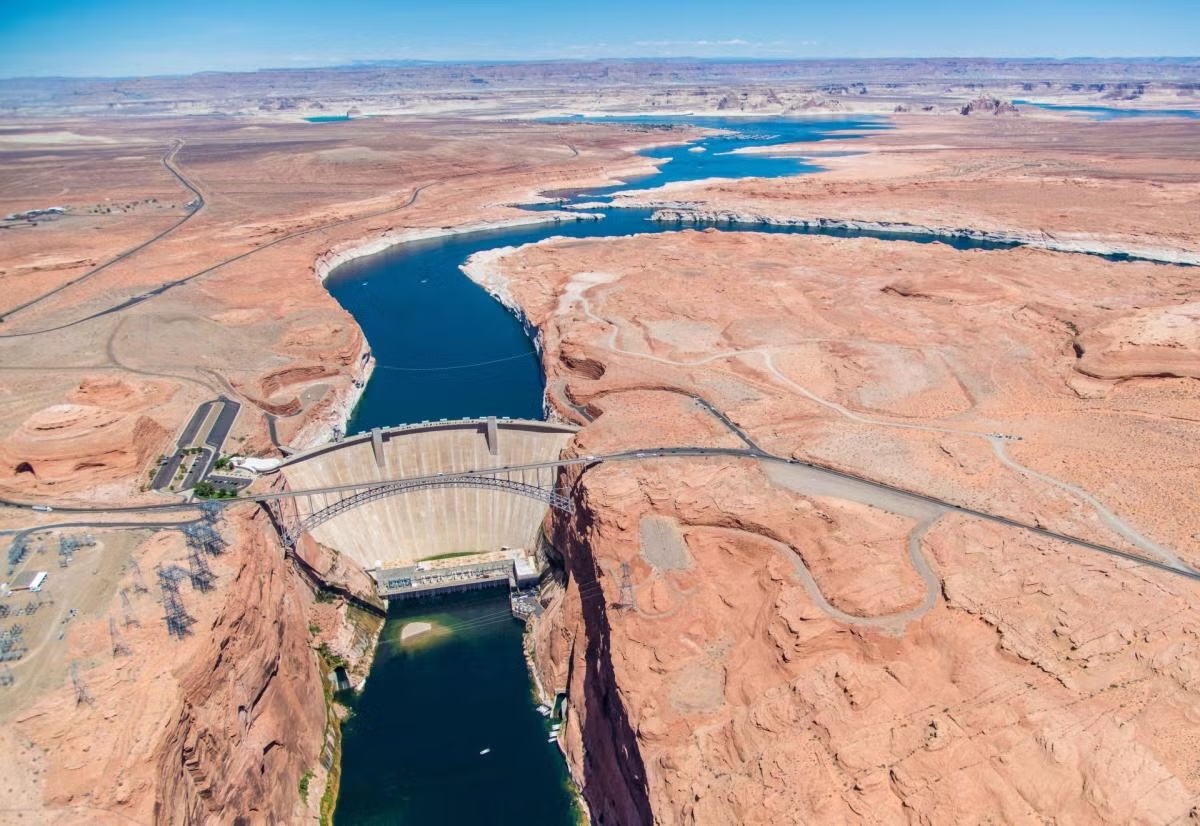
All the while, climate change is threatening the viability of federal infrastructure – like Hoover Dam and Glen Canyon Dam, and their hydropower turbines.
Colorado River water is released from Lake Powell through the hydropower turbines at Glen Canyon Dam near Page, Arizona. (Caroline Llanes/Rocky Mountain Community Radio)
“Our hydrology is permanently bad,” said Elizabeth Koebele, an associate professor at the University of Nevada Reno, where she researches Colorado River governance.
“This isn’t something that we bounce back from anymore,” she said. “Even a really good water year doesn’t really do a lot for our storage reservoirs. And now, the most cutting-edge science says even the same amount of snowpack isn’t producing the same amount of runoff into our streams anymore because we have all these other processes going on related to aridification.”
Koebele said less water makes hard decisions even harder, and it backs the states into their respective corners, refusing to make concessions. Uncomfortable yet necessary basin-wide cuts have created a dynamic that has made Reclamation reluctant to play bad cop.
“It’s become really political, and so someone is going to be upset by any decision, which could lead the states to sue the Bureau of Reclamation and bring this to court,” she said. “And that could take a really long time to solve.”
Arizona, which is facing some of the most severe cutbacks, has been especially vocal about the feds getting more involved in negotiations—a stark departure from years past, when the states would have wanted to make these decisions themselves.
Arizona Governor Katie Hobbs, a Democrat, pushed Interior Secretary Doug Burgum to host all the Colorado River governors in Washington D.C. in late January.
“Having the secretary there to hear from us directly, like what we need to see a deal that’s fair — and I think especially with the secretary having been a governor and sort of being able to understand it from our perspectives — was really helpful,” she said.
She said she felt the governors left the meeting with an understanding of how they could be involved in the ongoing negotiations, and appreciated Burgum’s role as a facilitator and convenor for that conversation.
“I guess we’ll know when the negotiators get back in the room, if that actually had some impact there,” she said of the meeting. “But I think we all left the room feeling like we were at a better place… I don’t know that we’re at a place where we will have an agreement by the deadline, but I think we’ll be much closer to one than we would’ve been otherwise.”
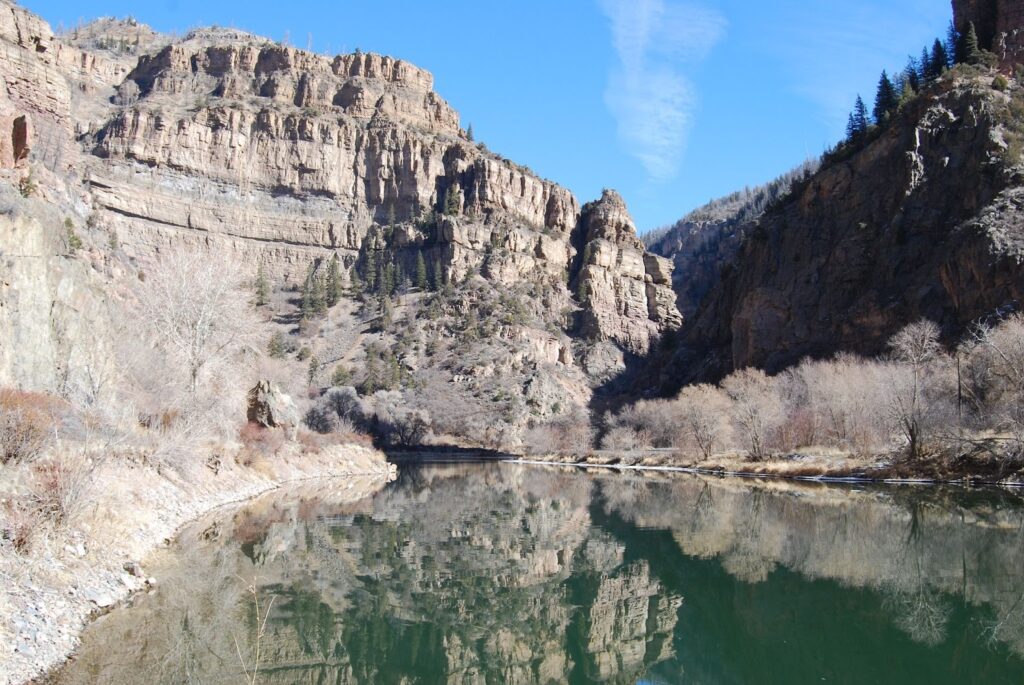
The Colorado River flows through Glenwood Canyon, along the Hanging Lake rest stop. The headwaters of the river are facing historically low snowpack in 2026. (Caroline Llanes/Rocky Mountain Community Radio)
Though some water users are eager for stronger leadership on the river, they say it’s a risky move to invite more federal involvement.
Jim Lochhead, who used to be Colorado’s top river negotiator, said he worried that the river’s myriad problems would become even more political than they already were. He said the Trump administration is unpredictable, and has created a lot of uncertainty around other water issues in the West.
“We saw a veto of the Arkansas Valley pipeline by President Trump,” he said, referring to a project in Southeastern Colorado that would have delivered water to communities east of Pueblo. “We see money being withheld from the state of Colorado. So who knows what this administration might do?”
But there are also questions about what Reclamation can even do. In an environmental impact statement released last month, it outlined a few alternatives for how the agency could proceed, while emphasizing that it would prefer the states to come to an agreement themselves. Several of the alternatives include actions that the agency doesn’t currently have the legal authority to carry out, meaning it would need to go to Congress for additional powers, or renegotiate longstanding deals with states.
“It’s politics,” said Koebele. “It’s recognizing that the situation we’re in is so different that we’re even testing the limits of Reclamation’s authority.”
In the end it might not be the federal government’s hand forcing the states to make a deal, it could be pressure from Mother Nature. Record low snow totals this year in the river’s headwaters mean the hard decisions are coming sooner rather than later.
This story was produced in partnership withThe Water Desk at the University of Colorado Boulder Center for Environmental Journalism.
Copyright 2026 Rocky Mountain Community Radio. This story was shared via Rocky Mountain Community Radio, a network of public media stations in Colorado, Wyoming, Utah, and New Mexico, including Aspen Public Radio.
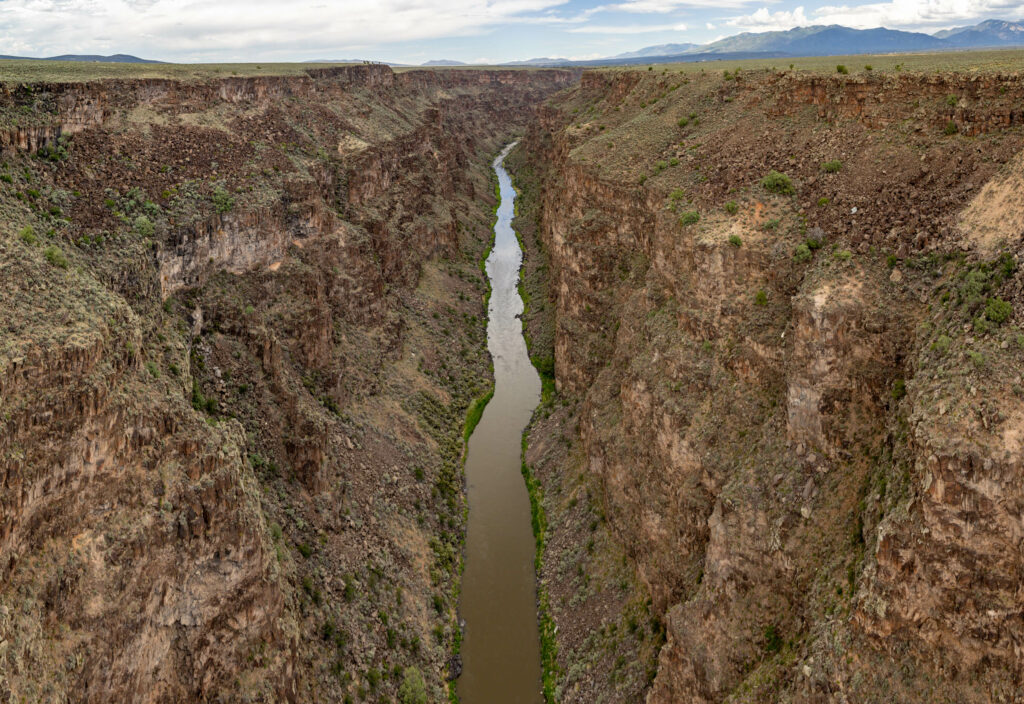
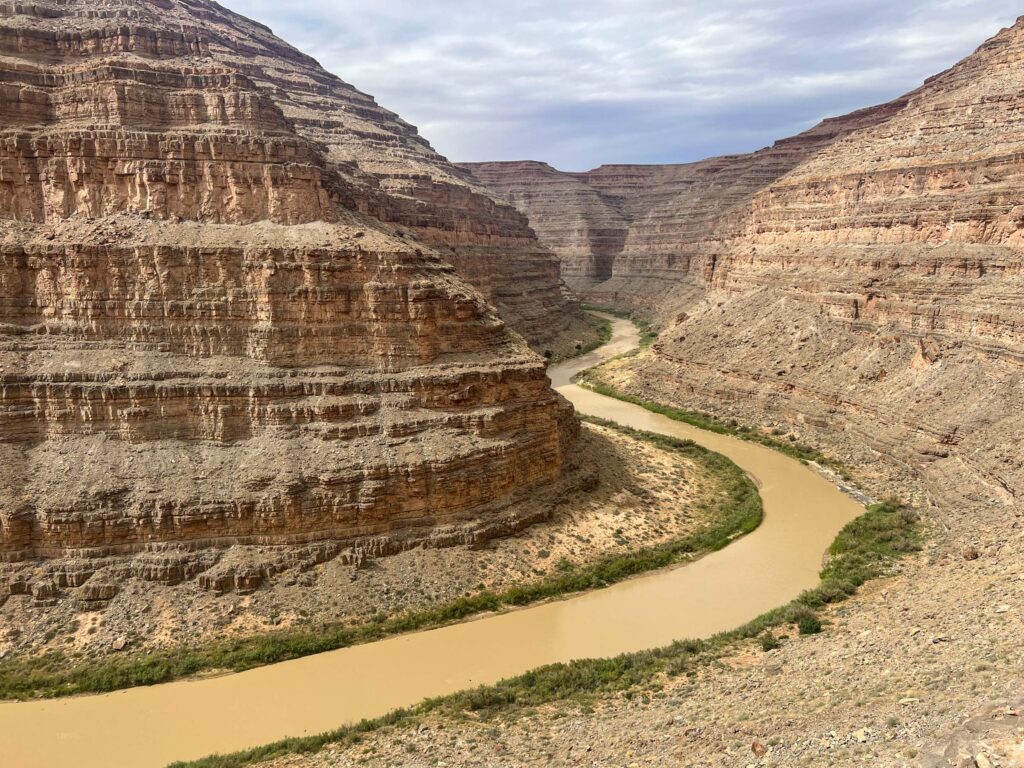
The Rio Grande Gorge near Taos, New Mexico, on June 24, 2024. (Mitch Tobin/The Water Desk)
The Water Desk is excited to announce the participants for our next Rio Grande journalist training and workshop, taking place in El Paso, Texas, in March 2026.
This training program will bring together journalists dedicated to enhancing coverage of water issues in the Rio Grande basin, fostering collaboration among news outlets and deepening understanding of critical challenges facing the region.
The Water Desk selected 15 journalists to participate in the training, reflecting diversity in geography, race, ethnicity, gender and medium.
Participants:
Brenda Bazán, Independent
Ana Bueno, Univision 45
Austin Corona, Independent
Bryce Dix, KUNM-FM
Caroline Gutman, Independent
Caroline Llanes, Rocky Mountain Community Radio
Sage Marshall,Independent
Verónica Martínez, Independent
Alaina Mencinger,The Santa Fe New Mexican
Diego Mendoza-Moyers, El Paso Matters
Carlos Morales, Independent
Amanda Pampuro, Courthouse News
Emily Payne, Independent
Martha Pskowski, Inside Climate News
Paul Ratje, Independent
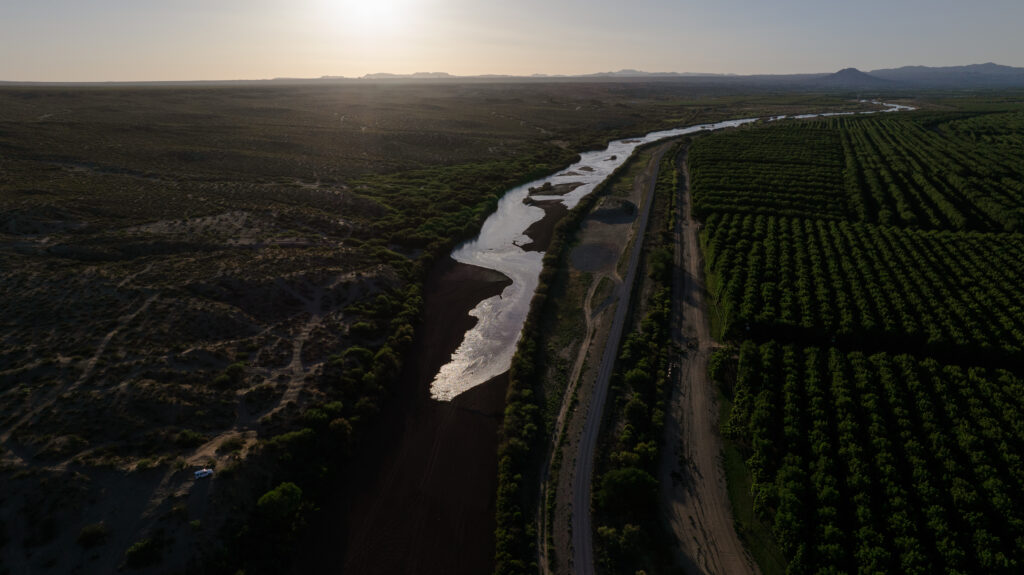
The Rio Grande starts in the Rocky Mountains of Colorado and flows through New Mexico and Texas, forming much of the U.S.-Mexico border. The river has experienced extremely low flows amid warming temperatures and declining snowpack. Coverage of the communities and ecosystems dependent on the Rio Grande is essential to understanding what’s at stake as the gap between water supply and demand widens.
As part of The Water Desk’s training program, participants will learn from legal experts, water users and tribal members in the river’s borderlands, gaining insight into varying perspectives on how the Rio Grande shapes the region’s culture, politics and ecology.
The workshop will feature sessions on the complexities of water management, field trips to sites in and around El Paso, and opportunities to network with peers and regional water experts. The Thornburg Foundation, a Santa Fe-based family foundation, is providing the financial support to make this training possible, while the program is the sole responsibility of The Water Desk.
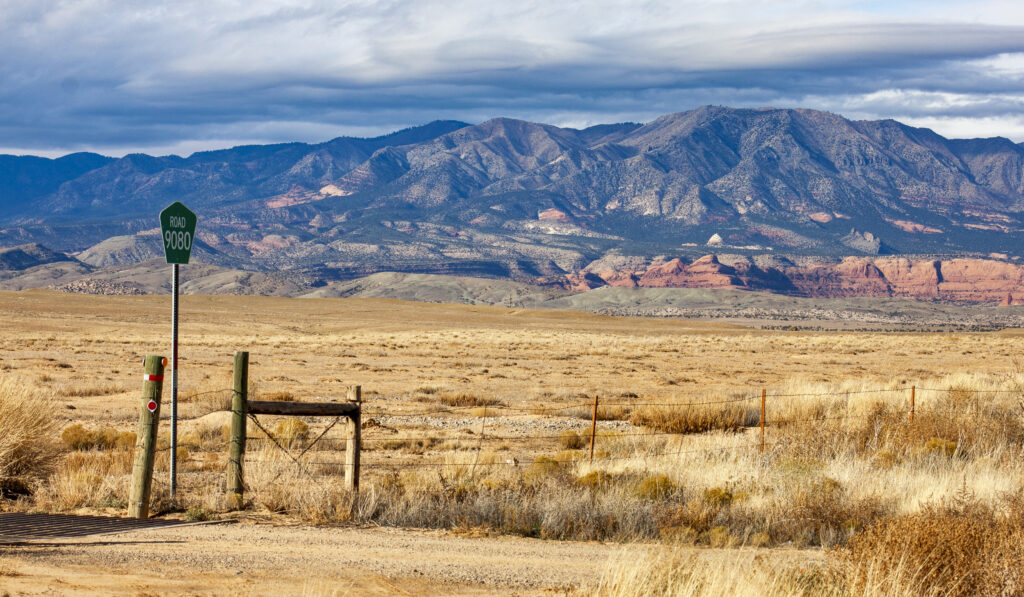
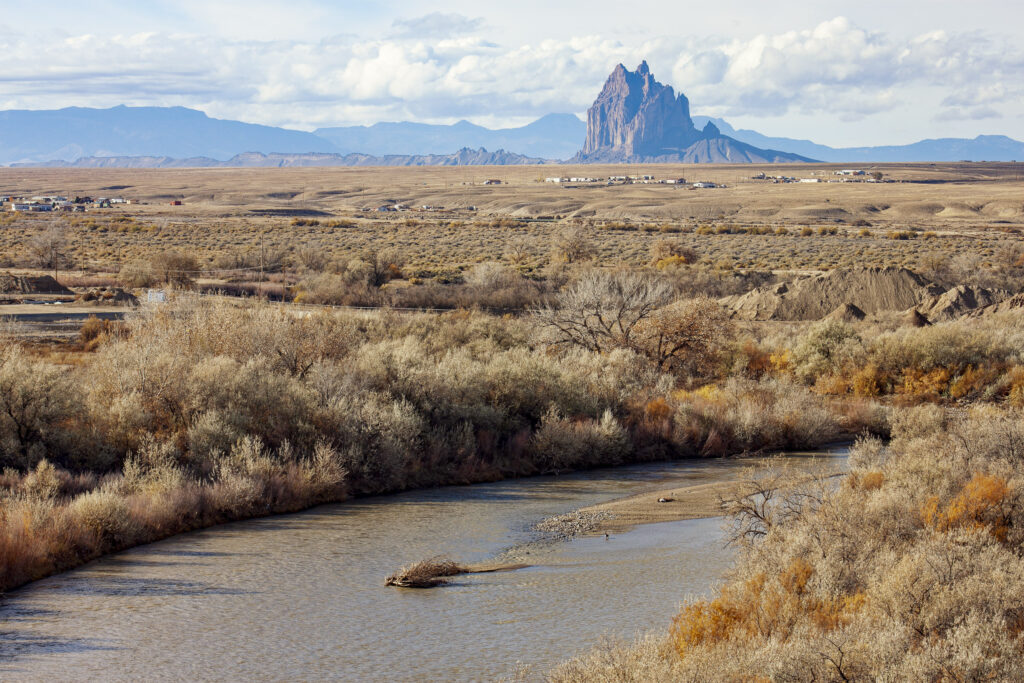
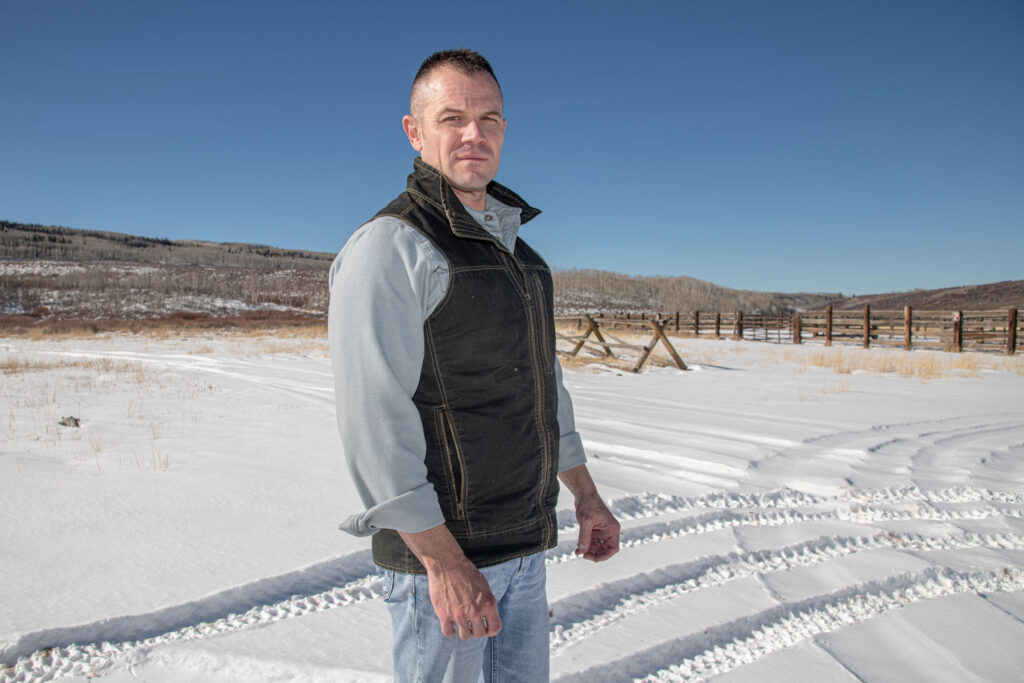
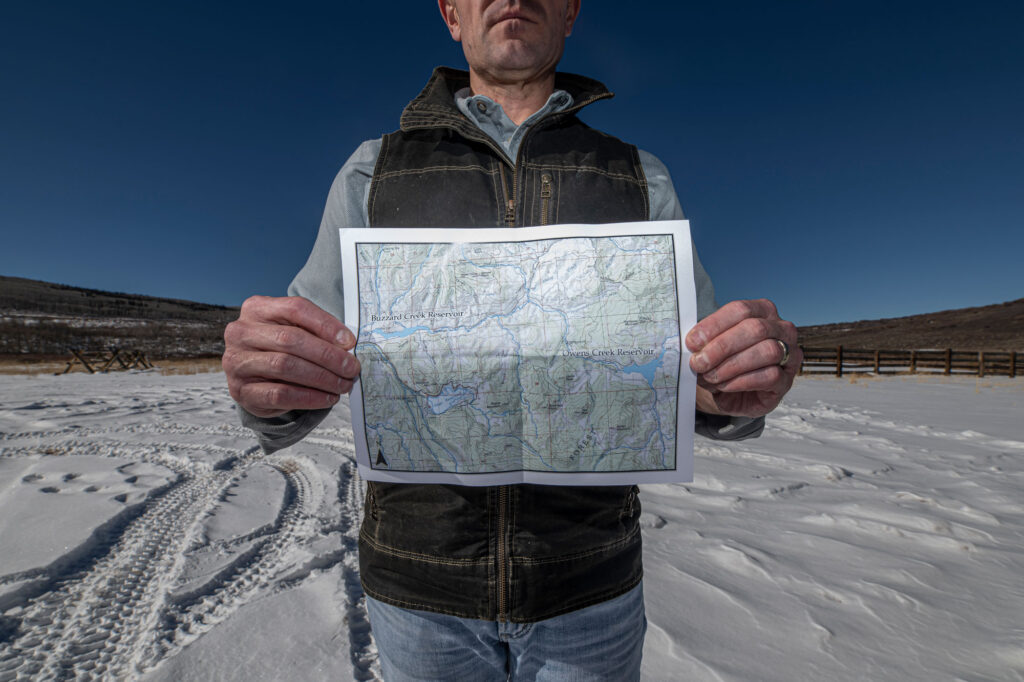
BECLABITO, N.M. – Standing in a breezy parking lot on Navajo land in the state’s far northwest corner, Tom Taylor looked toward the western horizon and then upwards at the furrowed mass of the Carrizo Mountains less than 10 miles away.
Water Desk Grantee Publication
This story was supported by the Water Desk’s grants program.
If all goes to plan, the infrastructure that could one day spill from the mountain’s flanks and through its core will become an essential piece of the region’s electric grid, able to store surplus electricity from renewable energy and other power sources for when it is needed later.
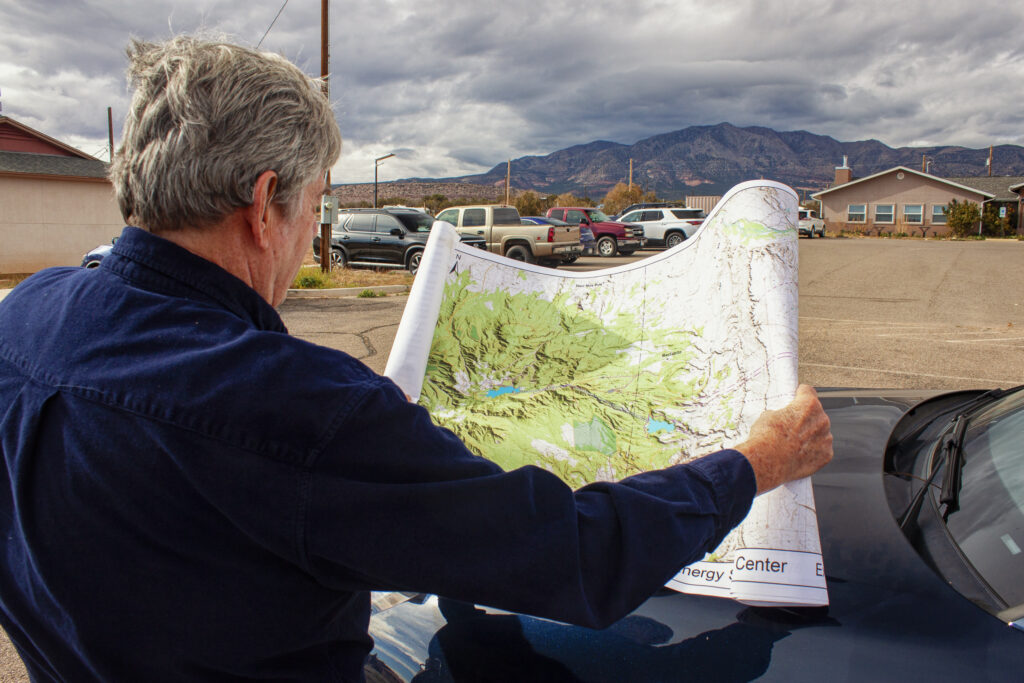
Fighting the wind that chilly November morning, Taylor used both hands to pin a detailed map against the hood of his Porsche Macan. A jumble of dashed lines and blue splotches representing proposed power lines, reservoirs, a water-supply pipeline, and access roads were printed atop the real-world geography on display in front of us.
“This will be a battery that lasts a long time,” Taylor said, holding tightly to the map.
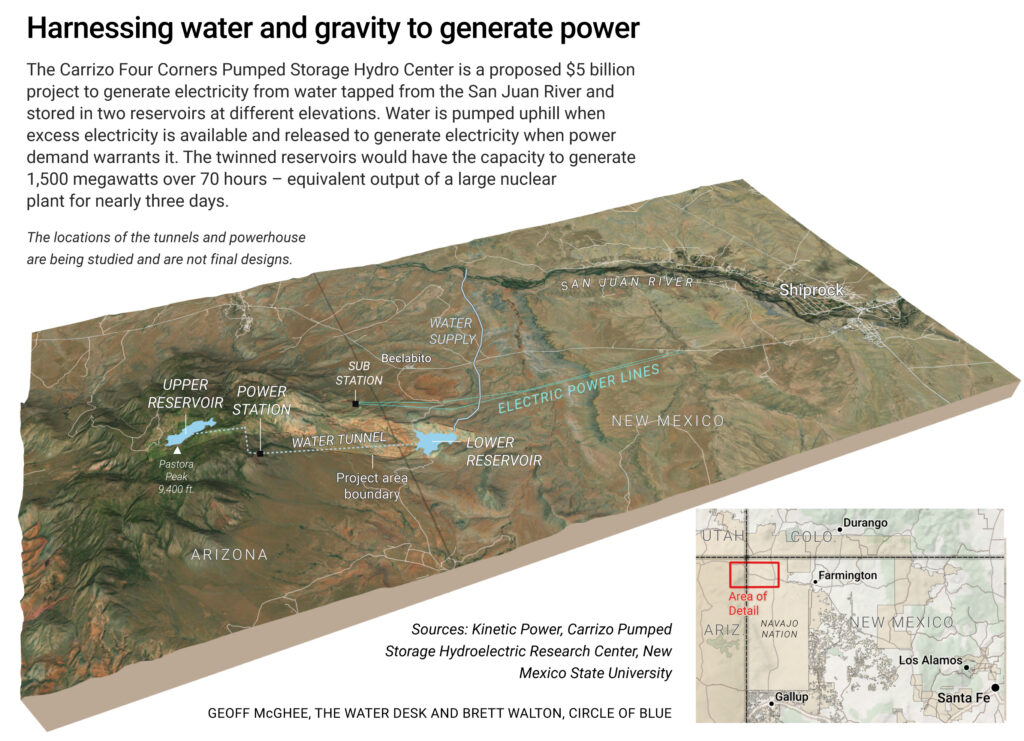
The project is the $5 billion Carrizo Four Corners Pumped Storage Hydro Center, which is designed to be one of the largest long-duration energy storage projects in the country. Pumped storage moves water between two reservoirs at different elevations. Water is pumped uphill when excess electricity is available and released to generate electricity when power demand warrants it.
The $5 billion Carrizo Four Corners Pumped Storage Hydro Center is designed to be one of the largest long-duration energy storage projects in the country.
Taylor, a former mayor of Farmington and a state House representative from 2000 to 2014, is employed by Kinetic Power, the three-person, Santa Fe-based outfit behind the Carrizo proposal. The company sees the project as a way to make the region’s electric grid more durable and cost-effective, not only by smoothing the intermittent nature of wind and solar but also as a bulwark against energy emergencies like the winter storm in 2021 that caused blackouts and 246 deaths in Texas. The twinned reservoirs, using water sourced from a Colorado River tributary nearby, would have the capacity to generate 1,500 megawatts over 70 hours – a form of battery that could provide the equivalent output of a large nuclear plant for nearly three days.
“We believe that the key is delivering economic value,” said Thomas Conroy, Kinetic Power’s co-founder, who has four decades of experience developing energy projects.
What seems straightforward when placing lines on a map is much less so in three dimensions. Carrizo Four Corners, which is still in the exploratory stage and is at least five years away from breaking ground, has nearly as many questions as answers at this point. What is the geology within the Carrizo Mountains? Will it support a 3,300-foot-deep shaft, a subterranean powerhouse, and dam abutments? How will drought affect the water supply? What cultural sites and wildlife might be at risk from construction? What are the power market dynamics?
Answering those questions is the goal of a $7.1 million, two-and-a-half-year Department of Energy grant that Kinetic and its six university and research partners secured in August. (The state of New Mexico and the research partners are also contributing $7.1 million.) On the political side, will future Navajo administrations feel as favorably toward Carrizo as current president Buu Nygren?
The technical questions are but one piece of an ambitious project that touches many of the most pressing questions about natural resources in the American West today: energy development, water use, and the relationship between federal law and tribal law.
Connecting Water and Energy
Though the details are still to be worked out, the project can be described in broad strokes.
The Federal Energy Regulatory Commission, which oversees federal hydropower licensing, granted Kinetic a preliminary permit in 2021. In February 2025 FERC extended the permit, which allows for site investigations but no construction work, for another four years.
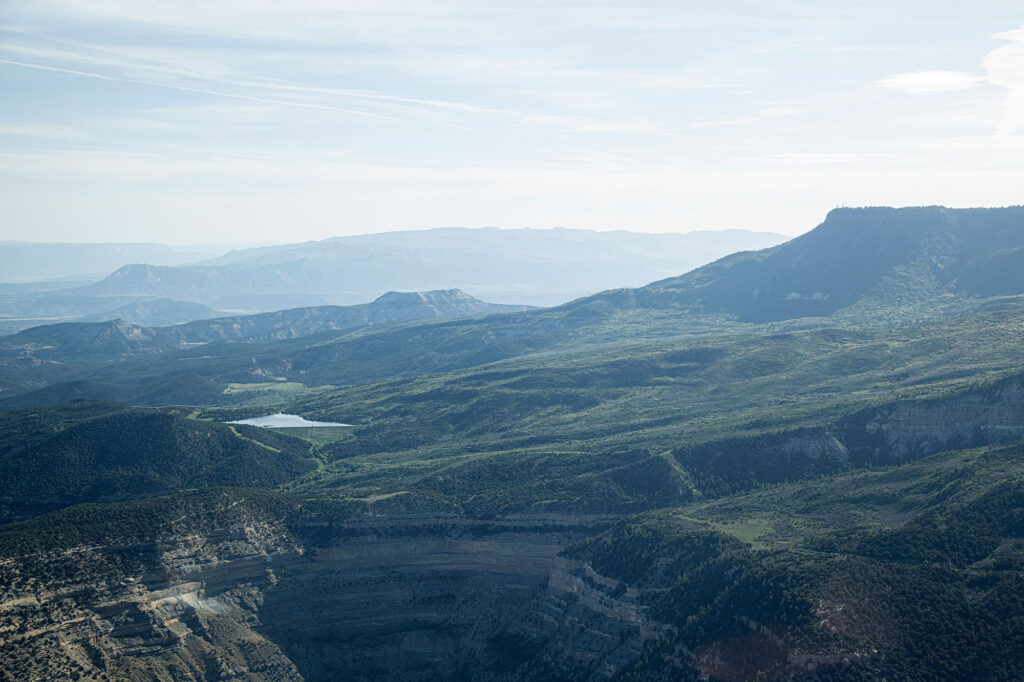
The company envisions two “off-channel” reservoirs that would not dam a flowing river. The lower reservoir will be near Beclabito. The upper, in the high reaches of the Carrizo Mountains. Both are on Navajo land, but on different sides of the Arizona-New Mexico border.
The powerhouse that holds the electricity-generating turbines will be located underground, some 3,300 feet below the upper reservoir. Some of the longest pumped storage tunnels in the country will be required to connect the reservoirs and the powerhouse.
Despite the geotechnical challenges, Conroy is particularly enthused by the site, which he said is the most optimal in Arizona and New Mexico – and possibly the entire country – to locate a pumped storage hydropower project.
The site stands out for four reasons, he said. It is near existing transmission corridors and grid connections due to the region’s legacy of enormous coal-fired power plants. And it will have a comparatively low capital cost for the energy it will produce.
The other two reasons relate to water. Because of the extreme height differential between the upper and lower reservoirs – almost three Empire State Buildings – less water will be required to produce a unit of energy than for reservoirs with a gentler gradient. And because the upper reservoir site is a deep canyon, surface area and thus evaporation will be minimized.
“Water is just top of mind here in the Southwest,” Conroy said. “And our project is as water-efficient as can be made.”
Water to fill the reservoirs would be drawn from the San Juan River, a tributary of the Colorado, via pipeline. The water would come from the Navajo Nation’s San Juan rights, which have been quantified but are not fully used.
How much water? In its FERC permit application, Kinetic estimated that the initial fill, which will take one and a half to two years, would require 38,300 acre-feet. To cover subsequent evaporation losses, the reservoirs would need to be topped up with 2,635 acre-feet per year. Those numbers will be refined in the feasibility studies.
“It’s what, about 1,300 acres of corn?” Taylor said, doing a rough mental calculation of the equivalent water consumption for the annual evaporation loss. “I think this is more valuable than 1,300 acres of corn.”
Saving for Tomorrow
So far the project has threaded the federal government’s fraught energy politics. The Trump administration is hostile to wind and solar, which in their eyes reek of liberal values. Two water-based technologies – hydropower and geothermal – have escaped condemnation and are listed in the administration’s energy dominance documents. The DOE grant that Carrizo secured is a holdover from the Biden administration’s infrastructure bill, which provided up to $10 million for feasibility studies for pumped storage projects that would store renewable energy generated on tribal lands.
Storage is the holy grail of renewable energy.
Storage is the holy grail of renewable energy. Human civilization has advanced, from the dawn of agriculture to the artificial intelligence revolution today, by being able to carry a surplus from one season and one year to the next. So it is with wind and solar. To maximize their utility and counteract their intermittent nature, engineers have been searching for cost-effective ways to store energy when the sun shines and when the wind blows for the days when neither of those things happen.
“If you want to improve the resiliency of the system, you either build more firm capacity instead of more renewable, or you build longer storage,” said Fengyu Wang, a New Mexico State University assistant professor who is the principal investigator for the DOE grant.
Storage has taken many forms. Some are fantastic mechanical configurations – lifting heavy objects and dropping them, or forcing air into caverns and releasing it. Thermal options use molten salt to trap the sun’s heat. The most familiar are batteries, which leverage chemical energy. But the most common, at least in the U.S., is pumped storage hydropower.
The 43 pumped storage facilities in the U.S. represent the bulk of the country’s utility-scale energy storage. They accounted for 88 percent of the total in 2024, according to Oak Ridge National Laboratory. That is changing quickly, however, as more battery storage comes online. The share for pumped storage was 96 percent in 2022.
Still, long-duration storage is where pumped storage shines. According to Oak Ridge, the median battery storage is two hours. For pumped storage, it is 12 hours. Longer duration provides more buffer, not only from day to day but also season to season.
In that regard, Carrizo would signify a huge leap. The only comparable pumped storage project under consideration in the U.S. is Cat Creek, in Idaho. Even though its duration is 121 hours, its generating capacity is less than half, at 720 megawatts.
Carrizo will have a different use case than other U.S. pumped storage projects, Conroy said. Many facilities have one customer and one generator. A nuclear plant, for instance, might be paired with a pumped storage system so that the nuclear plant can run continuously.
For Carrizo, there might be a consortium of utilities that have multiple generating sources feeding into this project and moving the water uphill. They would take delivery of that power across a large region with different climatic conditions and different needs for when and how they use the stored power. That means operating the facility will be more complicated than a traditional pumped storage project. One thing is certain, Conroy said: the Navajo will have an equity stake.
Tribal Outlook
Caution on the part of the Navajo would be understandable. The tribe’s lands have long been the center of energy developments with environmentally ruinous but economically helpful outcomes.
Uranium mining to fuel the Manhattan Project and then the nation’s reactors polluted rivers and groundwater, as did the coal mines that fed Four Corners Power Plant and the now-shuttered Navajo Generating Station and San Juan Generating Station. On the other hand, these developments provided employment and income. Navajo Mine, which supplies Four Corners Power Plant, accounts for about 35 percent of the Navajo Nation’s general fund.
Navajo and other tribal lands in the Four Corners region have been the target for a handful of pumped storage proposals in recent years. The Navajo Nation opposed three projects proposed for the Little Colorado River watershed, which were either withdrawn by the developer or denied a permit by FERC. Two other projects – Carrizo and Sweetwater, both using San Juan River water – are still in development. Sweetwater, a smaller project with eight hours duration, is co-developed by the Ute Mountain Ute Tribe and Gridflex Energy. A third project, Western Navajo Pumped Storage, which would be located near the former Navajo Generating Station, received a FERC preliminary permit in August.
Carrizo has not run into the same level of opposition as the other proposals. In part that is due to the proposed use of the San Juan River instead of groundwater, said Erika Pirotte, an assistant attorney general in the Navajo Nation’s water rights unit. Many Navajo communities rely on groundwater, and using it for pumped storage was viewed as unreasonable.
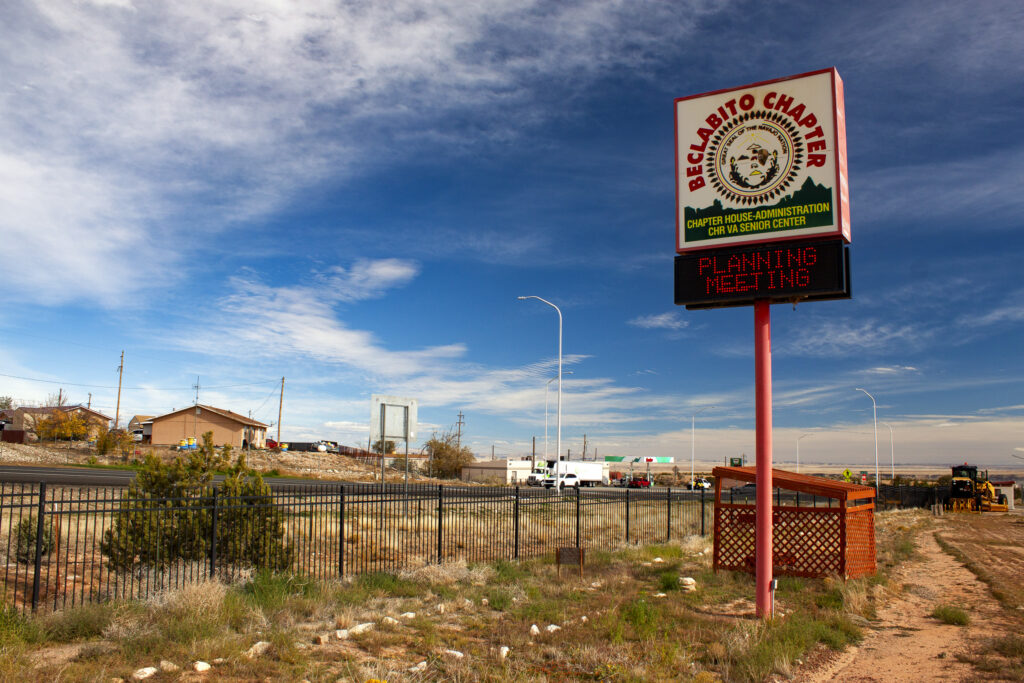
The lack of strong opposition is also because of Kinetic’s engagement with the Navajo Nation. The company has held meetings with the Beclabito, Red Valley, and Teec Nos Pos chapters, in addition to meetings with Navajo Nation agencies and Buu Nygren, the Navajo Nation president. Kinetic has a memorandum of understanding with Nygren, who also signed a letter of support for the project’s DOE grant application.
“We have the support of the council,” Conroy said. “We have a very high level of support from the president, and he is just extraordinarily interested in this project and seeing that it moves forward.”
From the Navajo perspective, what is interesting are the “ancillary benefits” that could come from the water supply pipeline, Pirotte said. Once the reservoirs are filled and the pipeline’s full capacity is not needed, the extra space could be repurposed for tribal water supply uses.
“That’s why the feasibility studies are really important for the Nation, because they help us understand to what extent Navajo Nation resources would be used for the project,” Pirotte said.
None of this is immediately around the corner, Conroy cautions. The DOE grant extends for more than two years. The FERC permitting process could be another two to four years. With Congress and the Trump administration talking about faster permitting and better coordination, that timeline is a best guess.
And then there is the question of tribal authority in the permitting process, not just for the Carrizo project but for other such developments. Will FERC abide by its 2024 stance that preliminary permits for hydropower projects on tribal lands require tribal consent? The Trump administration would like to see that policy scrapped. If FERC approves a project must a tribe assent to all the associated infrastructure? Will the Navajo be allowed to conduct reviews and issue permits?
And then there is construction, the biggest component. That will take four to six years, Conroy said.
Even on an ambitious timeline, Carrizo is not operating until the mid-2030s.
“I’m 77,” Taylor said. “I probably won’t see it.”
This story was produced by Circle of Blue, in partnership with The Water Desk at the University of Colorado Boulder’s Center for Environmental Journalism.
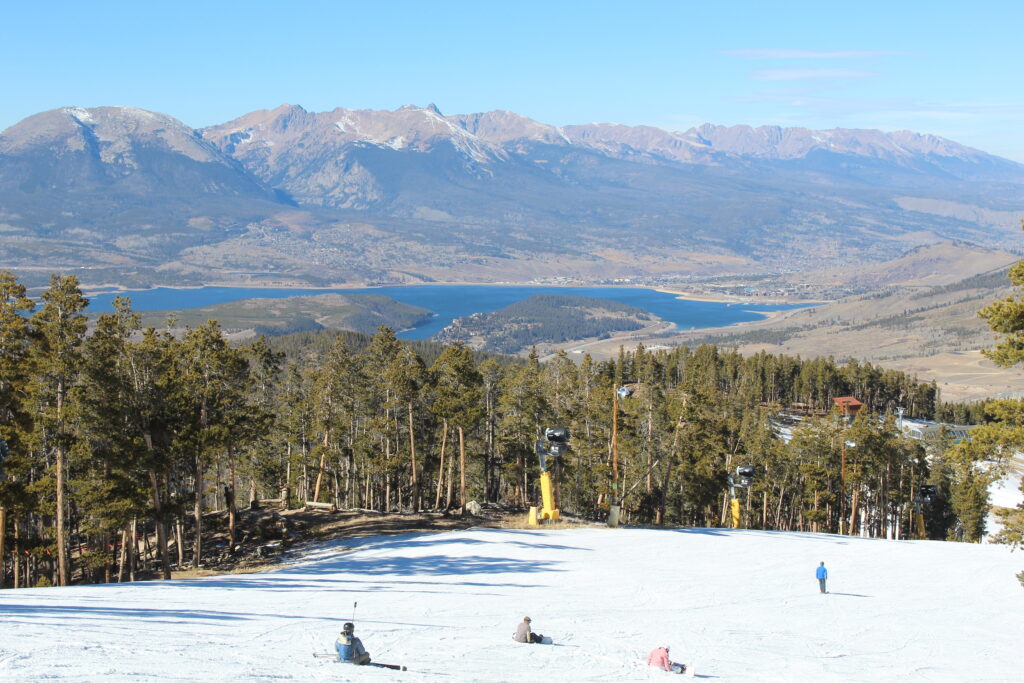
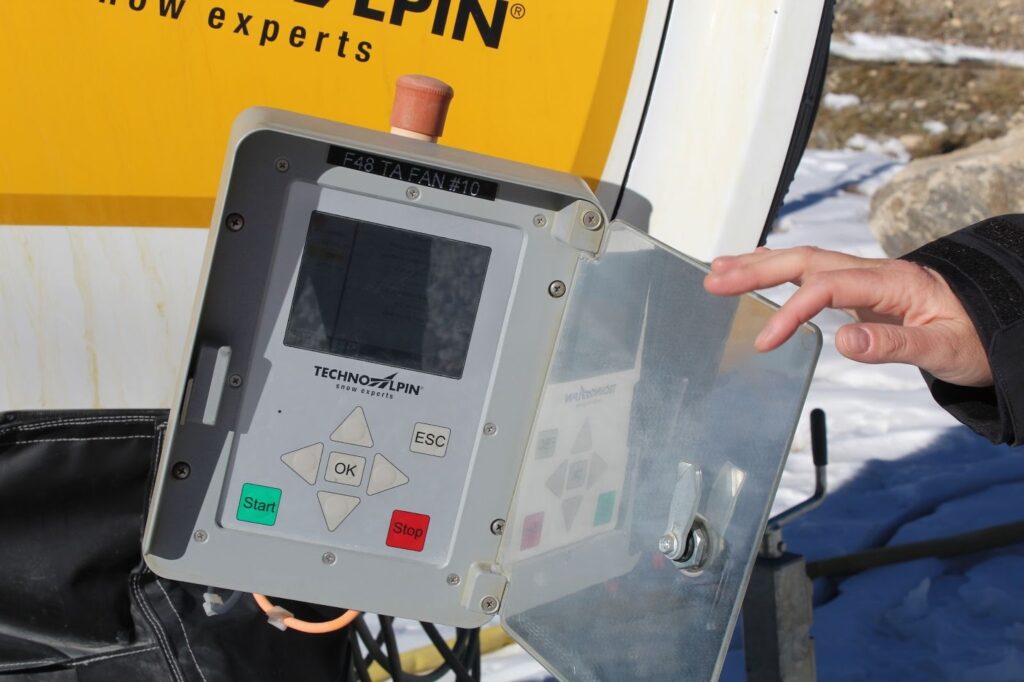
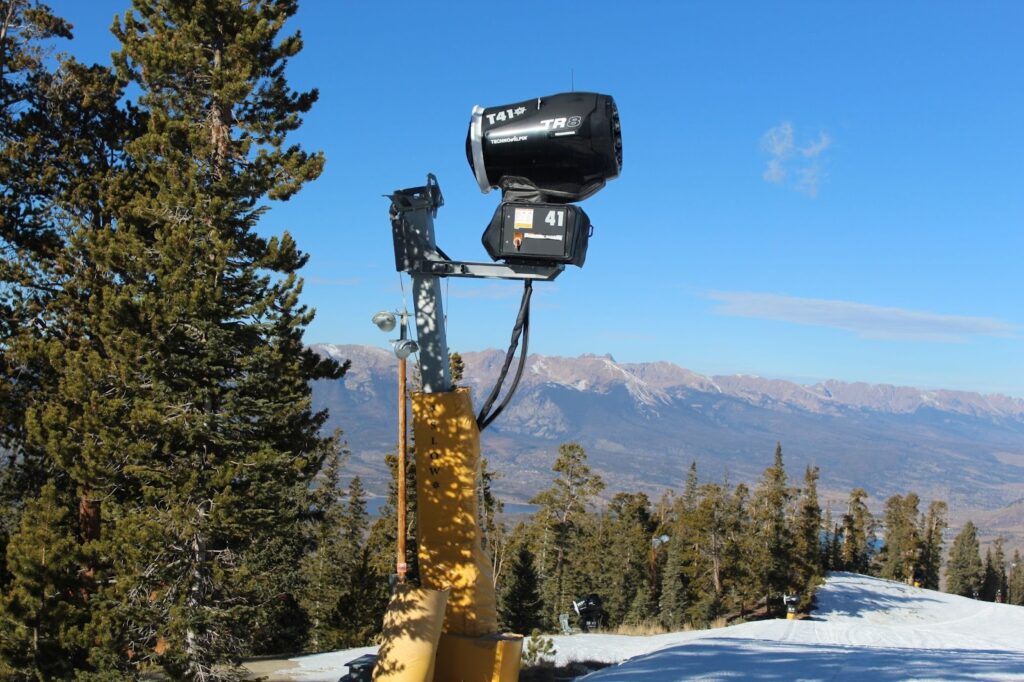
Schoolmarm, a beginner-friendly run at Keystone, offers views of Dillon Reservoir all the way down to the base of the mountain. Snowmaking guns line the run’s entire length, and use water from the reservoir for operations. (Caroline Llanes/Rocky Mountain Community Radio)
As guests ski and ride down Schoomarm, a stretch of beginner-friendly terrain at Keystone Resort in Colorado, they are treated to views of Dillon Reservoir nearly the whole way down. More eagle-eyed skiers and riders will notice that snowmaking machines line the run’s three miles, which spans from summit to base.
On a sunny, cloudless November day, it’s one of the resort’s only accessible ski runs with much of the credit going to those machines.
“It gives pretty much everybody the ability to ski here on day one,” said Kate Schifani, the resort’s senior director of mountain operations. She says Keystone is super focused on that early opening day.
“We are the first resort in the country to open,” she said, referring to the 2025 season. “So we put a lot of stock in what we can do early-season, and having great snowmaking helps us do that.”
It’s a familiar problem for Rocky Mountain ski resorts over the last 20 years, which have become increasingly prone to scant early season snow. Many have chosen to stick with their traditional opening days near the Thanksgiving holiday and take the gamble that snow might arrive in time. To match their guests’ demands for skiable acreage amid a warming climate, resorts are doubling down on snowmaking technology and acquiring the water rights needed to make it happen.
Winter is off to a slow start across the West this year. Snowpack is below average in every major river basin across the entire region. That’s a concern for ski resorts, many of which have delayed their opening days. That includes Jackson Hole in Wyoming, Alta in Utah, and Beaver Creek, just down the highway from Keystone.
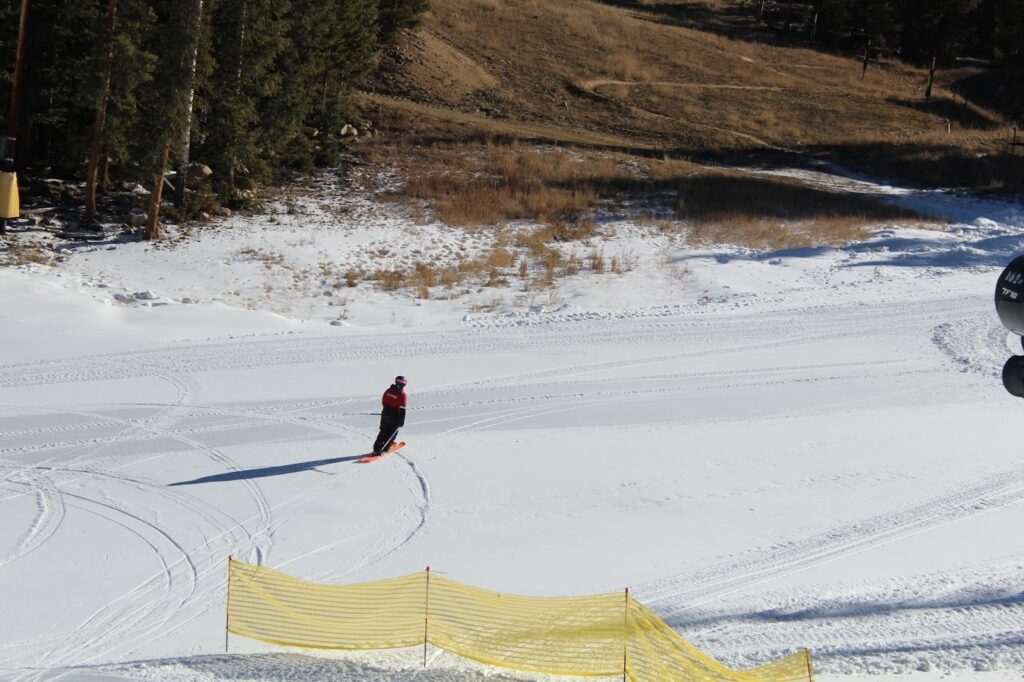
Keystone’s Kate Schifani skis over to one of the resort’s pumphouses, which transports water to its snowmaking machines. The slow start to winter meant that in November, large patches of mountain still had no snow cover. (Caroline Llanes/Rocky Mountain Community Radio)
Human-caused climate change has changed the way precipitation falls in the mountains, especially in autumn. As more early season storm clouds bring rain instead of snow, resorts are increasingly relying on snowmaking to give their guests the ability to ski at all.
But this year, it wasn’t just a lack of snow that caused resorts headaches. November was warm as well, which also affects snowmaking operations. Throughout the Upper Colorado River Basin, temperatures were anywhere from five to eight degrees above average, with much of Utah setting records. Denver logged its warmest November day ever this year.
Schifani said ideally, snowmaking happens when it’s colder than 28 degrees.
“So it’s 32.7 degrees right now,” she said, checking the temperature on a monitor attached to one of the snow guns at the top of the River Run gondola. “So we’re just a little too warm for snowmaking.”
Keystone made upgrades to its snowmaking system in 2019, so all of its guns are relatively new. Each one has a weather system built into it, detecting temperature and relative humidity. They’re all automated, so when it finally drops below 28 degrees, the guns turn on with a loud rumble.
Schifani shows where the weather systems on Keystone’s snow guns are located. These systems allow the gun to sense when it’s cold enough to make snow, and they turn on automatically. (Caroline Llanes/Rocky Mountain Community Radio)
“This gun will know as it gets colder, we can add more water, we can make more snow,” Schifani explained. “As it gets warmer, we cut back on the water, we make a little bit less snow until it gets too warm for us to make snow at all.”
Once it’s cold enough, man-made snow takes about two parts compressed air and one part water. Unlike other uses in the West that transport water over long distances to sprawling cities or faraway farm fields, snowmaking keeps water close to where it originated.
Steven Fassnacht, a professor of snow hydrology at Colorado State University, said that about 80% of the water used in snowmaking goes back into the watershed it came from.
Snow guns line Keystone’s three-mile beginner run, Schoolmarm, for a consistent skiing experience from top to bottom. (Caroline Llanes/Rocky Mountain Community Radio)
“(Ski resorts) are taking water out of the river, out of a reservoir… and they’re putting it on the mountain and they’re storing it somewhere different for the winter,” he said. “So the actual use, we call it consumptive use, the amount of water that leaves the system is relatively small.”
But that use still matters in a region where every drop of water is accounted for. Fassnacht said it will matter even more as the region’s climate gets warmer and drier, and as competition for water ramps up.
“In drier conditions, maybe that water use—possibly, likely—that consumptive use is actually going to increase,” he said. “And it may be harder to actually get that water out of the system to put on the mountains.”
Ski areas’ water usage can get contentious. Telluride Resort is currently in a dispute with the town of Mountain Village over its water use, and a federal court recently dismissed a lawsuit from Purgatory, a resort near Durango, over accessing decades-old groundwater rights on Forest Service land.
Chris Cushing is a principal with the consulting firm SE Group, which works on mountain planning for resorts across the country.
He recently worked with Deer Valley in Utah on a massive expansion: the resort added ten new chairlifts and doubled its skiable terrain, which it plans to open this season — with a state of the art snowmaking system.
“It’s just massive, it’s literally building a new ski resort,” he said of the expansion, which is called East Village.
Cushing says the expansion was only possible because the land acquired by Deer Valley already had water rights allocated to it — a calculation many other resorts he works with are having to factor in their plans as well.
“Absolutely the first question I ask is, ‘what’s your water situation?’” he said.
Long-term drought means ski resorts aren’t just in the game of acquiring new supplies, but also how to make the water they do have go further.
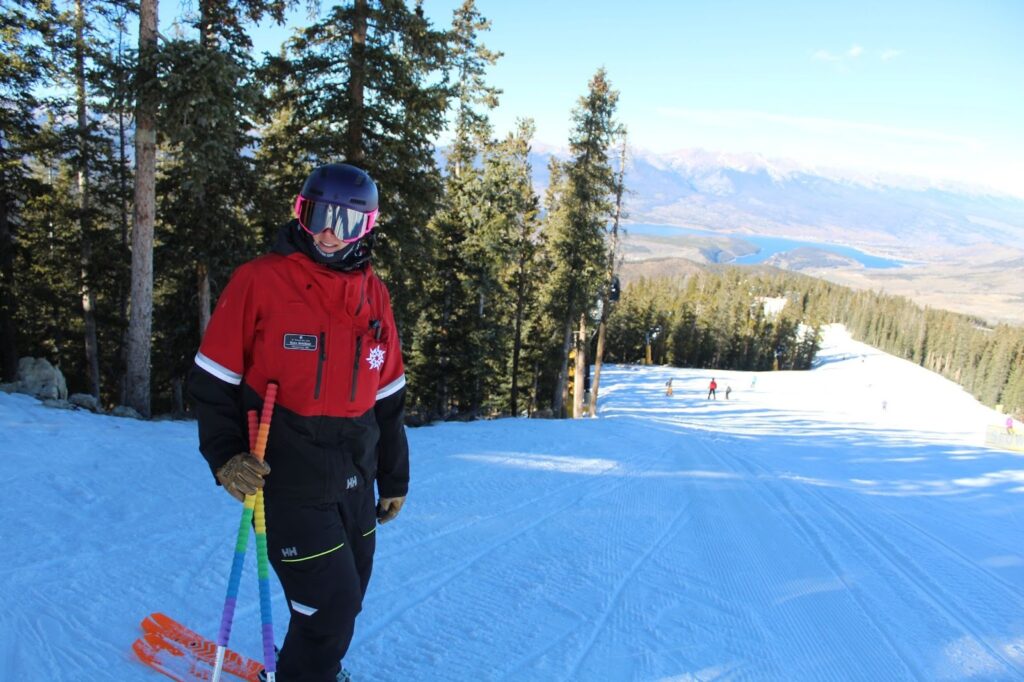
Kate Schifani, Keystone’s senior mountain operations director, oversees the resort’s snowmaking. She says Schoolmarm is prioritized for snowmaking, so guests of all skill levels can get in on the early season action. (Caroline Llanes/Rocky Mountain Community Radio)
In 2023, Keystone added a new chairlift, providing skiers and riders easier access to its Bergman Bowl, which used to be an area only hikers could reach. Schifani says the resort expanded its snowmaking system to blanket that area at will too.
“But for perspective, that didn’t take any more water than we had previously used because we just got better at using what we already have,” she said.
It’s not yet clear what this winter will bring for the ski industry, but resorts, like other water users across the West, will have to prepare for the reality of doing more with less.
This story was produced in partnership with The Water Desk at the University of Colorado Boulder Center for Environmental Journalism.
Copyright 2025 Rocky Mountain Community Radio. This story was shared via Rocky Mountain Community Radio, a network of public media stations in Colorado, Wyoming, Utah, and New Mexico, including Aspen Public Radio.
Elephant Butte Reservoir, along the Rio Grande near Truth or Consequences, N.M., in August 2022. (Mitch Tobin/The Water Desk)
This program is no longer open to applications.
The Water Desk is excited to announce an in-person training and workshop for journalists interested in covering the Rio Grande watershed to be held in El Paso, Texas.
The Rio Grande faces significant challenges: climate change, aridification, pollution, development, population growth, invasive species and more. The river forms a portion of the U.S.-Mexico border and is a critical water supply for three U.S. states—Colorado, New Mexico and Texas. As supplies shrink and tensions ramp up, litigation among the river’s users continues to make headlines. Tense diplomatic relations between the U.S. and Mexico are affecting the Rio Grande as well.
To equip journalists to better understand the river’s current and future challenges, The Water Desk will host a training program for journalists in El Paso, Texas, on March 25-27, 2026. Participating journalists will hear from legal experts, tribal leaders, environmental advocates and other speakers who can shed light on the Rio Grande.
We will select up to 15 participants who represent diversity in geography, race, gender and journalistic medium. Travel, lodging, meals and other expenses will be covered for all attendees. Additional funding for story coverage after the training will be made available. The program will begin the evening of March 25 and conclude in the afternoon on March 27.
The Thornburg Foundation, a Santa Fe-based family foundation, is providing the financial support to make this training possible, while the program’s content is the sole responsibility of The Water Desk. Deadline for applications is Monday, January 12, 2026 at 11:59 pm Mountain.
Testimonials from journalist-participants at our 2025 Rio Grande workshop, held in Albuquerque, New Mexico:
“The most valuable part of the workshop was the boost of inspiration and support I got from spending 2.5 days with other passionate journalists and advocates.”
“I loved the collaboration opportunities, I loved the speakers, I loved the venue, I loved the opportunity. The whole thing was the best part of my journalistic year and was truly the jump start I needed.”
“I came for the information, but found that in the end the most valuable part of the workshop were the new relationships with fellow journalists I came away with.”
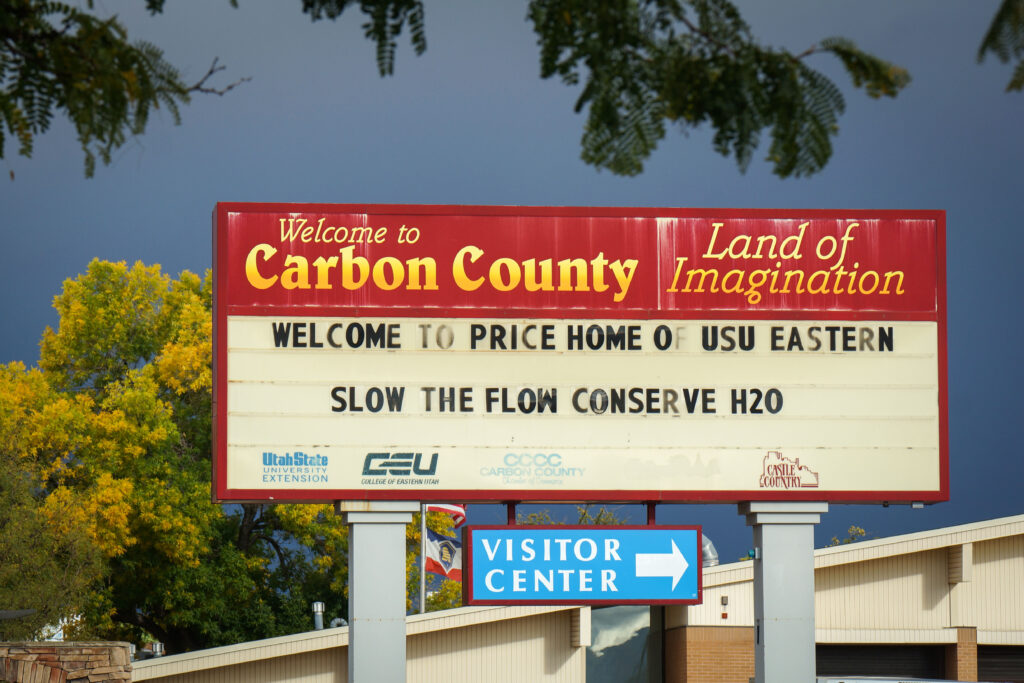
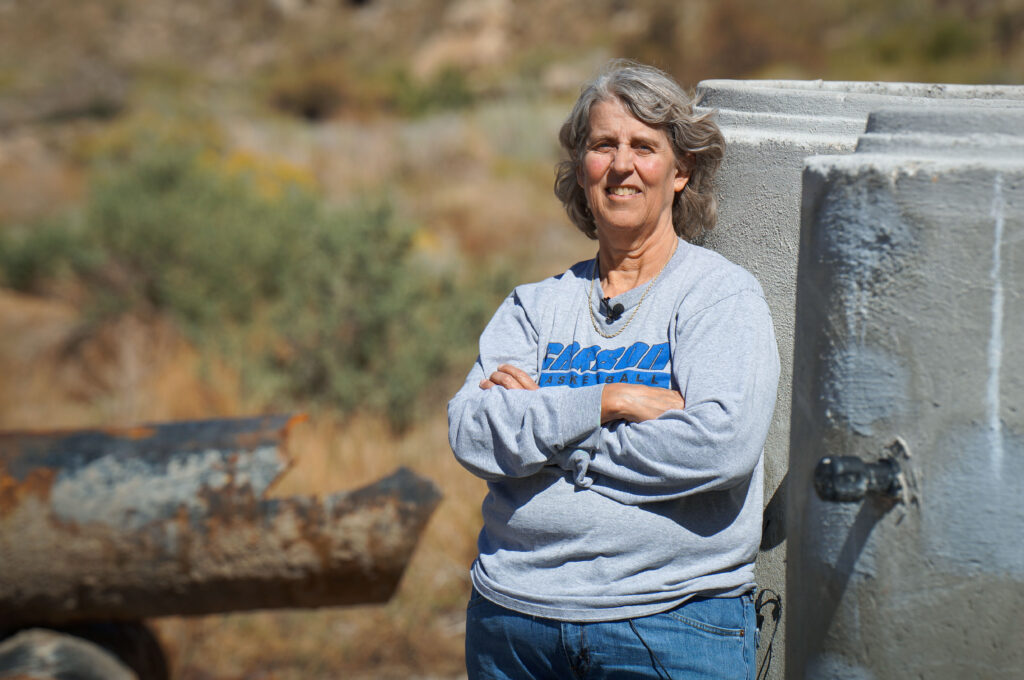
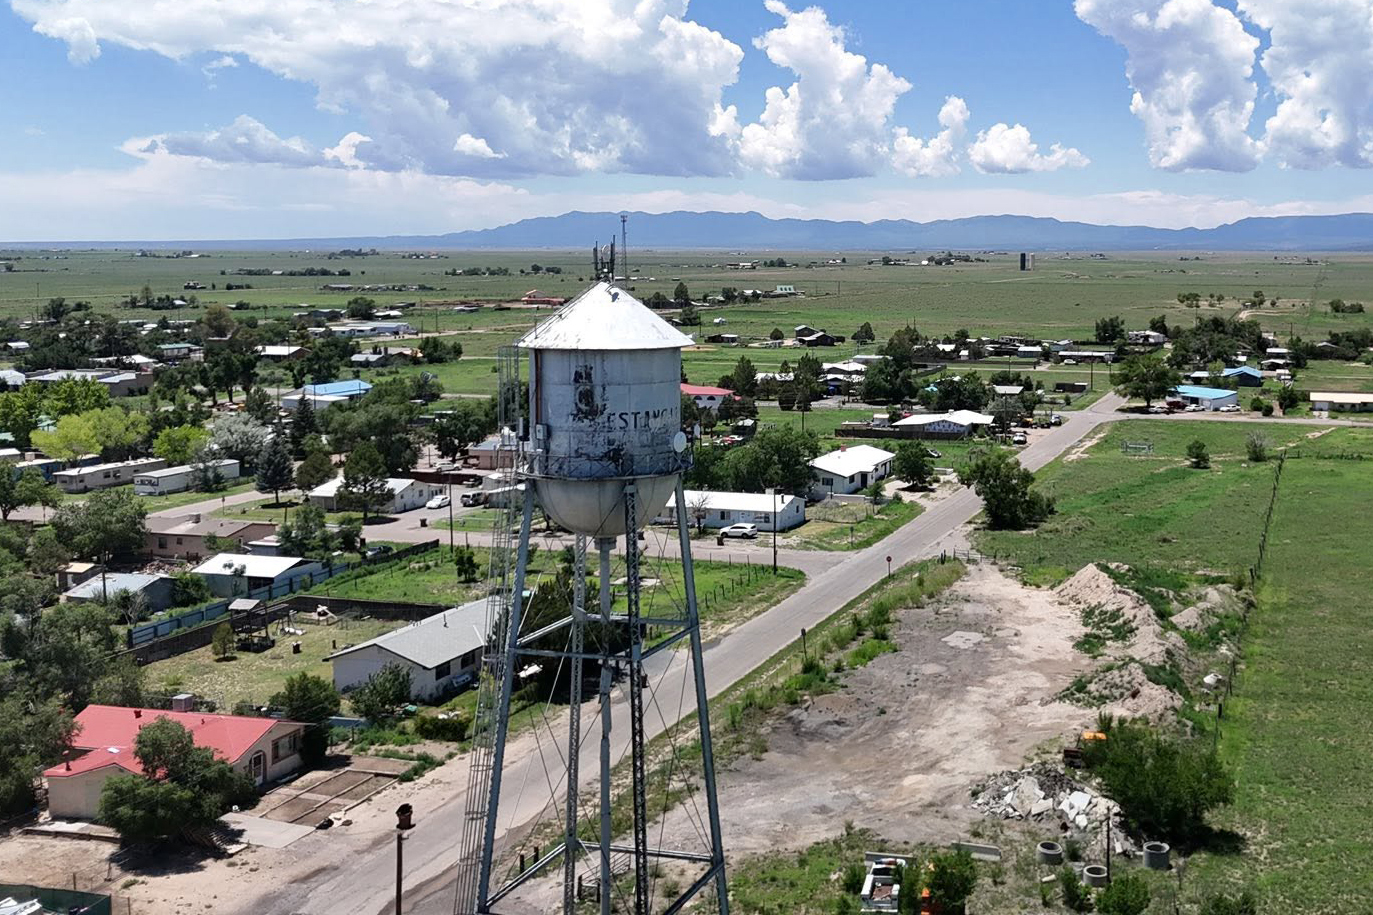
A welcome sign in Price reminds residents to save water, Sept. 30, 2025. Consistent messaging is likely one of the reasons Carbon County has become a leading county for conservation in Utah. (David Condos/KUER)
Water Desk Grantee Publication
This story was supported by the Water Desk’s grants program.
One size fits all. That’s great for hats in the Zion National Park gift shop but not for water conservation goals.
So at the start of this decade — and for the first time — Utah figured it would ditch that statewide approach and set goals that account for regional differences in water supplies and uses.
After all, life in Salt Lake County isn’t like living in the eastern rural counties along the Colorado border. Water, as it turns out, “is very hyperlocal,” said Candice Hasenyager, director of the Utah Division of Water Resources.
To meet a statewide conservation goal of 16%, the decade-long effort aims to reduce the water used in homes, schools and businesses. Individual targets were set for each county to make it happen. Farm irrigation isn’t part of it — there are other ways to save water there. While it’s true that most of Utah’s water goes to agriculture, “ag is not always where the people are,” Hasenyager said. So, how Utahns conserve in cities and towns still matters.
Halfway through the initiative, however, the results are mixed.
“There are some areas that have already exceeded the goals, which is great,” Hasenyager said. “Then there are other areas that we know need to do a lot more work.”
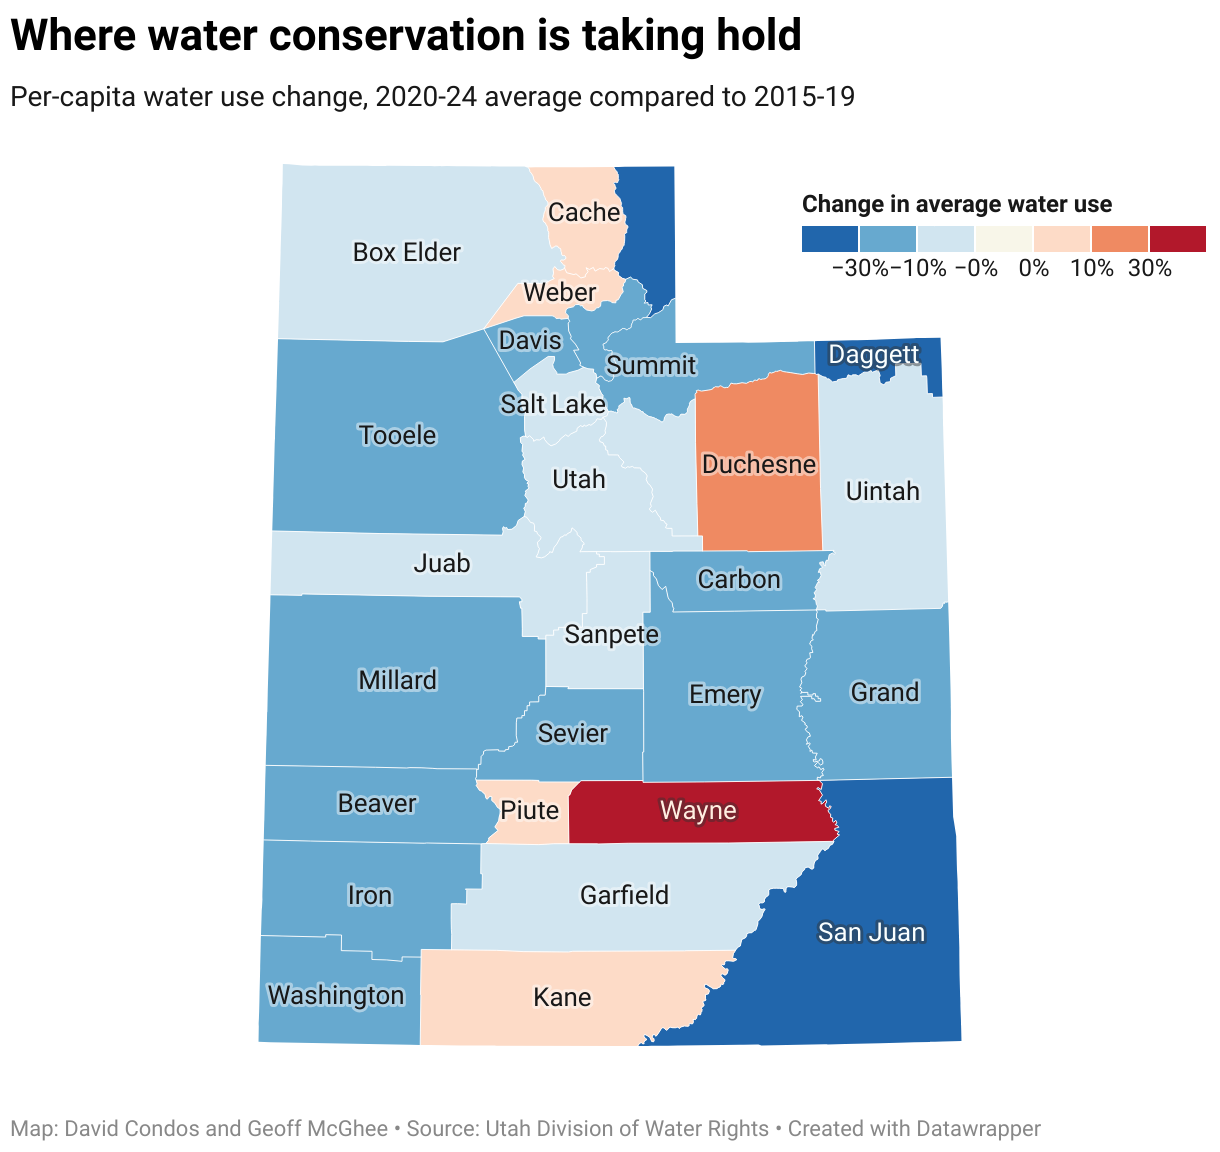
Fifteen of Utah’s 29 counties have reached their annual 2030 goals at least once in the past two years. That list of success stories ranges from the most populated county, Salt Lake, to the least, Daggett. Washington, Iron and Tooele counties hit their targets in at least one recent year, too. But 14 other counties have not, including Weber, Juab and Box Elder.
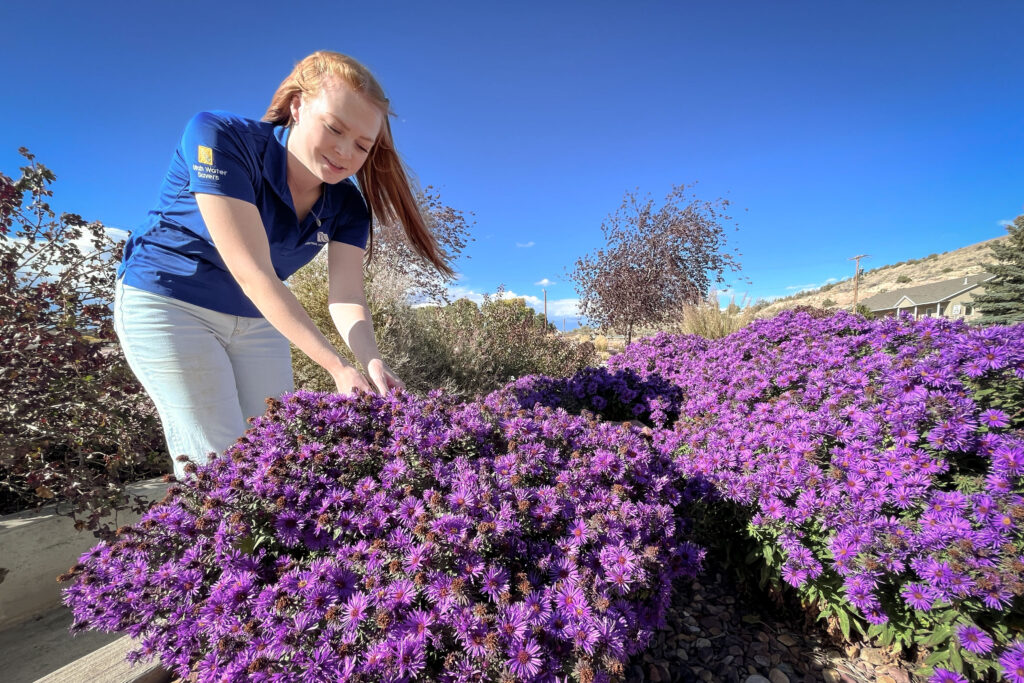
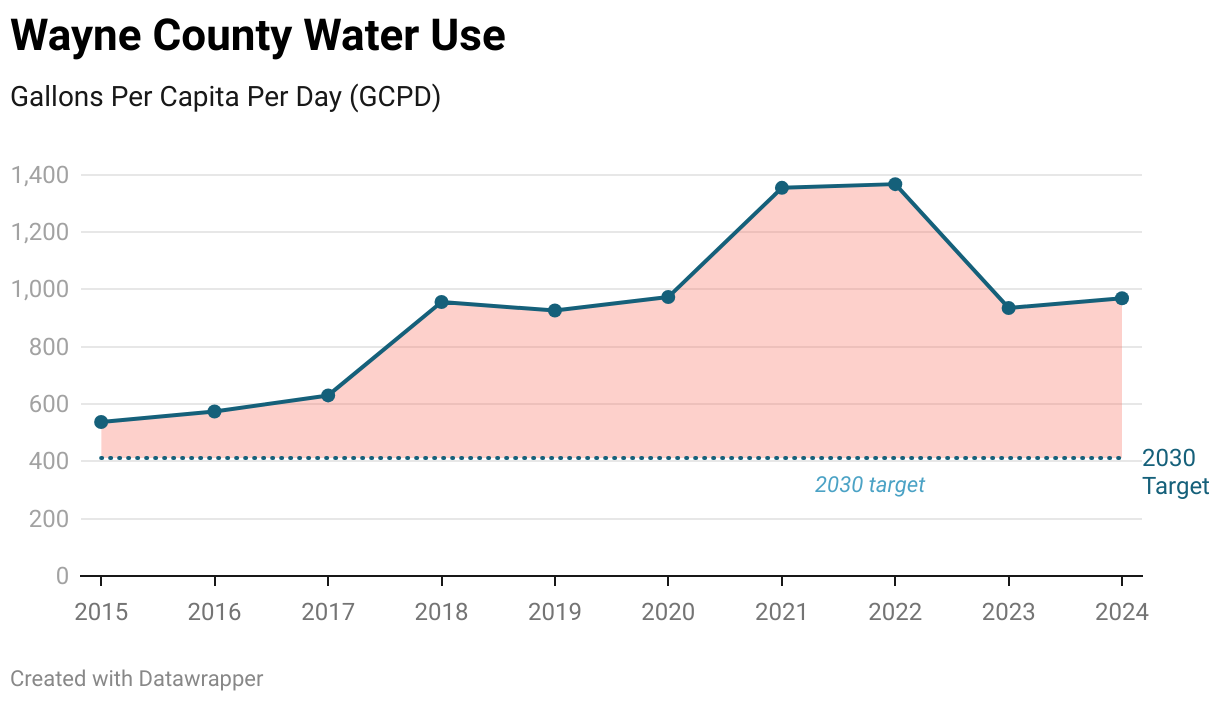
Four rural counties in Utah’s Colorado River Basin — Carbon, Duchesne, Uintah and Wayne — are a microcosm of the state’s successes and struggles.
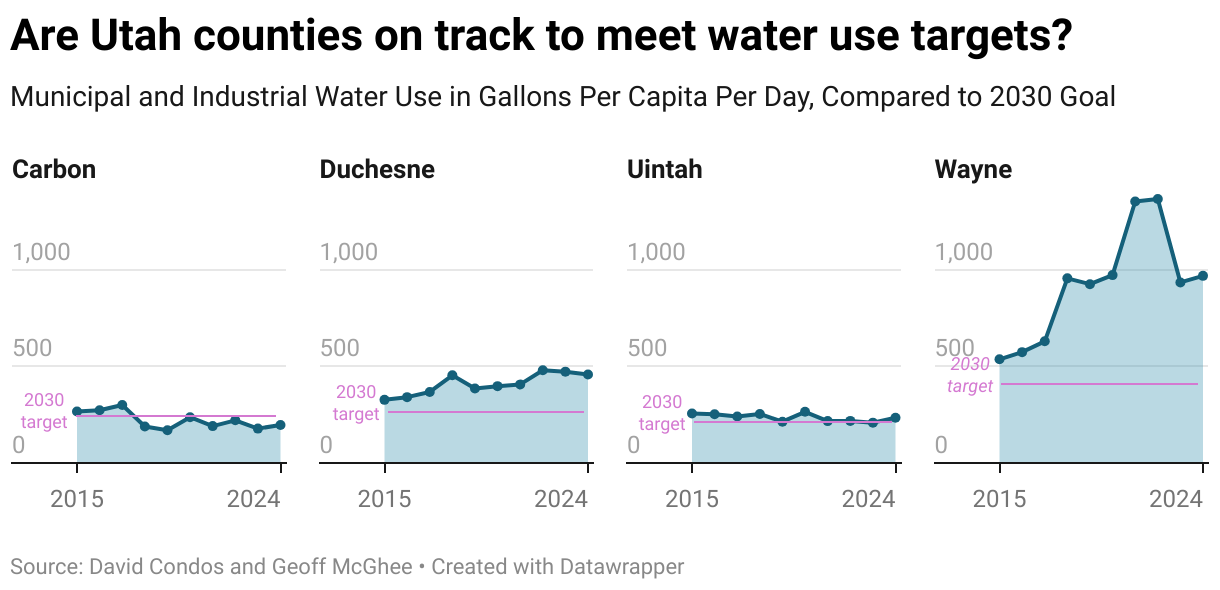
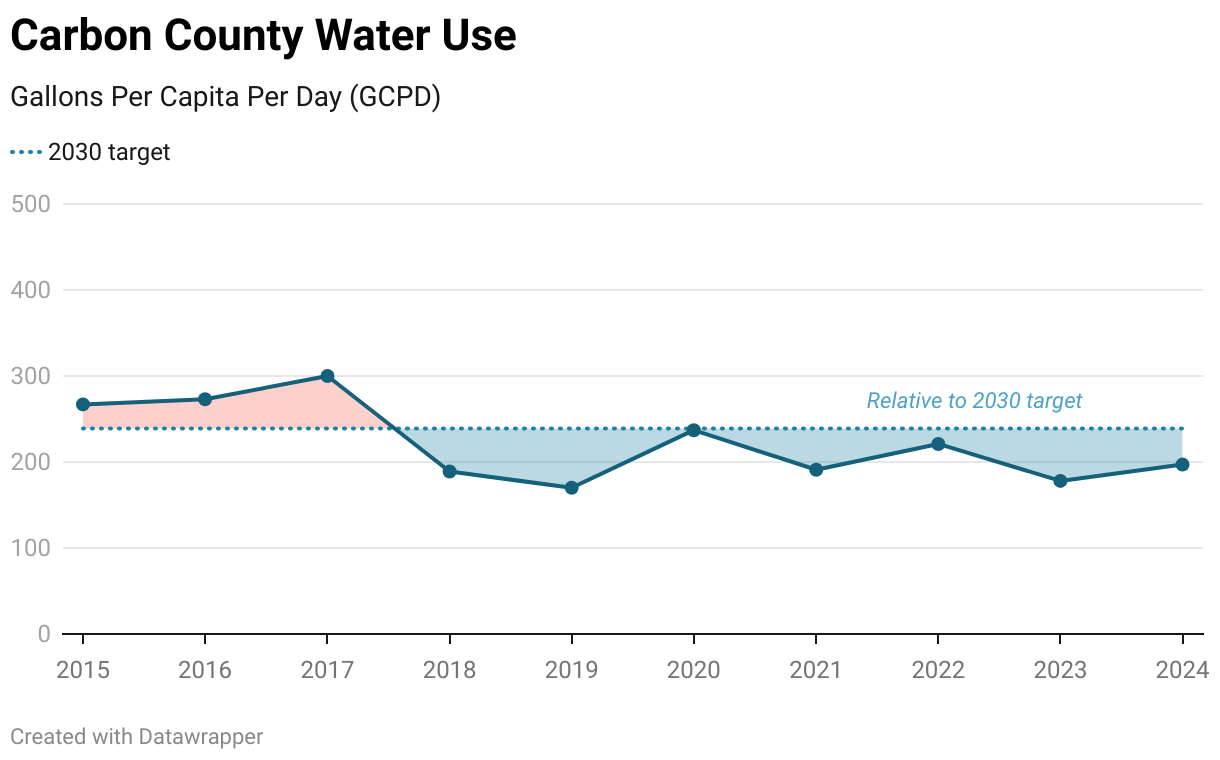
Take Carbon County and its goal is to use an average of 239 gallons per person per day by 2030. That would be an 11% decrease from the 267 gallons it used in 2015, the state’s baseline year for the reduction targets.
In 2024, the county used 197 gallons per person per day, the fifth lowest rate in the state. That’s even less per capita than urban Salt Lake and Utah counties. So, they beat their goal last year.
Uintah met its goal in 2023, years ahead of the deadline.
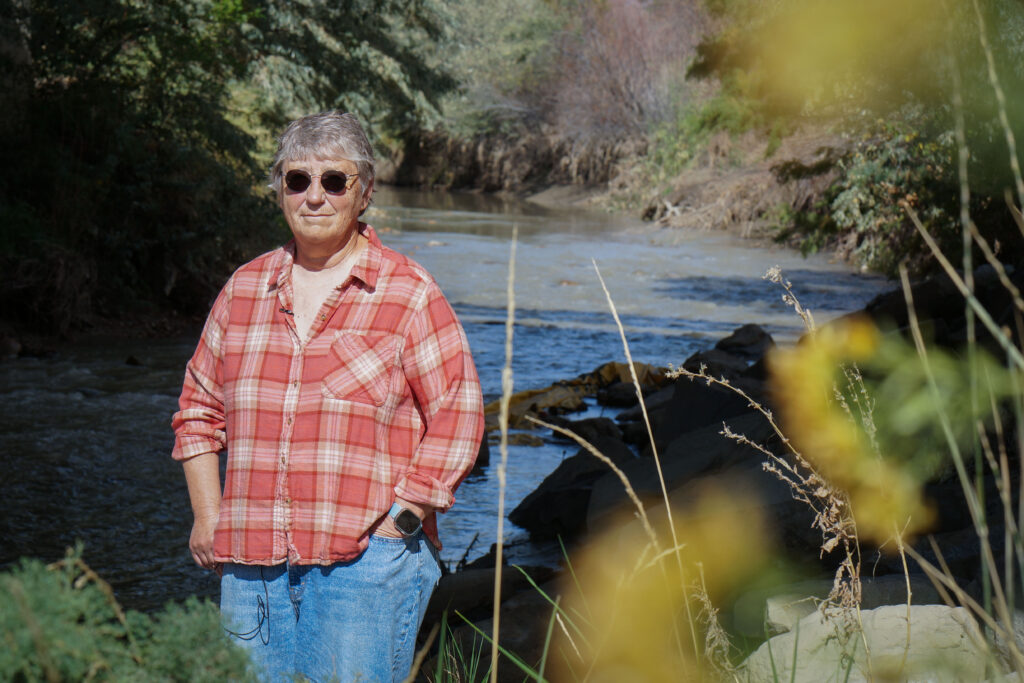
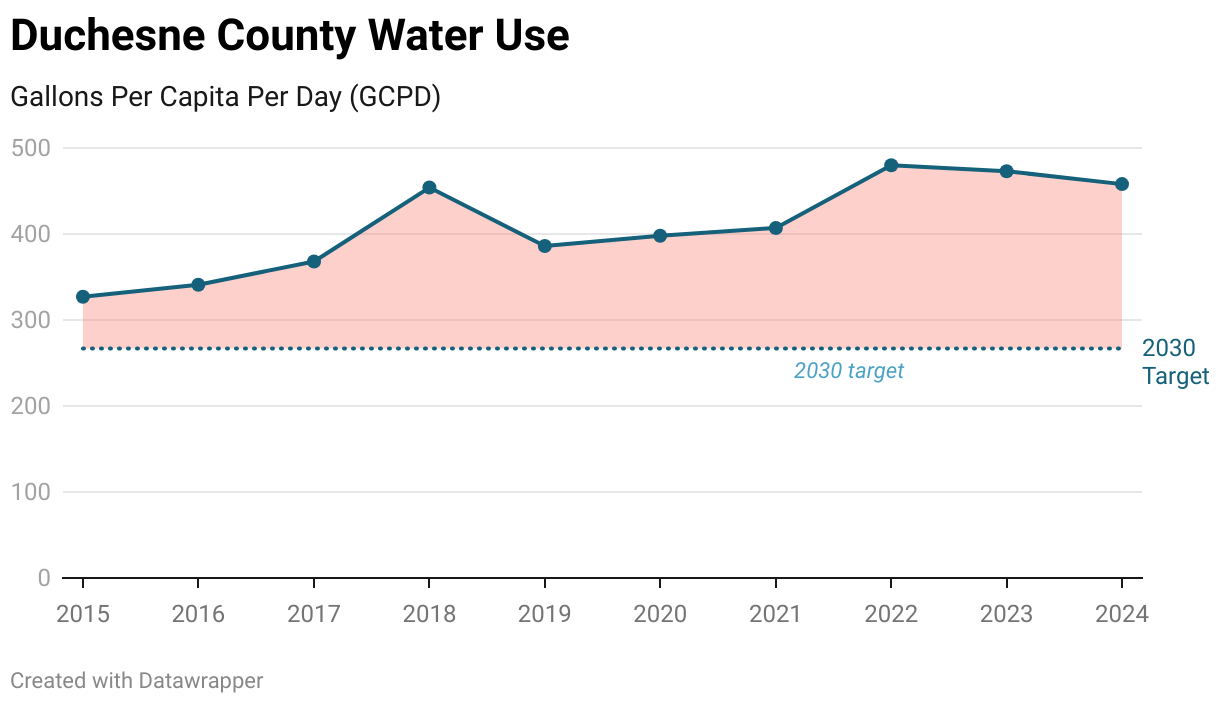
It’s a different story for Duchesne and Wayne. Both are using more water than they did a decade ago.
Talking about saving water matters
Seemingly similar counties — like, say, Duchesne and Uintah or Salt Lake and Weber — have seen very different outcomes. The reasons behind such disparities range from money to lot sizes to local economies.
It also comes down to the priorities of local leaders and how they talk about saving water. Ultimately, that trickles down to influence people’s behavior.
“People need to be convinced there’s a need and a purpose for undertaking water conservation activities,” said Joanna Endter-Wada, a Utah State University water policy and sociology of conservation researcher.
It can take time — years — for the message to sink in and shift a community’s culture. So, how long and how vigorously a county has emphasized conservation can make a difference.
Wayne County uses more water per person than any other part of Utah, in excess of 900 gallons per capita per day.
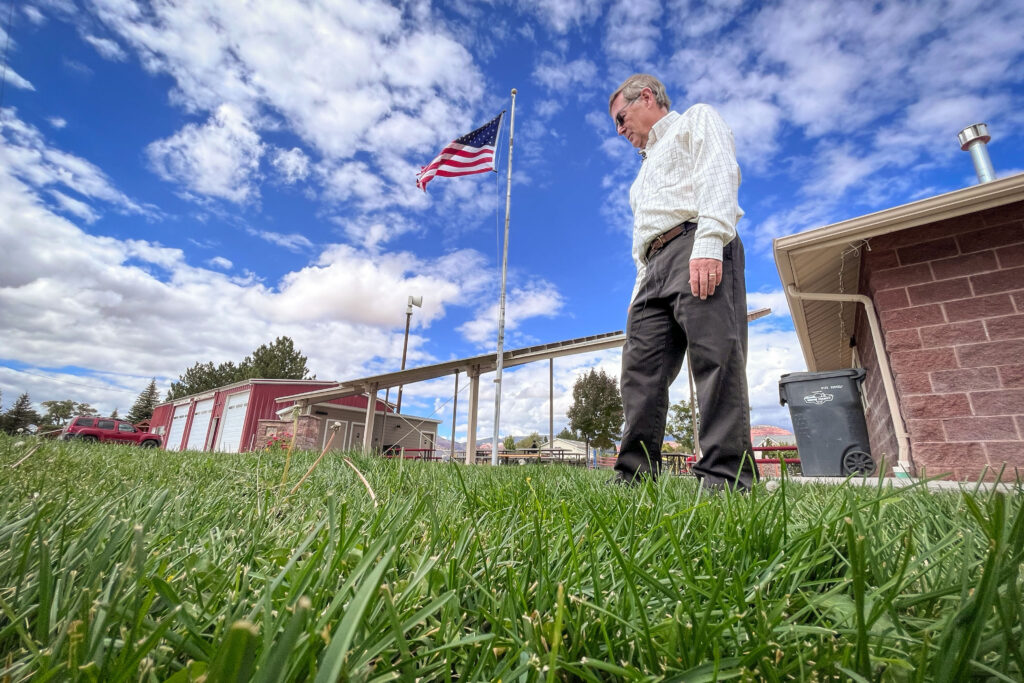
That doesn’t surprise Mickey Wright, a retired software engineer who’s the mayor of Torrey. It’s a town of 332 people near Capitol Reef National Park.
“I think our focus hasn’t been enough on water,” Wright said. To him, the biggest barrier to conservation is shifting from an individualistic to collective mindset.
“We don’t think of ourselves as being that significant, that my little bit doesn’t have that much effect.”
Mayor Mickey Wright walks across a patch of grass near Torrey’s city office, Sept. 29, 2025. The town plans to replace the grass with desert landscaping next year to start setting a better example with water conservation. (David Condos)
Wright grew up in rural southern Colorado and remembers a life of water rationing. When he first came to Utah to meet his wife’s family, he was struck by all the green lawns.
Now, he wants Torrey to start setting a better example.
Outside the old fire station repurposed as the city office, Wright walked across a patch of grass whose days are numbered. By next spring, he said it’ll become a high desert garden with native grasses and flowers. The idea is to inspire residents and businesses to do something similar.
Wright remains hopeful Wayne County can turn things around and hit its goal in the next five years, but he acknowledges change can be difficult. When he pitched a grass removal rebate program earlier in his term, he had a hard time getting support.
But the alternative to conservation is expensive. Torrey will need more water as it grows, the mayor said, which would require pipeline projects to bring it in that could easily top $5 million.
“The less water we use, the less millions we’ve got to go find,” Wright said. “That’s the argument I’ve got to make.”
People are trying to start a similar conversation to the north of Wayne in Duchesne County. It uses the sixth most water per capita in Utah and would need to cut back by more than 40% to reach its 2030 goal.
They’re part of the Central Utah Water Conservancy District, which stretches from Orem to the Colorado border. That’s a lot of ground to cover, so Savannah Peterson, one of the district’s water conservation programs coordinators, knows she needs to speak everyone’s language.
“Using words like ‘xeriscaping’ or ‘waterwise’ in more urban areas is a really popular thing. But in our rural areas, we talk about ‘drought resiliency,’” Peterson said. “We’re trying to meet people where they are in terms of their understanding of the water situation.”
Savannah Peterson of the Central Utah Water Conservancy District checks on flowers growing in a waterwise garden outside the district’s office in Duchesne, Oct. 3, 2025. (David Condos)
The district already offers rebates to help Duchesne residents replace leaky toilets, upgrade sprinkler controls or remove thirsty lawns. But folks often think of those programs as a city thing, and they may not even realize it’s available to them.
“Water districts have sometimes been seen as the bad guy,” she said. “But we want to make sure that people know we’re a resource.”
Over the past decade, his team has worked to dispel common myths, like the thought that conserving locally means sending more water downstream to California. The reality, he said, is that saving water stores it in Uintah’s reservoirs.
As drought set in this spring, his district raised its rates and told customers why.
“People don’t like being told what to do, and so my message to that is: We don’t tell them what to do. We explain the situation and let them pick,” Goodrich said.
That meant choosing between paying a higher bill or trying to cut back, he said, “but if they don’t understand the underlying reason for it, they’re not going to do it.”
Uintah’s local efforts appear to be paying off. It hit the state’s 2030 goal in 2023 with 209 gallons per capita per day, before slipping back above the target line in 2024.
Between the higher water rates and a new outreach plan of radio ads, text messages and flyers, Goodrich said his district has cut water use by roughly another 20% this year.
It’s great to see how far Uintah has come with conservation, Goodrich said, but it’s no time to rest on their laurels.
“We are doing a pretty good job. We can do better,” he said. “This year was the year that we said we have to do better, because we just don’t have the water.”
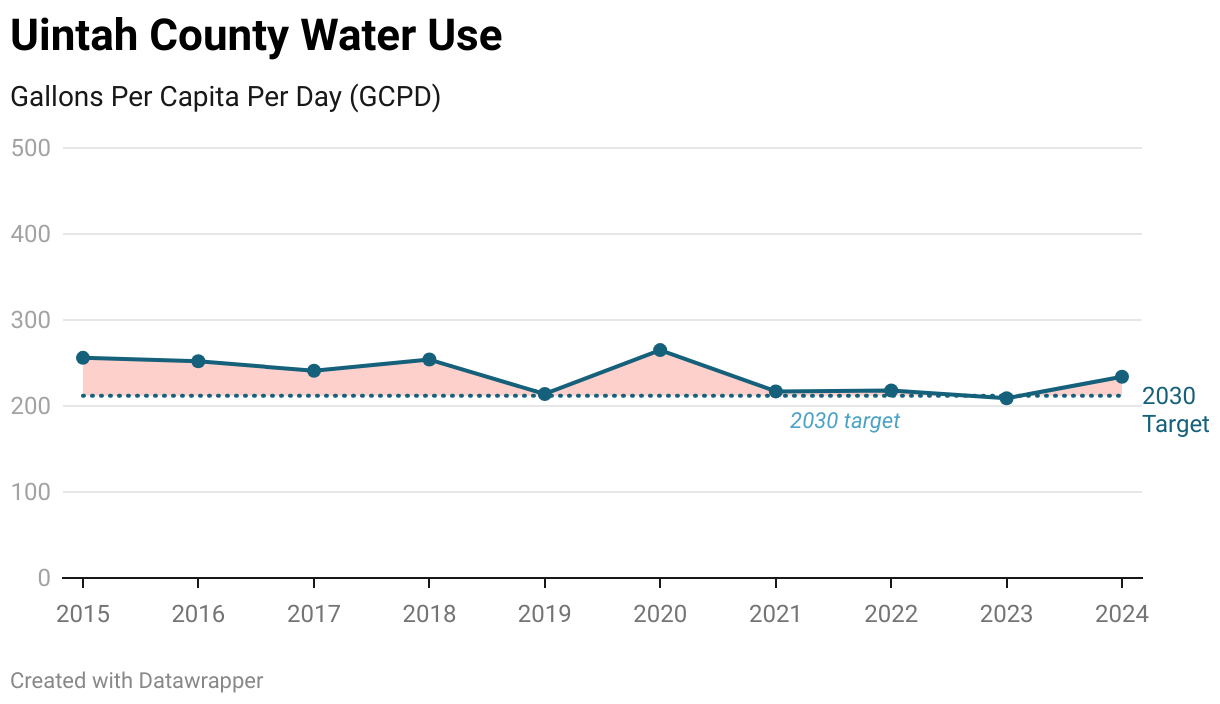
Ryan Goodrich of the Ashley Valley water district stands next to Ashley Creek, Oct. 2, 2025. This tributary of the Green River provides water for communities around Vernal, but it has run low this year because of drought. (David Condos)
The size of a community’s wallet matters, too
Clear, consistent communication isn’t the only thing that can help residents save more water. Small towns may have just one person managing their water system, Endter-Wada said, while bigger cities have a whole staff of water conservation experts.
The more resources a community has, the more likely they’ll be able to implement conservation efforts such as lawn replacement incentives and hiring employees to manage those programs.
“At the end of the day,” Hasenyager, the state water director, said, “conservation costs money.”
There are real barriers in places with fewer people and smaller budgets. That’s the case in Myton, a town of 662 in Duchesne County.
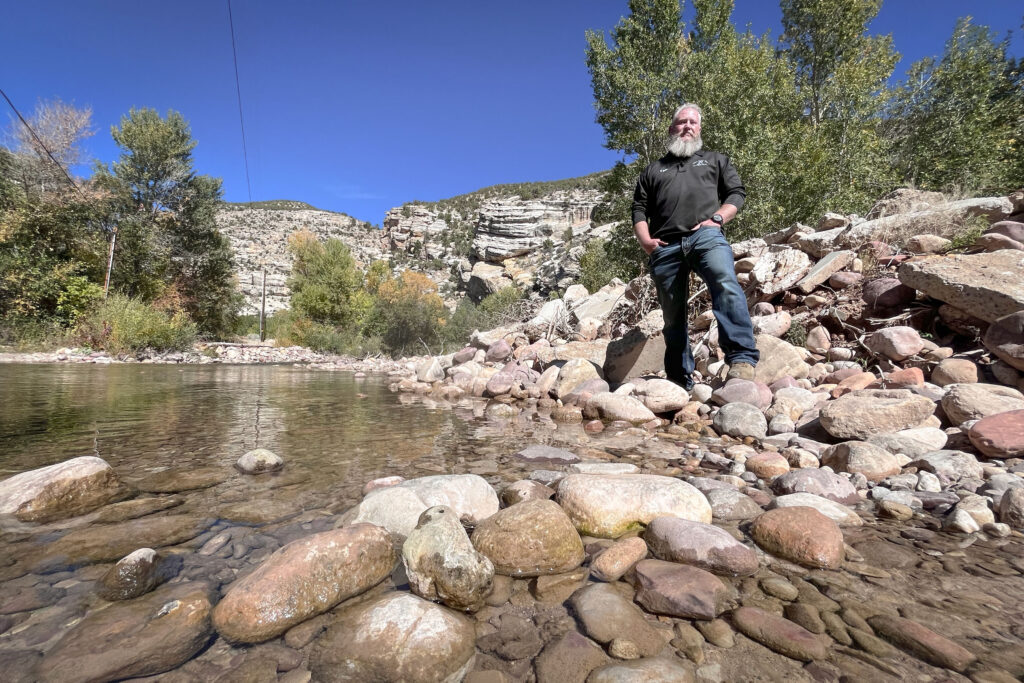
Water is so vital to life in this part of northeast Utah that Myton showcases a ragged wooden pipeline from the early 20th century in its museum. But even the pipes that carry Myton’s water into town today have problems. Many are nearing 50 years old and leak badly, Mayor Kathleen Cooper said. Those pipes routinely lost more than a fifth of the town’s water over the past decade.
But Myton doesn’t have the money to replace them.
“I don’t know who you blame,” Cooper said. “All I know is that I need water pipes, and we only have 600 people.”
Myton Mayor Kathleen Cooper stands next to an old water pipeline in the town’s historical museum, Oct. 1, 2025. She says many of the town’s current pipes leak badly, but Myton doesn’t have the money to replace them. (David Condos)
Around a quarter of the town’s residents live below the poverty line. That’s more than triple the state average. It also overlaps with Ute tribal land and around one-sixth of its residents are Native.
“We don’t have a bunch of oil barons living in Myton that could raise our property rates so that we would get more money,” Cooper said. “So, we have to rely heavily on grants.”
And those federal funds dwindle by the second, she said.
On top of that, small towns face a competitive disadvantage. If they apply for grants, Endter-Wada said, they’re often up against urban and suburban communities that hire outside consultants to juice up their proposals.
When rural areas do get their hands on the money, it’s easy to see the impact. Look at the town of Helper, in Carbon County, just south of Duchesne.
Along a highway in Price Canyon, Mayor Lenise Peterman rested her hand on a rusted pile of scrap from a pipeline that brought water to town for 70 years. Before they replaced it, the town of 2,680 people lost about half its water before it ever made it to someone’s kitchen sink.
Helper made it happen thanks to $3.4 million in federal post-pandemic funds. That’s nearly double the town’s entire annual budget, Peterman said.
“We were fortunate to get that funding and to make it happen,” she said.
“We knew we weren’t doing that well,” the mayor added. “It wasn’t that we weren’t trying, it was that the infrastructure was failing us.”
With the new pipe installed, Helper can focus on next steps for saving more water. For example, the mayor wants to start a program in the local schools to teach kids about conservation.
The project to replace Helper’s leaky water pipeline cost more than twice the town’s annual budget, said Mayor Lenise Peterman, seen here at the project site Oct. 1, 2025. The water-saving project might not have happened without millions in federal funds. (David Condos)
The nearby town of Price also has a leaky pipeline that’s nearly a century old. City council member Terry Willis said they recently snagged around $5 million in grants and $10 million in loans to replace it.
“When you have to say millions, it makes your heart beat a little bit and makes your stomach churn a little bit,” Willis said. “But it’s the reality of what it is.”
Price and Helper are both in Carbon County, which has already met its 2030 goal.
Between hotter, drier weather and concerns about the future of the Colorado River, there’s urgency for communities to keep going.
“We watch the climate change, and it has continued to change since I’ve lived here,” Willis said as she stood next to the Price River, which can dry up during drought. So, conservation has to be at “the forefront of everything we do. Because without water, the community will fail.”
Mayor Cooper said Myton has applied for federal and state checks, too. In the past couple of years, the town has gotten outside funds to replace water meters and launch an app for residents to check their water use.
She wants to do more, though. And hasn’t given up yet.
“I’m always hopeful,” Cooper said with a laugh. “You have to be in Myton. That’s all we have left is hope.”
Price city council member Terry Willis stands next to the Price River, Sept. 30, 2025. The river provides water for the city’s supply, but parts of it can dry up during drought years. (David Condos)
When water props up rural economies and larger homes
In 2023, homes were the top water users in Uintah and Carbon counties’ municipal districts. Most commercial, institutional and industrial customers didn’t come close.
Residential was also the leading user in every Wayne County district except one. That was in Torrey, Capitol Reef National Park’s gateway town, where the commercial sector used the most.
That likely points to one influencing factor: tourism. People staying at hotels, resorts and RV parks may use Torrey’s water, but they aren’t counted in its population.
Visitors spent $54.8 million in Wayne County in 2023, according to data from the Kem C. Gardner Policy Institute. That means tourism brought in $21,720 per resident — significantly higher than tourism’s relative impact in Duchesne ($2,581 per resident), Carbon ($4,309) or Uintah ($6,253).
Wayne has a small population, 2,543, and visitors could have an outsized impact on its per capita numbers. Still, a small number of residents hasn’t stopped neighboring Garfield County — home to 5,115 people and Bryce Canyon National Park — from decreasing its water use since 2015, while Wayne’s has gone up.
Duchesne may not have as much tourism, but it ranks high for fossil fuel extraction. In a 2021 letter to President Joe Biden, local leaders described the county as Utah’s top crude oil producer and No. 3 for natural gas.
In Duchesne’s Johnson Water Improvement District, industrial customers used 689,441,942 gallons 2023. That’s more than five times what the district’s residents used that year and nearly twice as much as all the homes in Roosevelt, the county’s largest city. On its website, the district says it provides a “substantial amount of water” to the oil and gas industry.
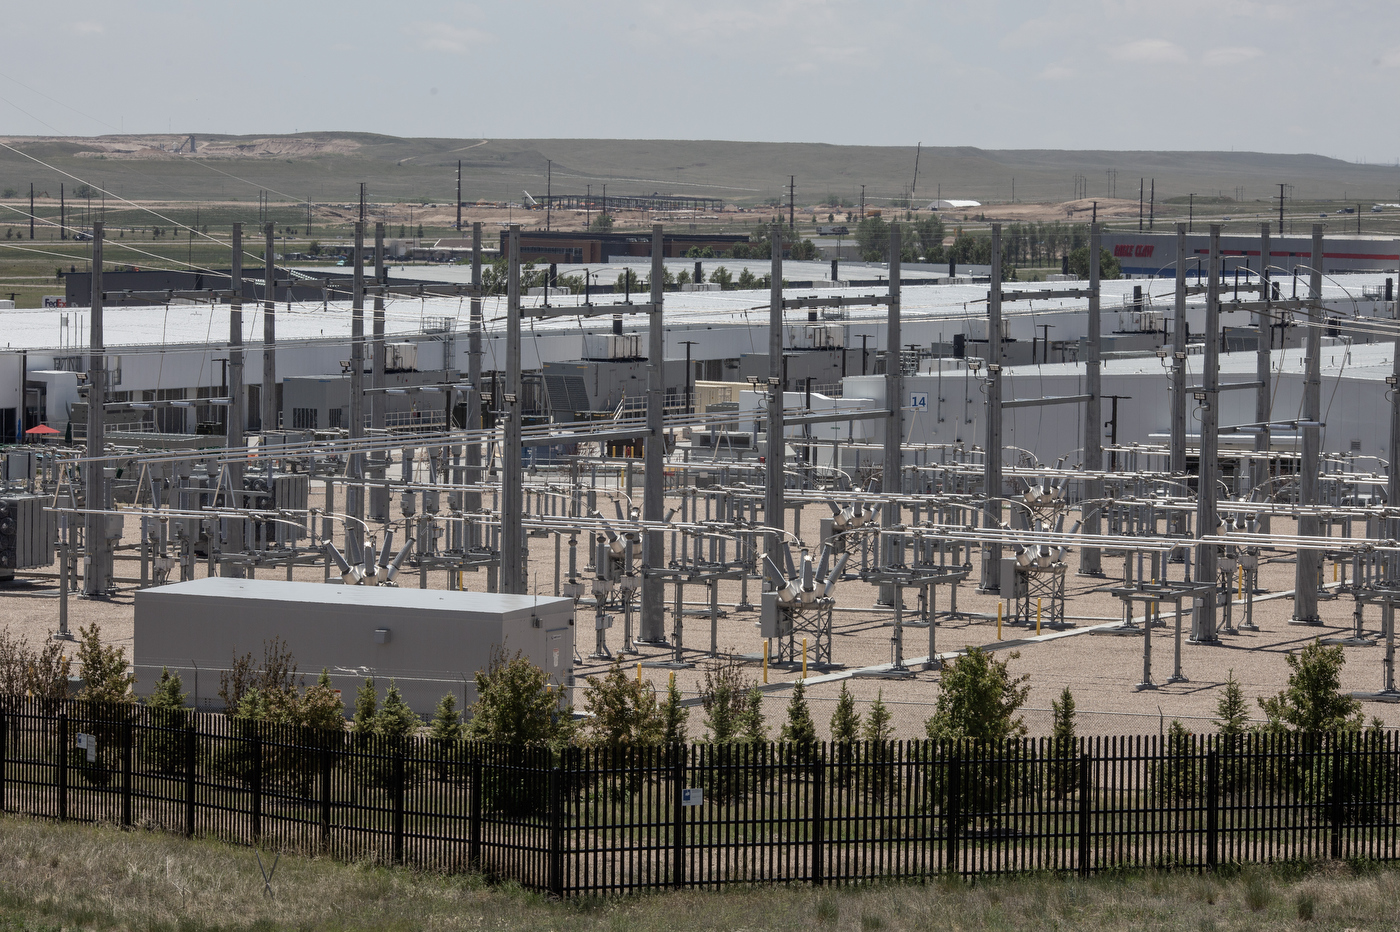
Other industrial uses, such as data centers and processing plants, can have similar impacts on water in rural areas, Endter-Wada said.
“So, it’s really not just a reflection on the individual behaviors of the residents in the area, but it reflects the economy as a whole,” she said.
When water props up the local economy, it is hard to cut back. That illustrates why it’s important to be cautious about the types of new industries Utah leaders welcome, Hasenyager said.
Large rural lot sizes also skew the data, Endter-Wada said, because more than half of Utah’s residential water gets sprayed onto lawns and gardens. If you have a family of five living on a small tract in the city, they’re likely to use less water than a family of five on a sprawling property in the country.
“Distribute that water use over a smaller population,” Endter-Wada said and “you’ll see greater gallons per capita per day numbers.”
Wayne has the largest average lot size in Utah, more than triple Salt Lake County’s, according to state data. Duchesne’s lot sizes are in the middle of the pack — similar to the average in Utah County and smaller than Uintah’s.
Another factor is that the state has to estimate much of Wayne’s water use, Hasenyager said, because there aren’t enough meters tracking the actual gallons. Installing measuring devices for all of Utah’s secondary water systems, which generally go to landscaping, is another state goal for 2030.
Until then, there may be some farm irrigation inadvertently counted with the county’s city water.
“I’m pretty convinced that [Wayne’s data] has agricultural water in it, and we need to try to dig into that,” Hasenyager said
The state is also digging into potential changes to the 2030 goals.
Right now, the target reductions are based on each county’s average water use from 2015. The state may soon use the average from 2015 to 2019 as the baseline instead. That change would bring Wayne and Duchesne closer to hitting the mark, but their 2024 water use would still be significantly higher than those updated goals.
Utah may also start using a percentage to reflect how close each county is to its goal, Hasenyager said, rather than the specific amount of water it uses.
Other changes have already happened. In 2025, the Legislature directed Utah’s five most populous counties to report their consumptive water use, rather than total water use. That allows a county to subtract return flows — the gallons that go back into the water system — from its sum and results in a lower per capita figure. This story relies on the total water use for those five counties rather than consumptive use to maintain a direct comparison with the counties’ data from 2015-2019 and with the data from the other 24 counties.
Despite around half the state’s counties falling short of their 2030 goals so far, Hasenyager said Utah is in a much better place than it was five years ago.
“There are more programs now than ever before that are encouraging water conservation from all different levels — from the state, from the districts, from the local water suppliers,” she said. “So, I’m really hopeful and confident that more of our counties will meet those 2030 goals.”
There’s no penalty for those who don’t meet their goals by the end of the decade. But communities who aren’t careful with their water, Hasenyager said, could face natural consequences in such a dry state.
Listen to this series by David Condos
Part 1
Utah has county-by-county water goals. Is your county hitting them?
Part 2
How we talk about conservation in Utah
Part 3
“At the end of the day, conservation costs money.”
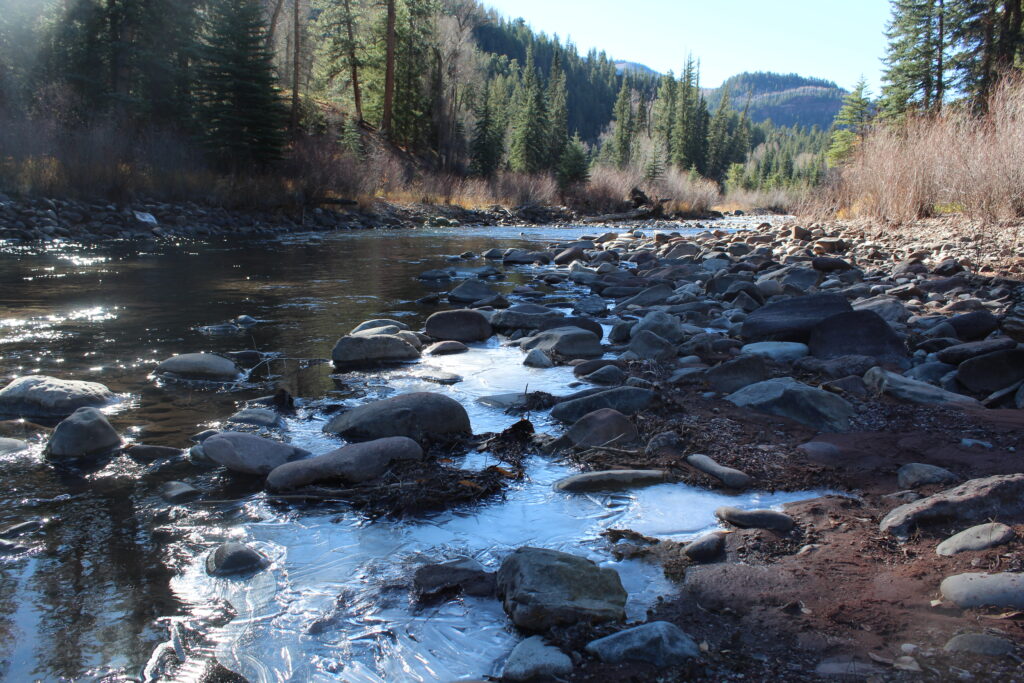
Ice forms on the banks of the Crystal River a few miles south of Redstone, Colorado on October 29, 2025. (Caroline Llanes/Rocky Mountain Community Radio)Rocky Mountain Community Radio’s Caroline Llanes reports from western Colorado
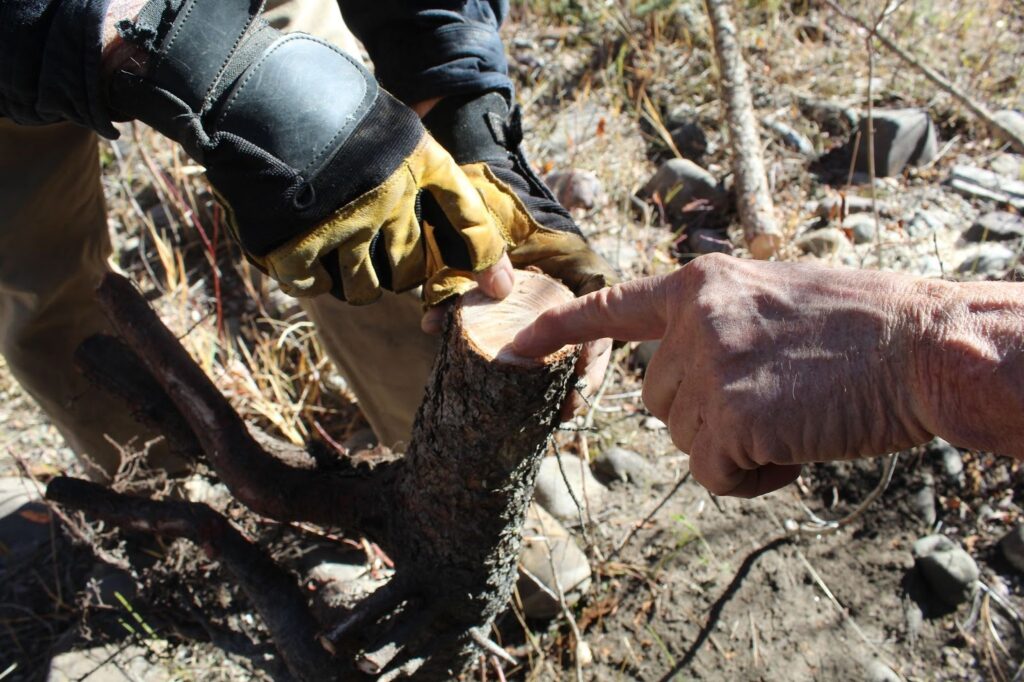
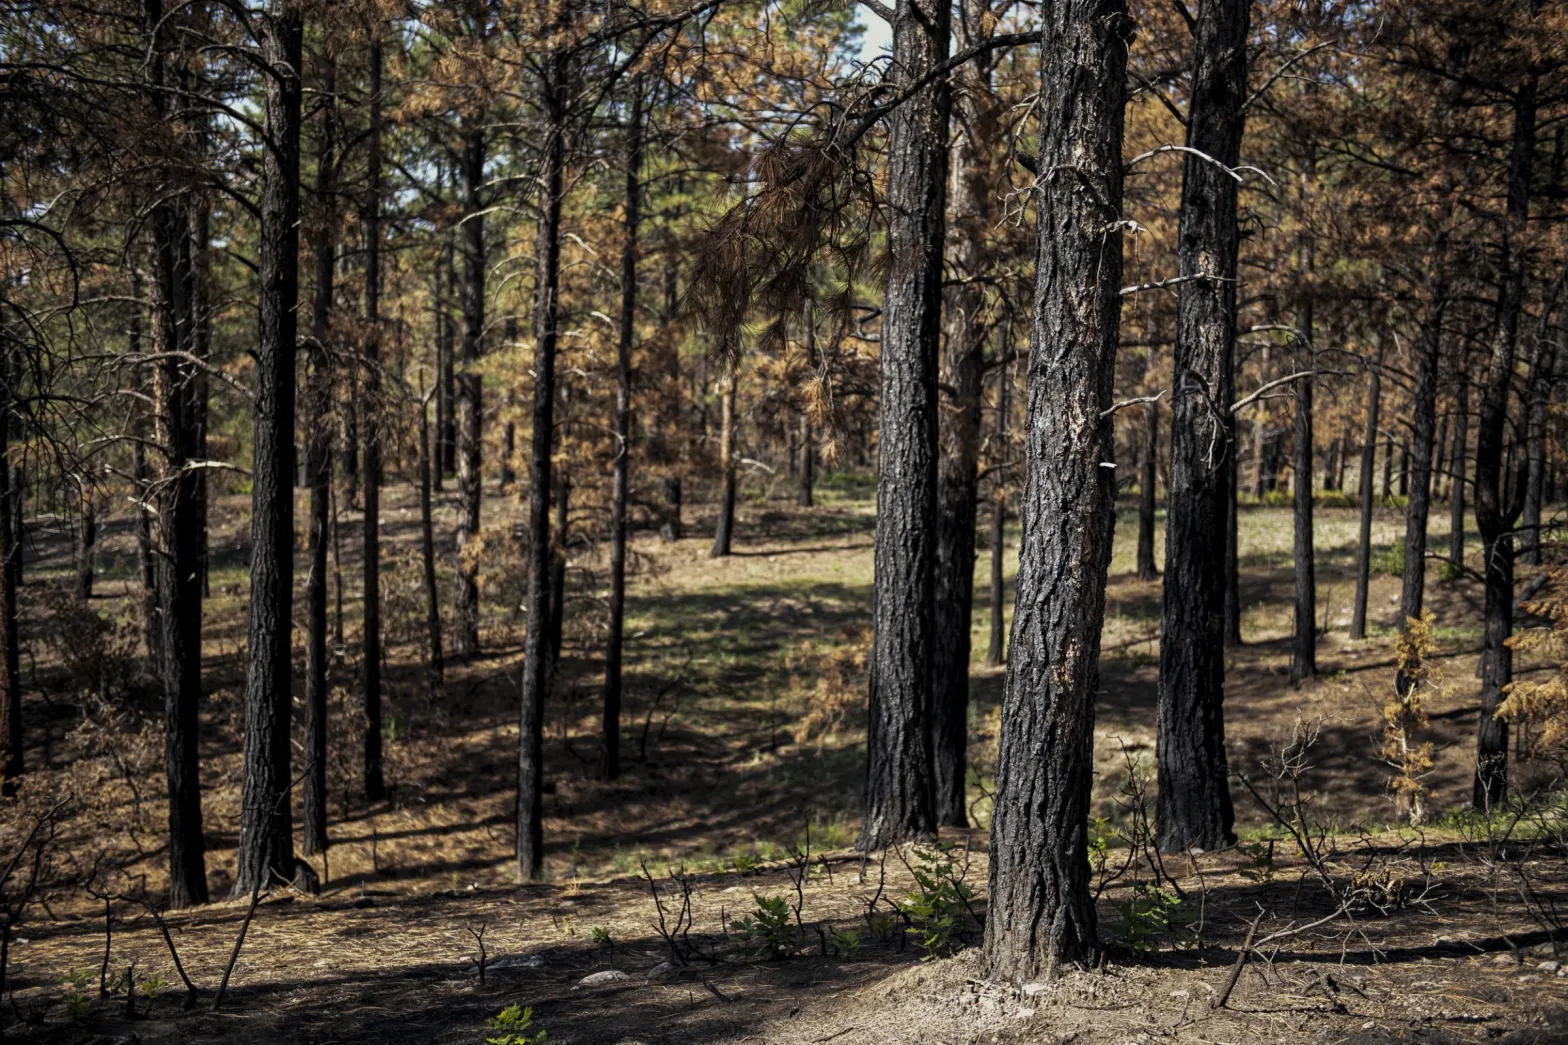
Tree rings can tell a story. Wide bands signal a wet period, while narrow ones show a drought. Whole ecosystems can be encoded in trees. In Western Colorado, scientists are examining trees to find out more about the environment’s story in an effort to protect the river they stand along.
On the banks of the Crystal River, a few miles south of the small town of Redstone, David Cooper surveyed a spruce tree with its roots exposed.
“OK, our first victim,” Cooper said as he examined the roots and directed volunteers where to start digging.
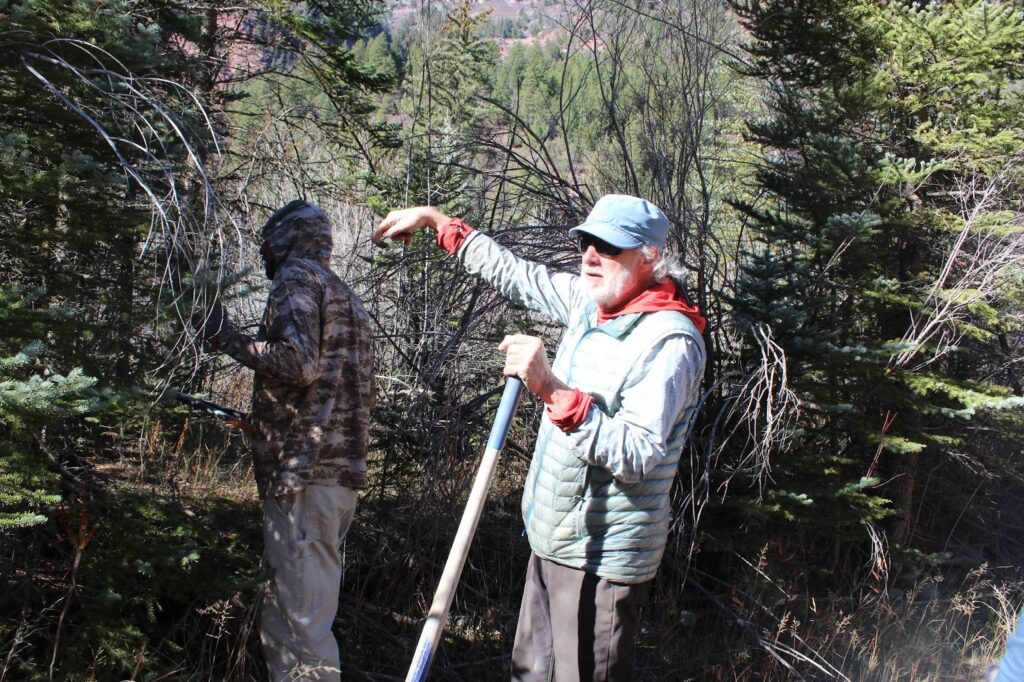
Sheehan Meagher (left) and David Cooper (right) figure out the best place to start digging to uproot a large spruce tree. (Caroline Llanes/Rocky Mountain Community Radio)
Cooper has been a professor at Colorado State University for over thirty years, focusing on wetland and riparian ecology. For this study, he’s been working with Dave Merritt of Functional River Ecology and Peter Brown of Rocky Mountain Tree Ring Research. The group is trying to get to the root of how this tree and the river are connected.
Using clippers, shovels and metal poles, volunteers like Sheehan Meagher helped unearth the tree completely.
“For me, it was kind of hard the first day because I was like, ‘Oh, we’re digging up these trees,’” Meagher said. “And I was like, ‘I don’t know how I feel about it. I’m a tree hugger.’”
Despite Meagher’s initial hesitation, he’s enjoyed getting to see science in action. And, he says it’s for a good cause.
“I was like, ‘Alright, where’s the spruce that wants to give its life for science so that we can study this river and hopefully prevent this river from ever being dammed,’” he said.
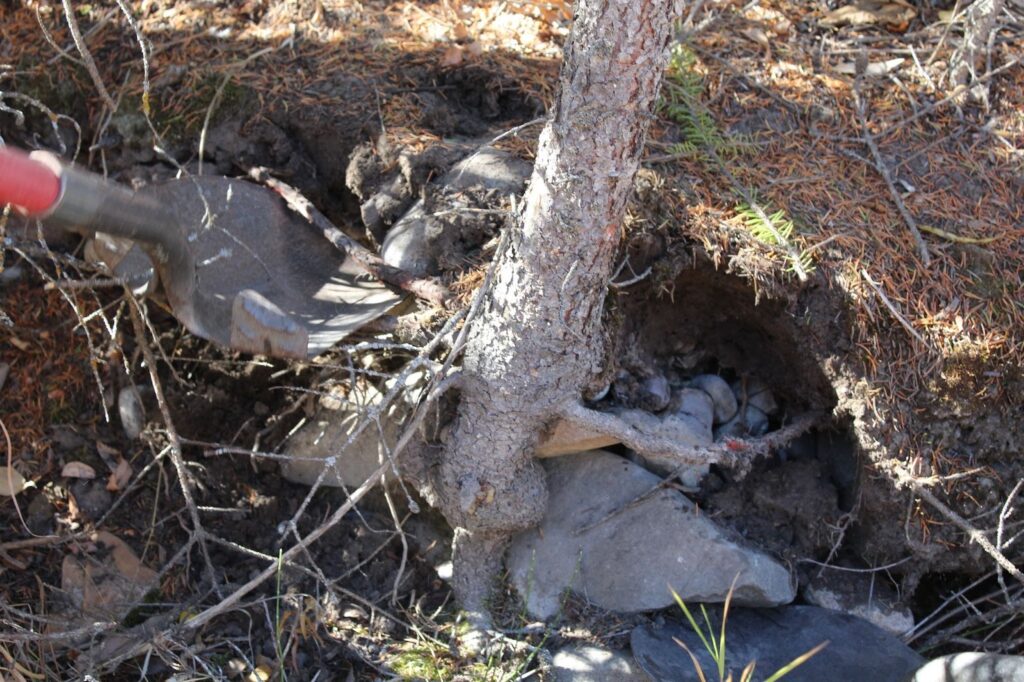
This spruce tree on the banks of the Crystal River already has its roots exposed, giving volunteers a head start in digging it up. (Caroline Llanes/Rocky Mountain Community Radio)
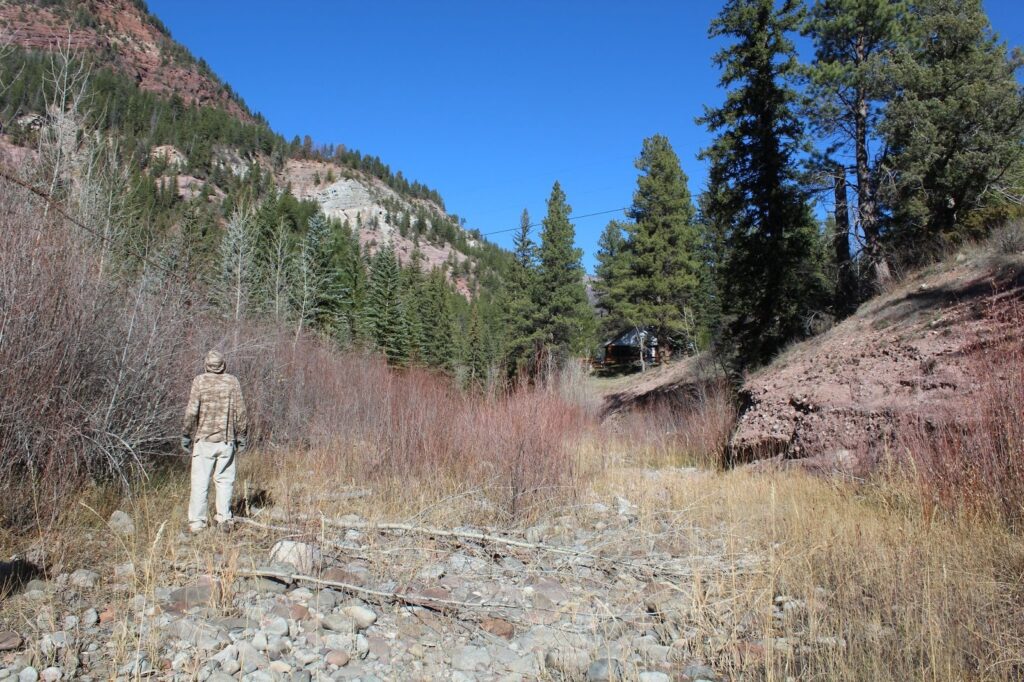
The Crystal River is one of the few rivers in Colorado that doesn’t have any major dams; large stretches of it are still pristine. As demand for water increases amidst a warming climate, policy makers often scan the landscape looking for new supplies. A free-flowing river like the Crystal can be an attractive option to supplement fast-growing communities.
Proposals to dam the Crystal and create a reservoir have cropped up over the years, most recently in the early 2010s. Those have been shelved due to cost concerns and local opposition, but locals say it’s only a matter of time before someone else tries. They want to secure federal protections from Congress to protect the Crystal in perpetuity in the form of a “Wild and Scenic” designation.
Peter Brown and David Cooper examine the cross-section of a spruce tree, and estimate its ring count. (Caroline Llanes/Rocky Mountain Community Radio)
At the heart of what Cooper, Brown and Merritt are trying to do with this study is establish the relationship between the trees and the Crystal’s natural hydrologic rhythm, which wouldn’t exist if it were dammed or diverted.
“For most of the work we’ve done over the last 30 or 40 years, we’ve shown that it’s mostly big floods that disturb the ground and create habitat for establishment and allow these trees to get established,” Cooper said.
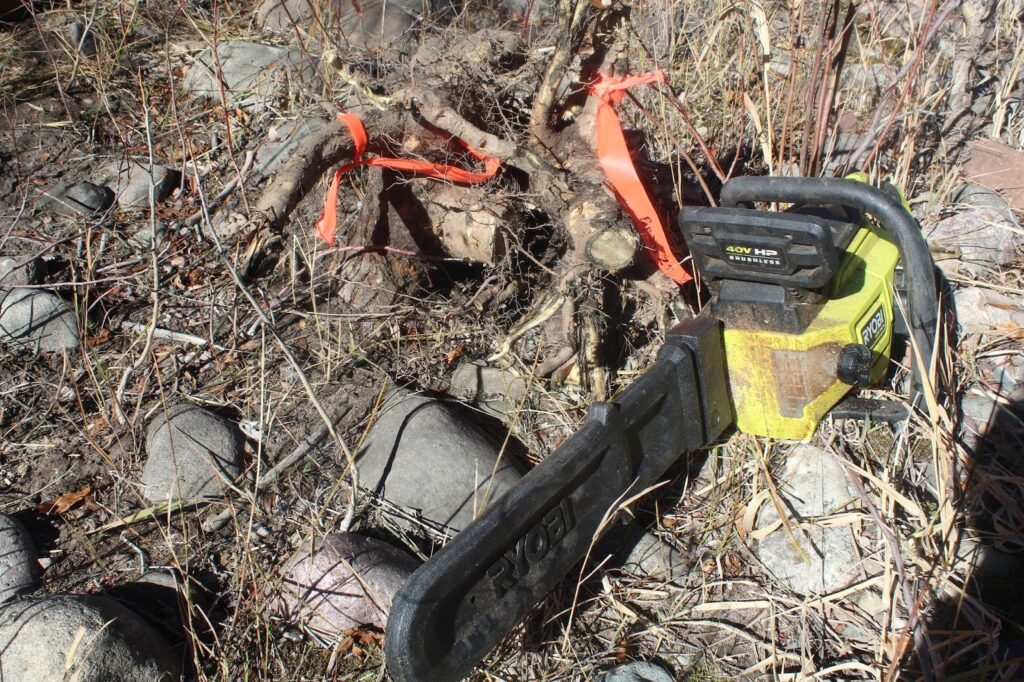
Once the group got the tree out of the ground, they used a chainsaw to cut near the roots to get a cross-section. Brown and Cooper examined the cross-section.
“You can see the rings real well here,” Cooper said, pointing with his finger. “Look how small they are. So that tree might be 25 or 30 years old.”
The trees that Cooper, Brown, and Merritt uproot are cut into smaller pieces and labelled, before being transported to a lab for further analysis. (Caroline Llanes/Rocky Mountain Community Radio)
But according to Cooper, these rings don’t tell the full story. These trees have been cut by beavers. They’ve been knocked over and buried by rockslides in this narrow valley. The stem itself doesn’t reflect the tree’s true age. Cooper is looking for the very oldest part of the tree, called the pith. Once that is exposed, researchers can compare the cross section to the Crystal’s water record. Cooper says they’ll go year by year, and see whether each ring correlates with a wet or dry year.
“There’s big floods and dry years and so if you’re just within one or two years, you have really no idea what kind of flow regime was required to establish the plant,” he explained. “So that’s why we need to know the year. Not, not plus or minus one, the year. There’s really no room for error.”
In the same way that the river shaped the trees by spurring or constraining their growth, Cooper says these trees in turn shape the river, and make it what it is.
“You see that the trees grow around the rocks and then sediment accumulates above them,” he said. “The roots of these plants hold this bar together. Without tree roots, this whole thing would be mobile. So the roots are building the floodplain and creating all of this habitat.”
Volunteer Sheehan Meagher looks around the banks of the Crystal River for a good tree to dig up on October 29, 2025. (Caroline Llanes/Rocky Mountain Community Radio)
It could be awhile before a proposal to secure protections for the Crystal goes before any federal agency. But for locals like Sheehan Meagher, the time spent on this research is well worth it.
“Hopefully the research shows that these mass flooding events are critical to establishing this type of habitat,” he said.
Any future dam would disrupt that, he said. Getting the science to back up that claim is worth taking a tree or two, he said.
“Please give your life to science, cottonwood,” he said, laughing.
If there’s the will and the funding, Cooper and his team will be back next year, documenting the story of the river and its trees, and building the case for its preservation.
This story was produced in partnership with The Water Desk at the University of Colorado Boulder Center for Environmental Journalism.
Copyright 2025 Rocky Mountain Community Radio. This story was shared via Rocky Mountain Community Radio, a network of public media stations in Colorado, Wyoming, Utah, and New Mexico, including Aspen Public Radio.
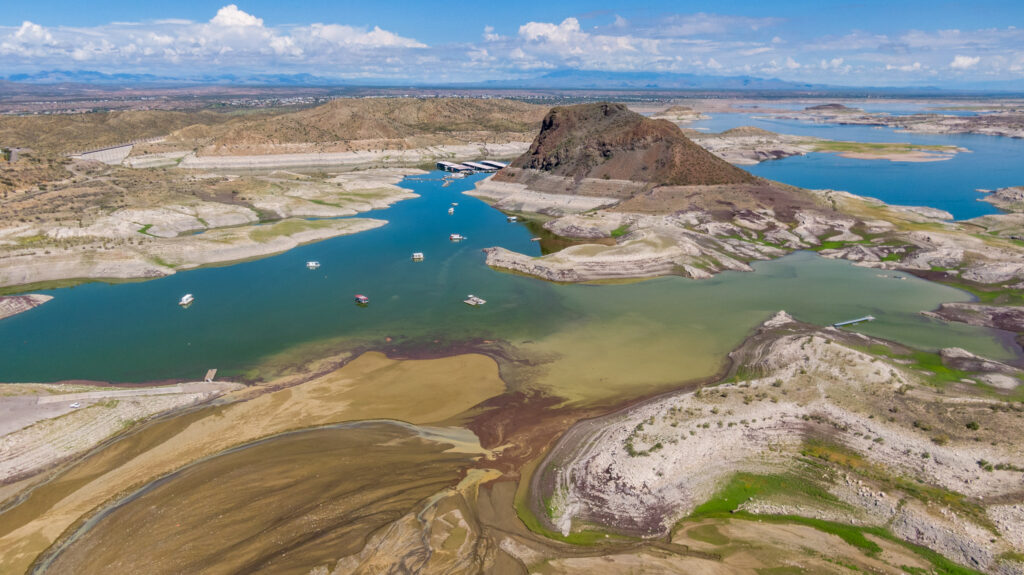
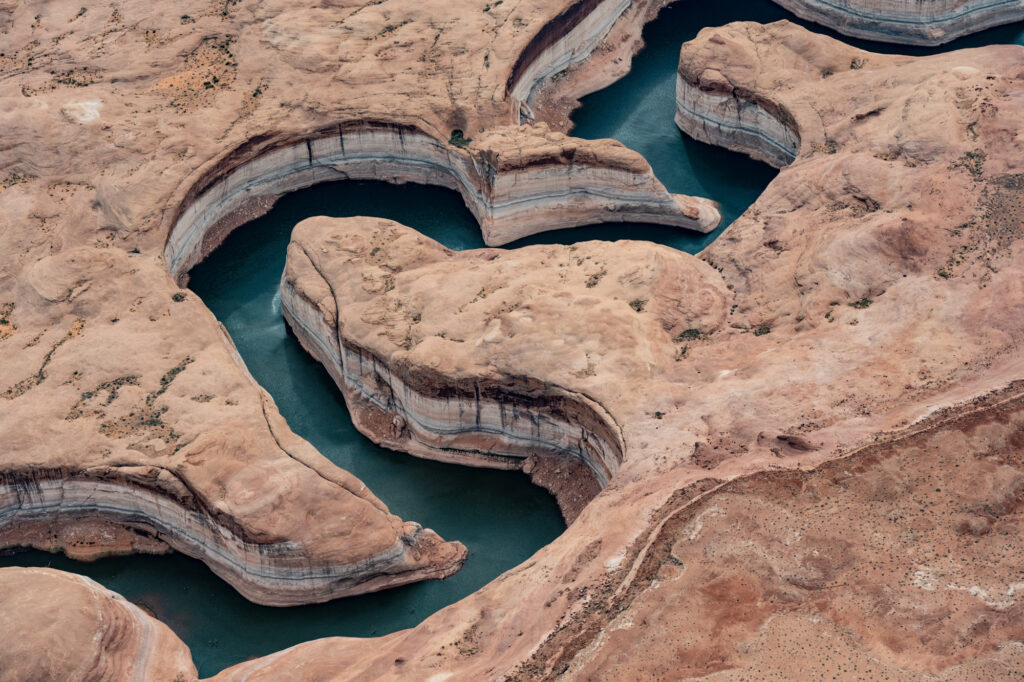
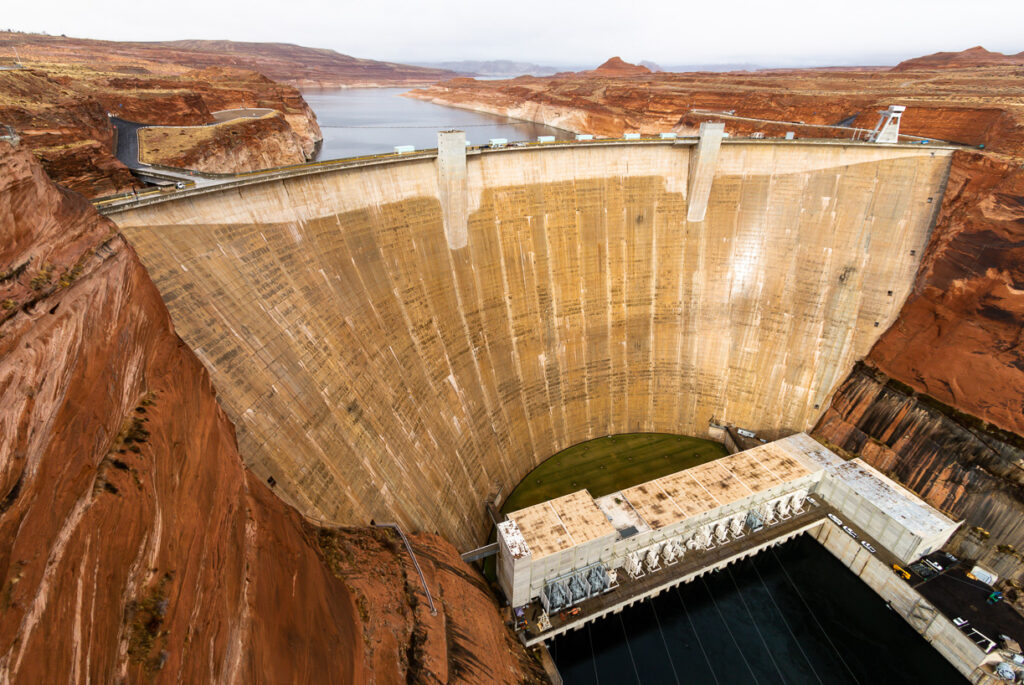
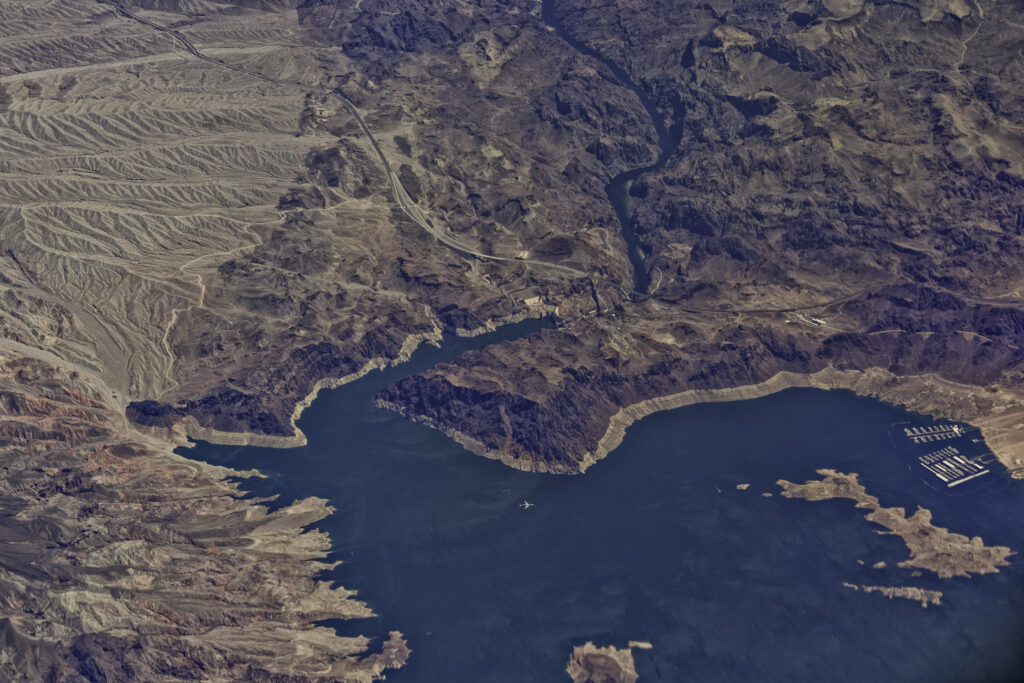
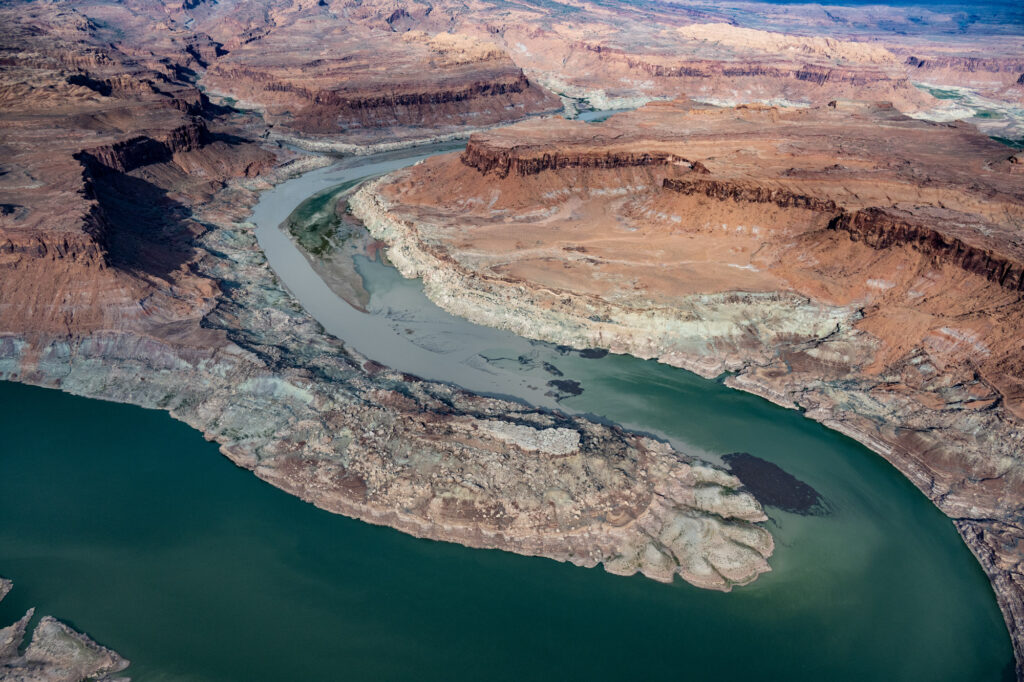
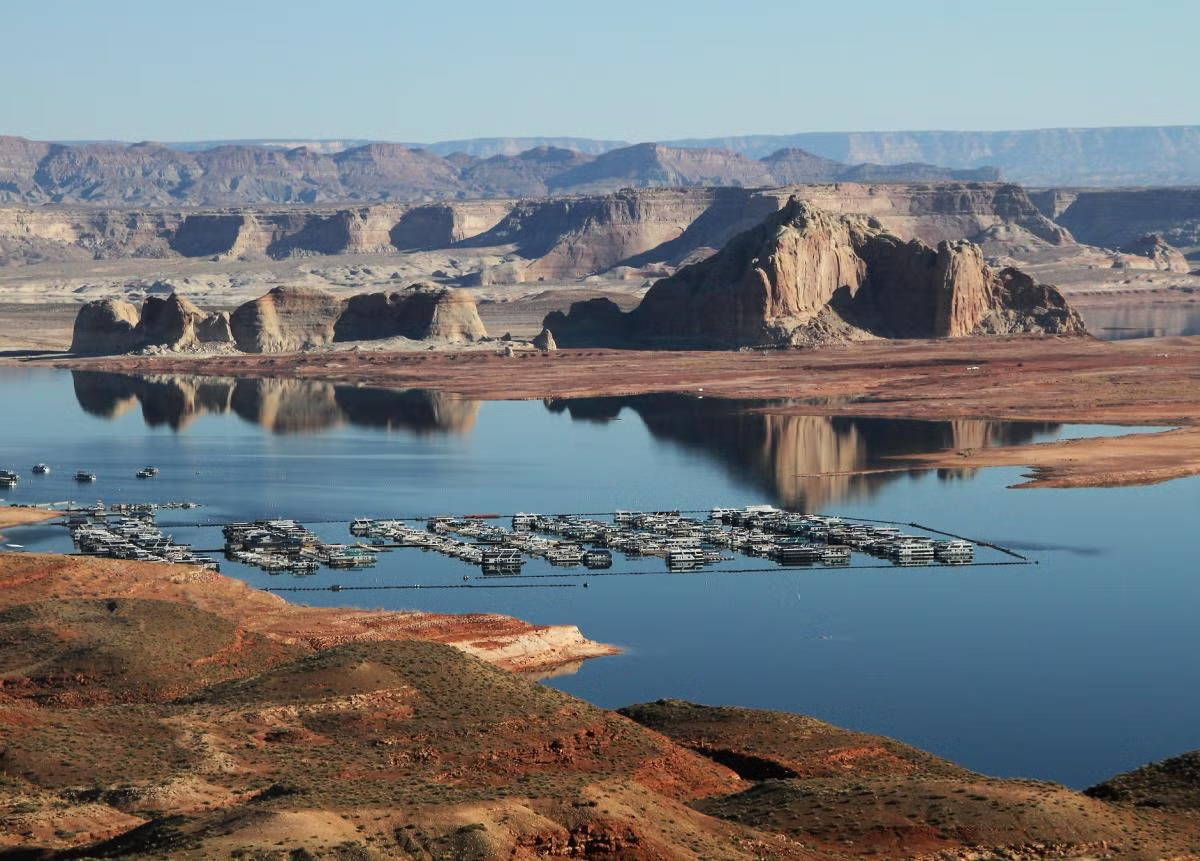
The Colorado River fills Glen Canyon, forming Lake Powell, the nation’s second-largest reservoir. The reservoir could drop to a new record low in 2026 if conditions remain dry in the Southwestern watershed. (Alexander Heilner/The Water Desk with aerial support from LightHawk)
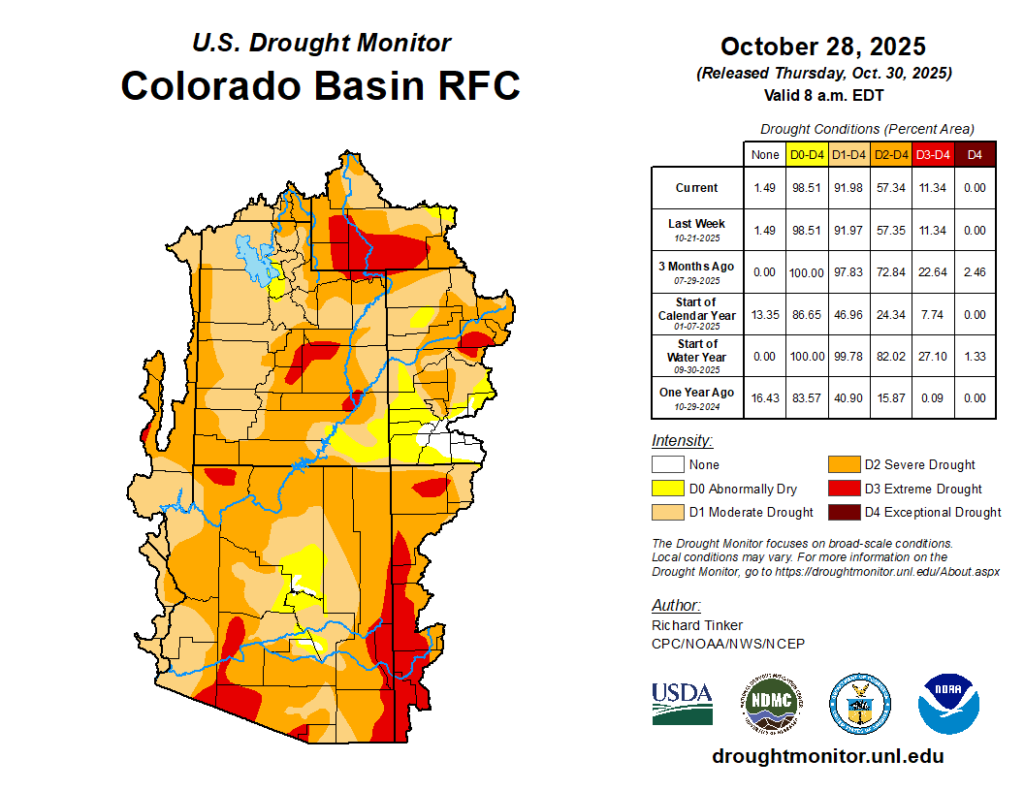
Heavy autumn rains brought relief to drought-plagued portions of the Southwest, but across the Colorado River basin ongoing water supply concerns still linger amid tense policy negotiations and near record-low reservoir storage.
Even after accounting for the heavy rain, 57% of the Colorado River watershed remains in severe drought, according to the U.S. Drought Monitor. More than 11% of the basin is in extreme drought.
A less than average upcoming snow season combined with a dry spring or early summer in 2026 could create conditions for another low runoff year. The Colorado River’s headwaters saw a weak snowpack last winter, which contributed to one of the worst spring runoff seasons on record in 2025. Drought conditions spread and worsened into summer throughout the southern Rocky Mountains.
Peter Goble, Colorado’s assistant state climatologist, explained that the recent rainfall “certainly recharged soils,” in some watersheds.
Streamflow in the Animas River and Rio Grande increased significantly following the October rains and flooding. Rain in southwest Colorado, particularly around Pagosa Springs, brought flooding that damaged homes and downtown businesses. Rain gauges near the San Juan Mountains recorded 7 to 10 inches of precipitation from October 9-15.
“We would love to see this rain come over a more steady incremental period,” Goble said. “But oftentimes it is these flooding events that kind of put the kibosh on a drought more locally.”
The flooding erased drought designations on the Drought Monitor map in those localized areas, but basinwide drought conditions tell a different story. Dry soils, depleted reservoirs and winter weather forecasts continue to cause water managers to worry.
Even with the recent rain, soils in many parts of the Colorado River basin remain dry. Soil absorbs moisture almost like a sponge. When the soil moisture is low, spring runoff soaks into the soil, saturating the ground first. Soils that are more saturated lead to more water filtering into streams and reservoirs when runoff occurs, making the process more efficient.
“We’re still going to need a good snowpack in order to be set up nicely, but this (rain) improves our outlook for the efficiency of that snowpack,” Goble said.
Federal forecasts show the possibility of a mild La Niña through February. The climate pattern occurs when Pacific Ocean waters cool down and alter global weather conditions. La Niña patterns often impact the amount of snowpack accumulation in the coming year. The southern part of Colorado is often drier in a La Niña year while northern areas, around Steamboat Springs, typically see snowier conditions.
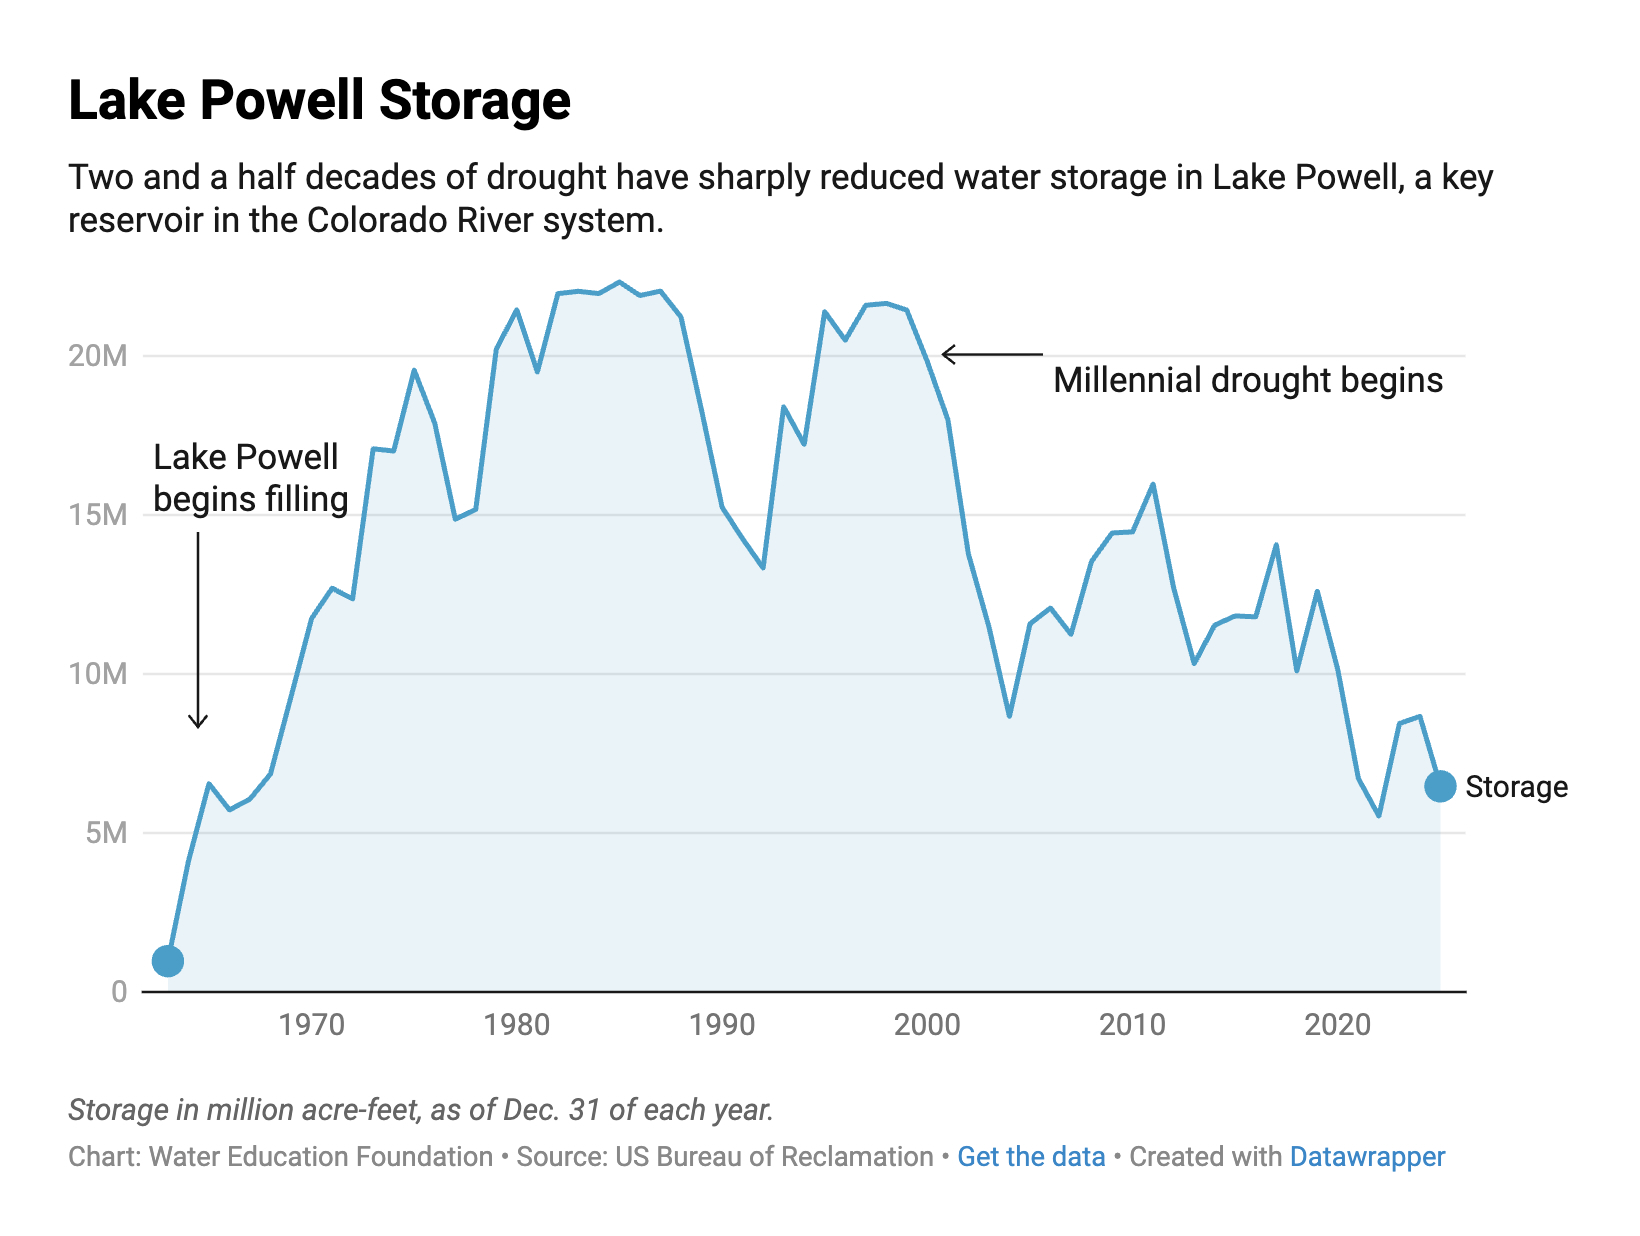
The stakes for an above average runoff next year are high. The two biggest reservoirs in the country, Lake Powell and Lake Mead have steadily declined over the last 25 years. Powell is currently at 29% of its capacity and Lake Mead is at 32%. A lessened runoff could push them dangerously low.
While the rain slightly alleviates local drought, it’s “only a drop in the bucket when it comes to refilling Lake Powell and Lake Mead,” Goble said. “We’re still going to see those regional water shortages persist.”
Glen Canyon Dam holds back the waters of Lake Powell, which has reached critically low levels in the last three years. The reservoir serves downstream water use in Arizona, California, Nevada and Mexico. (Mitch Tobin/The Water Desk)
If water levels continue to decline in these larger reservoirs, the dams’ infrastructure is threatened and the hydropower turbines can’t be used. Lake Powell, for example, has different outlets installed so water can be released in low conditions, however they are not designed to be the main outlet source. New federal projections show it’s possible Powell’s levels could drop low enough to cease hydropower production as early as October 2026, if conditions remain dry.
“They could reach levels they have never reached before and potentially reach catastrophic levels,” said John Berggren, regional policy manager for Western Resource Advocates.
In response to extremely low water conditions, it’s possible water from upstream reservoirs in Colorado, Wyoming and New Mexico could be released to support Powell’s hydropower turbines.
“We are seeing a new normal because of climate change, because of aridification,” Eric Kuhn said, former general manager of the Colorado River District, on the state’s Western Slope. In 2022, the basin saw similar drought conditions.
“We are back where we were just a few years later,” Kuhn said. “The system is slipping away.”
The basin states are also engaged in negotiations for new operating guidelines for the Colorado River, set to be in place by 2027. Given the ongoing drought conditions, water experts say the two reservoirs cannot wait for new guidelines.
“Don’t forget the short term problem while you are focused on a long-term agreement,” Kuhn said. A recent research paper, co-authored by Kuhn, highlights the need for urgent consumptive cuts basinwide. “We have got to figure out what’s going to happen next year if next year happens to be dry.”
This story is produced and distributed by The Water Desk at the University of Colorado Boulder’s Center for Environmental Journalism.
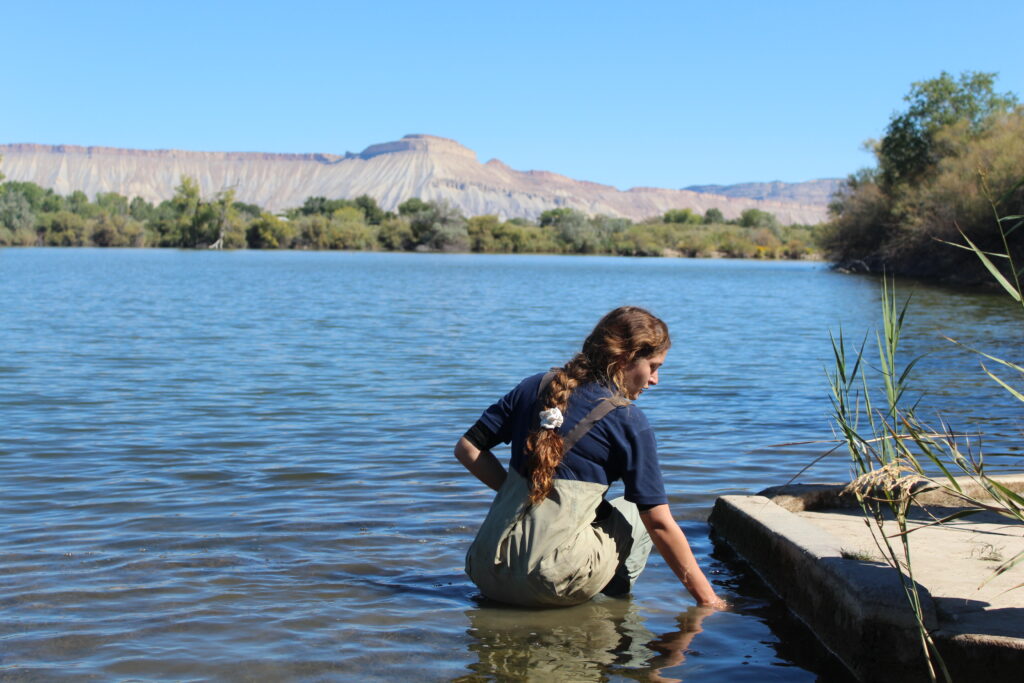
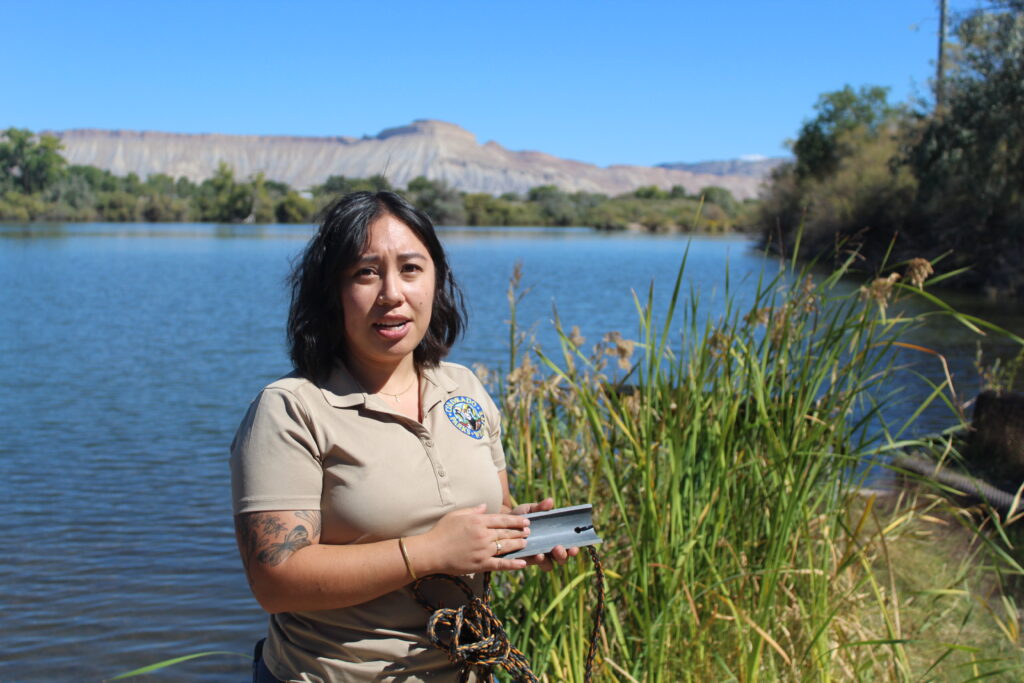
Colorado Parks and Wildlife invasive species specialist Maddie Baker looks for zebra mussels near the shore of East West Lake in Grand Junction, Colorado. (Caroline Llanes / Rocky Mountain Community Radio)
On a bluebird day at West and East Lake in Grand Junction, Maddie Baker throws a plankton tow net into the water, and drags it back to her.
“This is made of a 64 micrometer mesh, so that allows us to trap the veligers in their juvenile form, where they are microscopic and invisible to the eye,” she said.
Baker is an invasive species specialist for Colorado Parks and Wildlife. A veliger is the larval form of many kinds of mollusks, including the invasive—and pervasive—zebra mussel.
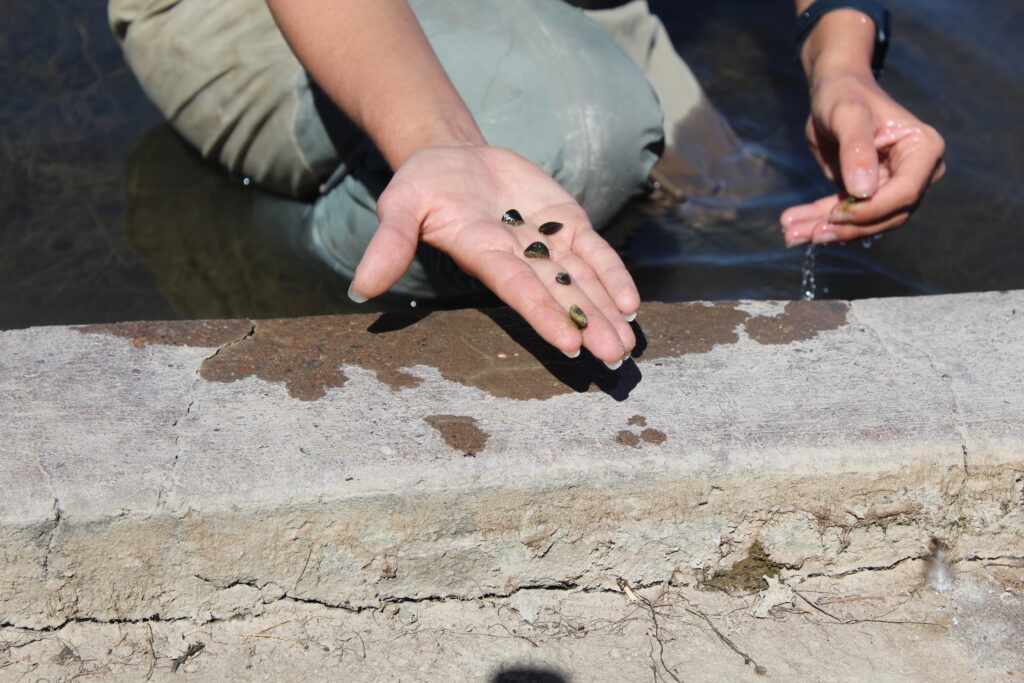
Baker doesn’t have to tow the plankton net to know the mussels are here. She picks mussel after mussel off of a concrete platform that gives anglers access to the lake. These zebra mussels are small, about the size of dimes (though they can grow bigger) and the little brown stripes that give the species their name are only just visible.
“It sucks,” she said. “It’s a very unfortunate realization for us to come to. And it shows us that this population is already well established in this body of water, if we can find adults with relative ease.”
Part of the reason water and wildlife managers hope to avoid zebra mussel infestations is how durable they are. Baker said they attach to hard surfaces using bissell threads.
“It’s organic material that they secrete from their body that forms both a physical and chemical bond with whatever hard surface they’re attaching to,” Baker said. “So this does last for their life and beyond.”
Maddie Baker, Colorado Parks and Wildlife invasive species specialist, holds five adult zebra mussels in her hand. (Caroline Llanes / Rocky Mountain Community Radio)
Zebra mussels are bad news for western waterways. Spread mainly by hitching rides on watercraft, the fast-reproducing mollusks clog water infrastructure, cling to marinas and docks, and outcompete native species. Colorado has taken costly measures to keep its lakes and rivers free of the mussels, but recorded the first official infestation in the state’s portion of the Colorado River this year.
Quagga mussels, zebra mussels’ close relatives, and other aquatic nuisance species, have made their presence known at reservoirs in the Colorado River Basin, like Lake Powell and Lake Mead. Lake Mead has been infested with quagga mussels since 2010, and Lake Powell was officially considered infested in 2012.
“At places like Lake Powell, where the water level fluctuates pretty often, you will see mussels that are still attached to canyon walls even after they’re already dead,” Baker said of the strength of bissell threads. “Just because those bonds are really lasting.”
Another alarming zebra mussel trait is how fast they reproduce.
“Each one of these can produce a million offspring and then each of those million offspring produces a million every single year,” Baker said, showing off a handful of zebra mussels, freshly plucked from the concrete platform.
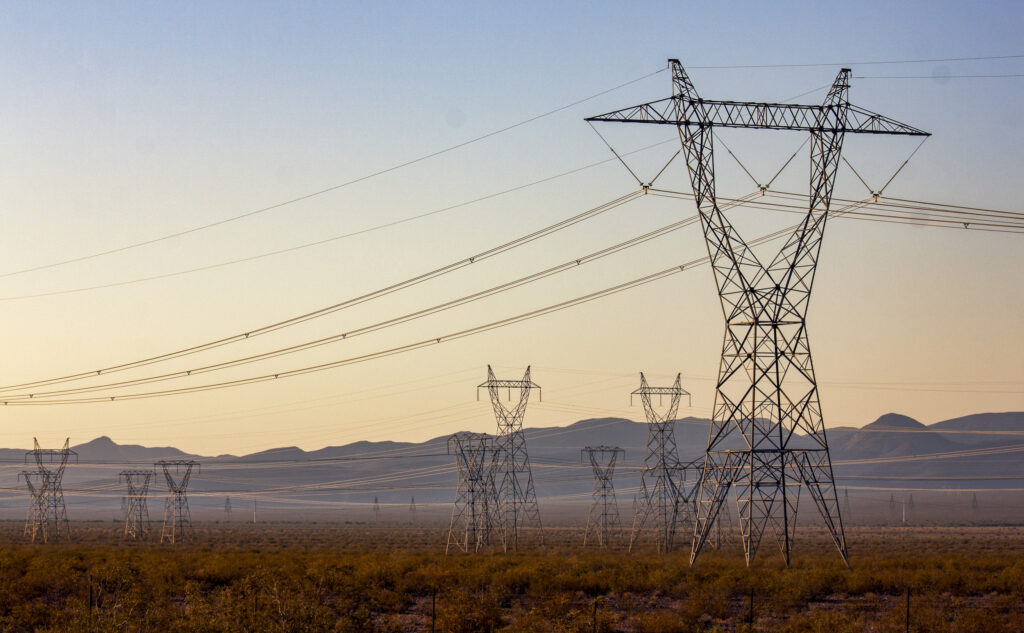
“The notion of these attaching inside of our pipes or hydroelectric infrastructure–dams–is very concerning,” she says.
Zebra mussels originally came to North America from Eastern Europe through shipping vessels travelling in the St. Lawrence Seaway. In the Great Lakes region, they’ve wreaked havoc on water infrastructure, and caused millions of dollars in damage.
Bruce Johnson is an Aquatic Invasive Species Lieutenant with the Utah Division of Wildlife. He said prevention and education programs at popular recreation areas like Lake Powell have been crucial in keeping quagga mussels contained.
Data from Lake Powell shows just how far boaters are traveling, and therefore, how widely contaminated vessels potentially carrying the microscopic veligers can spread the invasive species, Johnson said.
“Approximately 40% of our boaters that we document at Bullfrog (Marina) are Colorado-registered watercraft,” he said. “We have a high percentage of boaters that are coming from Colorado down to Lake Powell—an infested water body—and then traveling back into Colorado.”
Back in East and West Lake in western Colorado, Morgan Hoffmann holds up a little piece of pipe that stays in the water for mussels to attach to in their juvenile stage, when they’re still too small to see with the naked eye. It’s a method to detect when a water body might be infested. Hoffmann is an Early Detection and Rapid Response specialist with the state.
“On these, we’re really targeting the settler stage of the zebra mussels,” Hoffman says. “So when we pull these out of the water, we feel the pipe and we’re looking for a sandpaper-like texture on that stage of the mussel.”
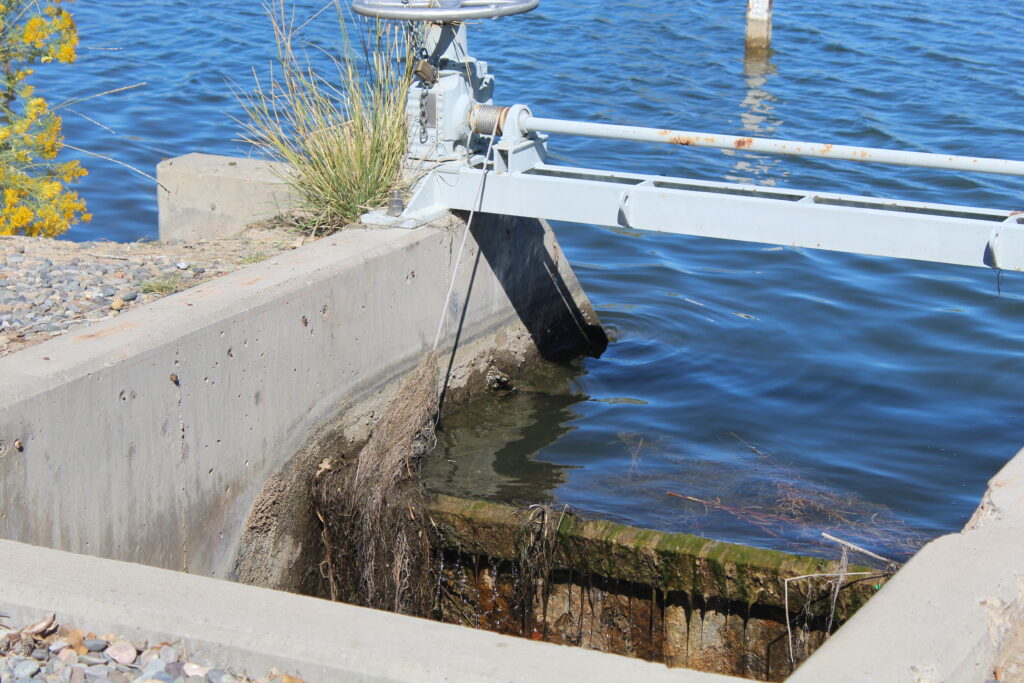
East West Lake in Grand Junction connects to the Colorado River via a nearby canal. Zebra mussels have already attached to the concrete infrastructure that connects the lake and the canal. (Caroline Llanes / Rocky Mountain Community Radio)
There are five bodies of water in Colorado that are officially considered “infested,” which means that the zebra mussels have established a reproducing population, with multiple life stages detected. In addition to West and East Lake, the list includes Highline Lake, Mack Mesa Lake, the Colorado River from the 32 Road bridge to the Colorado-Utah state line, and a private body of water in Eagle County.
The Colorado River is considered mussel-free from its headwaters to the confluence with the Roaring Fork River in Garfield County. Downstream of that point, until the river flows through the Grand Valley, CPW hasn’t found any adults, but they have found the veligers.
West and East Lake drains into the Colorado River, via a nearby channel. The Colorado River is already under tremendous pressure. Climate change is contributing to a historic drought, and there’s a lot of demand for water from both agriculture and growing communities throughout the Southwest.
Zebra mussels add another layer of stress to the river’s increasingly fragile aquatic ecosystems, said Rachael Gonzales, a CPW Public Information Officer.
“(Zebra mussels) also have an impact to the environment, and specifically to the water because they’re filter feeders,” she said. “So they are filtering every good nutrient that our native fish need to survive.”
It’s because of these threats that CPW is taking zebra mussels so seriously, and has increased its sampling efforts all the way to the river’s headwaters. Hoffmann oversees the program, along with the agency’s testing lab in Denver.
Morgan Hoffmann holds up a piece of pipe that functions as a landing pad for the juvenile stage of zebra mussels. Because they’re still too small to see, she and other CPW specialists feel for the sandpaper texture that indicates the mussels’ presence. (Caroline Llanes / Rocky Mountain Community Radio)
“I’m feeling confident in our program overall,” she said. “Since we found them, it’s kind of proven that our sampling and monitoring program is effective and the way we’ve designed it is working. So we’re detecting these pretty quickly, which is what we want to do.”
Robert Walters, CPW’s invasive species program manager, said that because of the severity of the threat, they’ve been able to access additional resources, including from the federal government.
“Because we are collaborating with them so regularly, we’re not only able to do what we know or are more traditional sampling technologies, but we are also able to utilize those that are out there on the cutting edge to give us the highest probability of finding these things out in the environment,” he said.
He said they worked directly with the federal Bureau of Reclamation to develop testing methods to detect zebra mussel DNA, and they worked with the U.S. Geological Survey to deploy an autonomous sampler on the Colorado River—a new piece of technology.
In 2026, Walters said, CPW has plans to install a dip tank at Highline Lake in Grand Junction to clean boats and watercraft. It allows more complicated vessels to be decontaminated without CPW staff needing to understand how the boat works.
It’s the result of ongoing regional collaboration and knowledge-sharing between Colorado and other states on how to best respond to this emerging threat. Utah has six such tanks, the first installed at Lake Powell in 2021.
Bruce Johnson, with the Utah Division of Wildlife, said there are three more on the way, in addition to the one in Colorado.
“We’re the only ones in the world to build dip tanks for decontamination,” he said.
Johnson said that sharing knowledge is critical for big projects like the dip tanks, but regional leaders are in frequent communication about day-to-day operations when it comes to preventing the spread of aquatic invasive species.
“Talking about new developments, boater contacts, information, biological advances, options for conducting inspections on those watercraft and any issues that we’re having with their different registered boaters,” he listed.
Johnson said that he regularly talks with regional partners in Colorado, Arizona, Idaho, Nevada, and Wyoming, along with federal partners like the U.S. Fish and Wildlife Service, the National Park Service, and the Bureau of Reclamation.
“That’s the beauty of the program, and why we’re so strong, and why we have held new discoveries, detections, and infestations to such a limited number here in the Western U.S. is because of that,” he said.
And it goes beyond just data and knowledge.
“We’ll actually coordinate our funding efforts,” Johnson said. “If there’s a new grant or funds that come into play, we’ll discuss our options and decide, ‘Okay, does this better fit Colorado? Is Colorado a better option to take a higher percentage of these funds?’ And Utah, we’ll take less funds because we know they can put it to better use than we can. And so we don’t fight over that.”
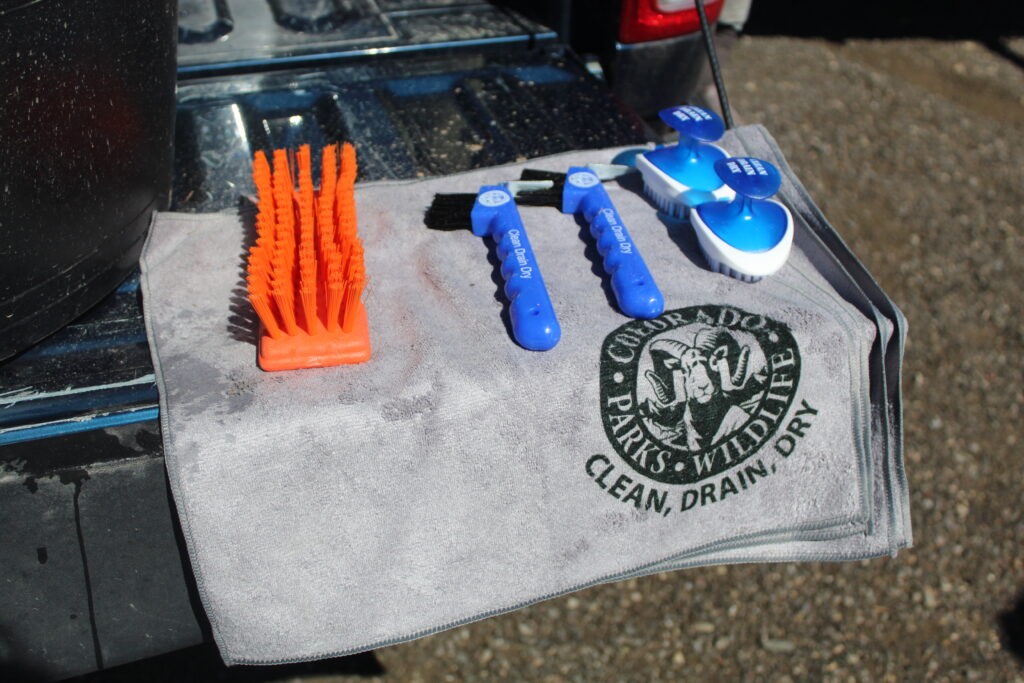
Colorado offers tools for recreationists looking to clean, drain, and dry their gear. They also offer free towels reminding people of the steps involved to properly remove any mussel remnants. (Caroline Llanes / Rocky Mountain Community Radio)
But Gonzales, the CPW spokesperson, wants to emphasize that it’s not just professionals out in the field that can make a difference. Zebra mussels spread from one body of water to another primarily through people recreating on the state’s waterways.
“We see a lot of fall fishing, we also see waterfowl hunting,” Gonzales said. “Taking a couple extra minutes when you’re done and cleaning your waders is going to go a long way to protect our bodies of water.”
The more the public can help with the risks, Gonzales says the better they can protect Colorado’s infrastructure, its native species, and a way of life that depends on healthy waters.
CPW lists gear-cleaning station locations across the state on its website, and the agency is asking the public to report any potential sightings of zebra mussels in local bodies of water.
Copyright 2025 Rocky Mountain Community Radio. This story was shared via Rocky Mountain Community Radio, a network of public media stations in Colorado, Wyoming, Utah, and New Mexico, including Aspen Public Radio. It was produced in partnership with The Water Desk at the University of Colorado Boulder.
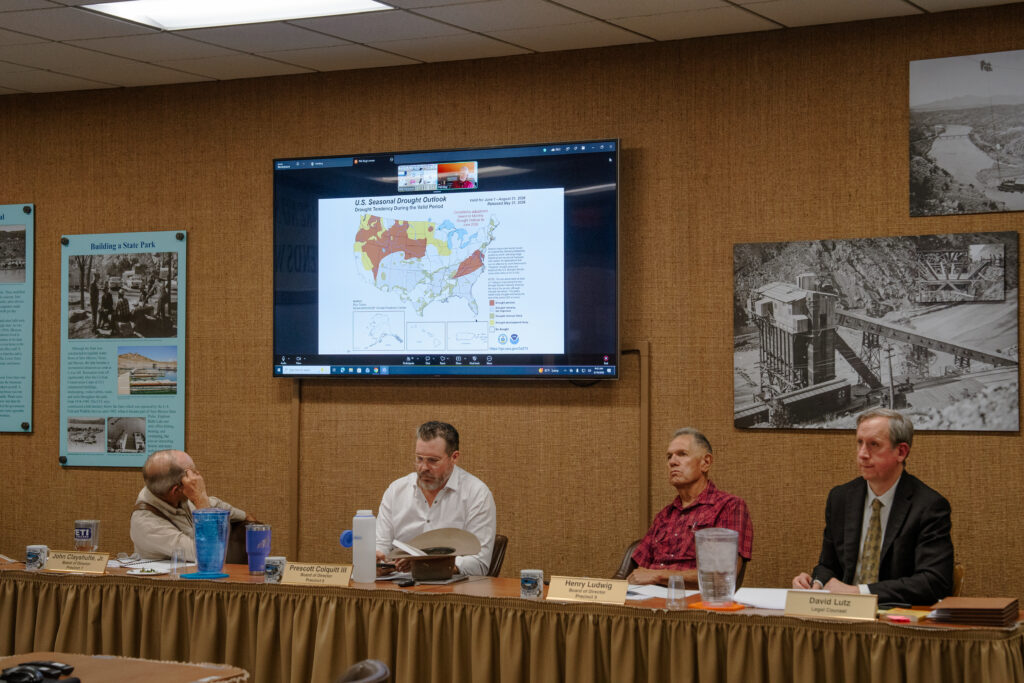
In late May, as the outside temperature approached 100 degrees, Arizona’s top water policy officials gathered in an air-conditioned Phoenix conference room. Their purpose that day was to decide whether the state should extend a longstanding drought emergency declaration. The standard indicators – minimal precipitation, low reservoirs, the second-hottest 12-month period on record – were not encouraging.
Halfway through the 90-minute meeting, gallows humor lightened the mood.
Ed Gerak, executive director of the Irrigation and Electrical Districts Association of Arizona, which represents power providers that receive federal hydropower from Colorado River dams, had the mic. Gerak shuffled through a matter-of-fact slide deck that explained how hydropower output from those dams, particularly the two largest, Hoover and Glen Canyon, has been diminished by shrinking reservoirs.
In the middle of the presentation, Tom Buschatzke, director of the state water agency, noticed a misspelling on the screen. He asked Gerak to scroll back to the previous slide.
“Is that Freudian?” Buschatzke asked. “Or did you put ‘Hoover Doom’ on purpose?”
For the millions of water and power customers in the Colorado River, it certainly feels that way. The typo, which received a knowing laugh from those in the room, cuts close to the truth.
The mood in the Colorado River basin is dreadful. River forecasts consistently overestimated runoff this year. Reservoirs are on a knife’s edge. The basin, on the whole, is drying. That’s frightful for the 40 million people and 5 million acres that the river supplies with water. But it’s also worrisome for electricity generation. Lakes Mead and Powell, the basin’s two largest reservoirs, are approaching critical levels in which hydropower from their dams (Hoover and Glen Canyon, respectively) would be severely curtailed or altogether cease.
Losing a power source at a time of life-threatening heat, rapidly rising electricity demand due to data centers and population growth, and a changing energy mix would be a blow to the region, though hydropower is a small portion of overall regional electricity supply. The impact of a hydropower cut would be unevenly distributed.
The mood in the Colorado River basin is dreadful. River forecasts consistently overestimated runoff this year. Reservoirs are on a knife’s edge. The basin, on the whole, is drying.
Small utilities have the most to lose. They operate with tiny customer bases,rely primarily on the dams and are at the mercy of market rates to cover hydropower shortfalls..
“We’re absolutely concerned about Mead dropping more,” said Dane Bradfield, general manager of Lincoln County Power District, in eastern Nevada, one of those at-risk small utilities. Hoover provides about 70% of its power, down from 100% two decades ago. “It’s on our minds every day.”
At the other end of the spectrum is the Gila River Indian Community Utility Authority, which serves the Arizona tribe whose lands surround the Gila River. Federal hydropower is only about 12% of its supply and its solar generating assets are growing rapidly.
“We’re not too put off,” said Kenneth Stock, the utility authority’s general manager, about less electricity from Hoover and Glen Canyon.
Acting like responsible asset managers who value diverse portfolios both Lincoln County Power and Gila River Indian Community, not to mention other utilities in the basin, are changing with the times. As the power of flowing water becomes less reliable, they are turning to an energy resource that is almost always on in the Southwest during the day: the sun.
Opened in 1936, in the midst of a national economic calamity, Hoover Dam was an expression of American optimism, worker desperation, and engineering prowess. Everything about its construction was monumental, from the 135 vertical feet of river bed that was excavated for the dam’s foundation to the creation of a town and rail lines that housed workers and ferried supplies to the remote and inhospitable Black Canyon work site, some 25 miles southeast of Las Vegas.
Walking inside Hoover’s labyrinth of tunnels, visitors today feel the dam vibrate with the impounded force of the Colorado River moving through its turbines.
Ever since these turbines started spinning, Hoover Dam electricity has flowed to irrigation districts, Native American tribes, cities, and industries. One of those original recipients is Lincoln County Power District. The tiny utility serves about 5,000 people across more than 10,000 square miles of rural eastern Nevada.
Until 2005, when the Colorado River reservoirs were in the early days of their 25-year plunge, Hoover Dam was the only power source Lincoln County needed. The dam provided all the district’s electricity.
Lincoln County is getting less hydropower because the dams have less to give. Since the turn of this century, Hoover’s electrical output has dropped in tandem with Lake Mead’s decline. Annual generation is down by about half since 2000, the last year the reservoir was full.
Graphic by Geoff McGhee/The Water Desk
Since the turn of this century, Hoover’s electrical output has dropped in tandem with Lake Mead’s decline. Annual generation is down by about half since 2000, the last year the reservoir was full.
More reductions might be in store. According to the Bureau of Reclamation, the federal agency that manages the basin’s large dams, if Lake Mead falls another 23 feet – to elevation 1,035 feet – Hoover Dam’s capacity to generate electricity would be slashed by 70% from its current level.
The huge drop in hydropower output is due to physics. A higher column of water behind a dam provides more pressure to spin the electricity-generating turbines. Less water, less pressure, less hydropower.
Twelve of Hoover’s 17 turbines are older units that were not designed to operate at low water levels. They could be damaged in a process called cavitation.
Twelve of Hoover’s 17 turbines are older units that were not designed to operate at low water levels. They could be damaged in a process called cavitation. This happens when miniscule air bubbles form due to water pressure changes. When the bubbles rupture, they gouge the turbine blades. Reclamation estimated this summer that replacing these older turbines with low-head units that are not prone to cavitation would cost $156 million.
Power customers, whose rates pay for dam operations and maintenance, hope Congress will come to their aid. One option would be an appropriation for the turbine upgrades. Another, unlocking some $50 million in funds set aside for pension benefits for federal employees. Power customers argue that the pensions are funded through other means and that Reclamation needs congressional approval if it were to spend the money on new turbines.
A severe curtailment of Hoover power is not implausible. Every month, Reclamation updates its projection of reservoir levels over the next two years. The June update shows a 10% chance that Lake Mead dips below 1,035 feet in spring 2027.
Glen Canyon Dam, the other big hydropower asset in the basin, is also in trouble. According to Reclamation, hydropower there will cease when Lake Powell falls below elevation 3,490 feet. The latest Reclamation projections indicate a 10% chance of that happening by September 2026. The agency is considering its options for the low-water scenario, but not publicly saying much more.
“Reclamation is in the early stages of developing and comparing alternatives for producing power below 3,490 feet and providing additional water delivery flexibilities,” Jennifer Erickson, a Reclamation spokesperson, wrote in an email. “It would be premature at this time to speculate on those results.”
Solar power is growing as a share of utility electricity regionally and nationally, even as solar faces stiffening headwinds from the Trump administration
Amid the gloomy hydropower projections, one power source in the basin is producing real and measurable progress. Solar power is growing as a share of utility electricity regionally and nationally, even as solar faces stiffening headwinds from the Trump administration. The White House has pulled funding for renewables and cancelled projects.
Lincoln County Power District, attempting to diversify from hydropower, is one of several electric power cooperatives that will benefit from Apache Solar II, a solar and battery storage project of Arizona Electric Power Cooperative that is expected to go online in December. Lincoln County will receive 5 megawatts.
The power district is also building its own 2-megawatt solar project thanks to a congressional earmark in the 2023 budget bill. Dane Bradfield, the district’s general manager, expects construction to begin next spring and electricity to begin flowing in the third quarter of 2027.
Solar is helpful for the power district because it will reduce its purchased power costs, which tend to be more expensive. When hydropower shortfalls occur, the district has to buy electricity on the market. It does so a year in advance through something called a power hedge. Market purchases also take place during the year if hydropower is less than expected or demand is higher than forecast. If electricity demand is high, market prices can be expensive. The district instituted a surcharge on customers starting in 2022 that provides reserve funds for when purchased power costs exceed the district’s forecast.
To the south, Gila River Indian Community Utility Authority is in an even stronger solar-power position, one that developed rapidly.
In the last three years, solar in Gila River went from almost zero – “extremely minimal rooftop solar,” said Kenneth Stock, the general manager – to 30% of the utility’s supply.
Gila River is not stopping there. The utility just broke ground on a nearly 21-megawatt solar project that should be completed in 18 to 24 months, Stock said. That’s in addition to smaller developments such as installing a half-mile of solar panels atop the Casa Blanca Canal. The 1.3-megawatt project was funded by the Biden administration’s infrastructure bill.
Even Boulder City, the community that was founded to house workers who built Hoover Dam, is moving in that direction.
Federal hydropower from the Colorado River provides about half of Boulder City’s electricity, according to Joe Stubitz, the city utilities director. But the city picked up 5 megawatts of solar and battery storage in 2022 through a power purchase agreement, and it wants more.
“What we’re doing now is we’re looking for other options, preferably renewables, to supplement that loss of capacity at Hoover,” Stubitz said.
Peak Value
Though solar is blunting the pain from Hoover’s power decline for individual utilities, less hydropower has broader ripple effects.
Hydropower’s value is measured not just in megawatts. It’s measured in its ability to rapidly turn on and off to respond to changes in electricity demand. This ramping power is important for today’s electrical grid in helping weave increasing amounts of solar and wind into the power mix.
In the early evening, power demand spikes as people return home from work and turn on appliances. At the same time, the sun is setting and solar generation is dropping. Utility-scale batteries typically have only four hours of storage. In these situations, hydropower can be flipped on, ready to generate power in minutes.
“We really count on [hydropower] to help us meet our peak demand,” said Grant Smedley, director of resource planning, acquisition, and development at Salt River Project during a meeting in August of the Glen Canyon Adaptive Management Program work group.
Graphic by Geoff McGhee/The Water Desk
What happens if Glen Canyon stops producing hydropower? Utilities will need to rely on a more diverse power mix.
Salt River Project provides water and energy to 2 million people in central Arizona. Solar, wind, and batteries today are less than a quarter of its power portfolio. By 2035, that number is expected to reach three quarters, Smedley said.
What happens if Glen Canyon stops producing hydropower? Utilities will need to rely on a more diverse power mix, including, in some cases, fossil fuel resources, to ensure the reliability of the system.
“I think that’s just a reality that we’re going to have to operate in,” Smedley said. “And so we recognize that we may be in that future for a bit, but to the extent that it’s available, [hydropower] is a very important part of our portfolio.”
This story was produced by Circle of Blue, in partnership with The Water Desk at the University of Colorado Boulder’s Center for Environmental Journalism.
Indigenous youths with Ríos to Rivers’ Paddle Tribal Waters program head toward the shore where the Klamath River meets the Pacific Ocean in Northern California on July 11. The young kayakers were joined by a flotilla with dozens of tribe and community members on the final days of their monthlong, 310-mile journey. (Erik Boomer / Courtesy of Ríos to Rivers) Eleanor Bennett reports for Aspen Journalism and Aspen Public Radio
KLAMATH, Calif. — In a thick forest along the remote northern California coast earlier this month, a group of mostly young Indigenous kayakers pushed off into the clear-emerald waters of the recently undammed Klamath River.
The 13- to 20-year-olds from more than six tribes in the Klamath Basin, along with several instructors, had been paddling for a month, covering over 300 miles.
In just a few hours, they would reach the Pacific Ocean, making the group among the first in over a century to descend the river from its headwaters in southern Oregon to its mouth in northern California. The expedition began in early June after the largest dam-removal project in history was completed last fall to restore salmon populations, improve water quality and support tribe-managed lands.
In the group was 15-year-old Hoopa Valley tribe member Carmen Ferris, who comes from a long line of fishing people along California’s Trinity River.
“The Trinity is the biggest tributary to the Klamath,” she said. “So I feel like I have a deep connection and ancestry with both of the waters.”
Carmen and about 40 other Indigenous kayakers had spent years training for the expedition with the help of Ríos to Rivers. Founded by Aspen resident Weston Boyles, 38, the nonprofit organization works with Indigenous youths around the world to protect rivers through advocacy, education and exchange programs.
Thirteen-year-old Scarlett Schroeder, left, and Coley Miller, 14, who belong to tribes on the Upper Klamath, stand with their paddles on the banks of the Klamath River. The Paddle Tribal Waters group of 13- to 20-year-olds from more than six tribes in the Klamath Basin, along with several instructors, were among the first in a century to paddle the free-flowing river after several major hydropower dams were removed last year. (Erik Boomer / Courtesy of Ríos to Rivers)
Historic paddle
In anticipation of the removal of four of the Klamath’s six dams, Boyles teamed up with local Indigenous youths and kayak instructors to launch the Paddle Tribal Waters program, with the goal of supporting young tribal members aiming to be the first to paddle the mostly free-flowing river since the first dam was built in 1918.
Although Carmen had heard about the dams growing up, it wasn’t until joining the program that she learned the full history of the decades-long effort by tribes and environmentalists, including her own Hoopa Valley people, to remove the dams from the Klamath and restore the salmon that local tribes once depended on.
“I was like, ‘Oh, my God, that is happening, and it’s nearby,’” she said. “I was in shock, and I learned about the history and what my ancestors and people before me have gone through for these dams to finally come out.”
Carmen spent two years in the Paddle Tribal Waters program — taking tribe-led classes on river ecosystems, advocacy and cultural knowledge, as well as learning to whitewater kayak both in her own backyard and on exchange trips to Chile.
“I built a love for kayaking,” she said. “And then I was like, I’m definitely doing the descent, like I can’t stop kayaking now.”
The journey from the river’s headwaters to the Pacific Ocean wasn’t easy, from camping in a remote, rugged wilderness to tackling a number of Class 4 rapids on the upper Klamath, including one called “Big Ikes.”
“I got battered into this hole for a little bit, and if I didn’t know how to roll, I’d probably swim that day, which wouldn’t have been fun, because there were a lot of rocks,” she said. “I ended up being OK, but everyone was like, ‘Carmen, what happened?’”
Ruby Rain Williams of the Karuk tribe, who turned 18 on the trip, said the paddle group faced other challenges beyond navigating technical and dangerous rapids.
“There were definitely some hard parts, like getting up every morning around 6:30, and also the flat-water days on the lake with the headwind were quite treacherous,” Ruby said.
They also learned some valuable river-trip lessons, including the importance of sun protection.
“I remember the first couple days, we’re all like, ‘Oh, we don’t need sunscreen. We never wear sunscreen,’” Ruby said. “You know, we’re swimming in the river all day and I put pink Zinc on my face just to look cool and I had polka dots burned all over my cheeks and my ears were burnt, and even my eyes because I didn’t wear sunglasses. It was just gnarly.”
A map of the Klamath River Basin shows the four hydroelectric dams that were removed last year: Iron Gate, Copco 1, Copco 2, and J.C. Boyle. The two remaining dams in the upper river basin (located west and northwest of J.C. Boyle Dam and depicted as gray dots) are mostly used for farming irrigation. (Courtesy of Cal Poly Humboldt)
Reshaped landscape
Along the river, the young kayakers saw how the dam removal and restoration effort had started reshaping landscapes and communities as they paddled through former reservoirs and dam sites, including Northern California’s Kikacéki Canyon, where for decades the water had been diverted to a power station, leaving a dry stretch of riverbed.
The four recently removed hydropower dams, which were built between 1918 and the mid-1960s, were still producing relatively low amounts of electricity. According to PacifiCorp, which operated the dams and is owned by Warren Buffett’s company Berkshire Hathaway, the sites were producing less than 2% of the operator’s total power generation — enough to power about 70,000 homes when they were running at full capacity.
The recently undammed Klamath River runs through the site of the former Copco Lake reservoir, named for the Copco 1 dam, in Northern California. Restoration efforts have begun above the former dam site, but signs of the former reservoir still remain on the landscape. (Eleanor Bennett / Aspen Journalism & Aspen Public Radio)
In addition to losing a relatively low amount of power generation, there were other concerns about removing the dams. These included potential impacts of drained reservoirs such as exposed sacred burial sites that had been previously submerged, increased fire risk, loss of tax revenues for nearby counties, and decreased property values for former lakeside homes.
Still, scientists and advocates for dam removal maintained that the dams and their reservoirs worsened water quality in the river and that removing them would reduce the likelihood of sediment buildup, toxic algae blooms and diseases that thrive in warmer, stagnant waters and are harmful to salmon. They also maintained that the dams blocked salmon from returning to their upstream habitat where fish lay eggs and babies grow before migrating to the ocean.
Eventually, local tribes and other dam-removal advocates came to an agreement with PacifiCorp and federal regulators, and in 2022, the four dams on the lower Klamath were approved for removal.
In order to alleviate some of the community concerns, the Klamath River Renewal Corporation (KRRC), which helped broker the dam-removal deal, and Resource Environmental Solutions (RES) are now overseeing restoration efforts. These include working with fire officials concerned about the loss of a wildfire-fighting resource once the reservoirs were drained to set up dry-hydrant systems that allow crews to pull water directly from the river.
They also worked with the Shasta Indian Nation to mitigate the risk of damage to newly exposed cultural sites. Last year, the state of California also transferred some of the land near one of the former reservoirs back to the group.
Other restoration projects include excavating sediment that had built up behind the dams and planting billions of native seeds along the riverbanks and former reservoir sites.
The two dams that remain in the upper section of the river in southern Oregon are primarily used to divert water for irrigation and farming. During their monthlong river trip, which began in Chiloquin, Oregon, the Paddle Tribal Waters group carried their kayaks on land and portaged around these remaining dams.
Tribal Paddle Waters youths kayak below the Keno dam, one of the two remaining dams on the upper Klamath. The expedition group carried their kayaks on land and portaged around both of the remaining dams. (Erik Boomer / Courtesy of Ríos to Rivers)
Salmon returning
Brook Thompson, a scientist and Yurok and Karuk tribe member, researches salmon life cycles and water quality, and joined the paddlers for the last few days on the river.
Despite an unexpected salmon die-off after the first of four dams came down last year, Thompson said hundreds of miles of fish habitat on the Klamath and its tributaries have now opened up and dwindling salmon populations are already returning to spawn in greater numbers.
“We really did not know what was going to happen with the salmon and if they would return right away, or if it would take years,” Thompson said. “So the fact that they immediately started going past where the dam sites were is so exciting for me as a tribal member.”
Researchers have also found lower rates of disease-carrying parasites and toxic algae since the dams were removed last year, according to Thompson.
Young Indigenous kayakers lead a flotilla of rafts and canoes on the final stretch of the Klamath River before reaching the Pacific Ocean on July 11. The 310-mile journey marked the end of a decades-long effort by tribes, environmentalists and fisher people to remove four major dams on the river in order to restore salmon habitat, improve water quality and support tribe-managed lands. (Eleanor Bennett / Aspen Journalism & Aspen Public Radio)
Thompson decided to study environmental engineering, water infrastructure and ecosystems after tens of thousands of dead salmon clogged the lower reaches of the river during a major drought in 2002, after a decision by the Bush administration that reversed environmental protections and allowed upper Klamath farmers to divert much of the remaining water.
“Witnessing thousands of fish die on the river firsthand as a 7-year-old really devastated me, personally, because these salmon are not just a food source for my family, they weren’t just our income — I paid for all my school clothes and supplies through selling fish as a kid — but they’re also a connection to family, they’re my connection to my ancestors and they’re really the lifeblood of the tribes here,” Thompson said.
Now that the dams are out, Thompson hopes reconnecting with the river, including through salmon fishing and recreation opportunities, can help address a rise in health concerns such as cardiovascular disease and diabetes, as well as mental health challenges faced by tribes in the region, including addiction and suicide.
“When you lose out on that culture, you’re having all these issues health-wise, and you’re having people die because of it,” Thompson said. “I know for me, if I’m not by the river, and I don’t get a chance to fish and pray and be thankful for this food that feeds my body, that connects me to my ancestors, then I don’t feel as well mentally either.”
Although the Klamath was once the third-largest salmon-producing river on the West Coast, young people such as Ruby, the Karuk tribe member, had only heard stories about those days.
Carmen Ferris, in the red kayak, of the Hoopa Valley tribe, and Ruby Rain Williams, in the blue kayak, of the Karuk tribe, float on a peaceful stretch of the Klamath River the day before reaching the Pacific Ocean. The two young paddlers grew up hearing stories from their elders about a time when the undammed river was plentiful with salmon. (Eleanor Bennett / Aspen Journalism & Aspen Public Radio)
“My grandma and my dad always told me how there used to be so many salmon in the river, you used to be able to walk across their backs and almost make it across,” Ruby said. “There was such an abundance of them that my grandpa would go spearfishing and be able to see them swimming through the river, because it was so clean and healthy.”
During a fall scouting trip before their monthlong journey, Ruby and another young kayaker were some of the first to witness the salmon migrate past one of the former dam sites in Kikacéki Canyon.
“We looked down, and then there’s these salmon just flying up the river, and you could see their heads at the top of the river’s edge,” Ruby said. “I’ve never seen that before. And to be able to say that I saw some of the first set of salmon make it up above where the dams used to be was incredible.”
‘Only the beginning’
John Acuna, a Hoopa Valley tribe member and Ríos to Rivers kayak instructor, helped lead the group of young people on the Klamath just a few years after being introduced to the sport.
Despite nearing the end of a long expedition with only a day left on the river, Acuna sees the monthlong descent as the beginning of something bigger.
“This is the biggest dam removal in history, and kind of the question is ‘What do we do next?’” Acuna said. “The hope is that this sets a precedent for other dam-impacted rivers and dam-threatened rivers, and I think our work has kind of just begun.”
Young kayakers with Paddle Tribal Waters embrace a loved one on the beach July 11 after completing a 310-mile journey to the Pacific Ocean. Community members welcomed the paddlers home with a traditional prayer ceremony on the beach. (Eleanor Bennett / Aspen Journalism & Aspen Public Radio)
Ríos to Rivers board member and river guide Jaren Roberson, who grew up in Arizona, agrees — and he hopes the recent dam-removal can be a model for how his own Diné (Navajo) and Hopi tribes can have a greater say in how water is allocated in the Colorado River basin.
“Indigenous people should be figures in these resource management areas because they’re the ones who have been taking care of them and have been living in these places for generations and generations and generations,” Roberson said.
During the last few days of the trip, Boyles, Ríos to Rivers’ founder, invited Indigenous groups from Bolivia, Chile and New Zealand to join a flotilla with dozens of local tribe and community members, which accompanied the long-distance paddlers as they neared the end of their journey.
Paddle Tribal Waters youths run to touch the ocean at the mouth of the Klamath River aft9er finishing their monthlong journey July 11. Some of the young paddlers have already started their own kayak clubs in their communities to help other Indigenous youth reclaim their rivers. (Eleanor Bennett / Aspen Journalism & Aspen Public Radio)
Afterward, the visitors were invited to share their experiences with dams in their own communities during a two-day symposium on the Yurok Reservation, near the California towns of Requa and Klamath, where the river meets the ocean.
“In other basins, the mistakes of building dams, of destroying habitat, destroying culture, can be avoided if we learn from the past,” Boyles said, addressing the symposium crowd July 12. “And that’s a goal and a vision of ours, is to make sure that folks in river basins that have yet to be impacted or could avoid having the big impacts of dams, can come here to the Klamath and other parts of the world and learn from all of your lived experiences.”
Reaching the ocean
On July 11, the final day of the monthlong paddle, dozens of community members lined the beach and cheered as the flotilla, with the young kayakers leading the way, emerged from the mist and paddled toward the Pacific Ocean.
Clarence Hostler, of the Hoopa Valley, Yurok and Karuk tribes, and two younger men brought traditional drums to welcome the paddlers.
He grew up swimming on the river as a kid in the 1950s, but he had to stop after he got a rash from the toxic algae.
“So I hadn’t been on the water on the Klamath since 1965, and just a couple of days ago, I joined the paddle group and it was a stretch of river that I’d never been on because I didn’t want to get that rash again,” Hostler said. “And then being with the group, it settled with me that this was a triumph of a spirit coming back to the river, that we get to live with the river again after so many of us had to stay away from the river because of the contamination.”
Seeing the young kayakers paddle the river, after experiencing decades of violence, protests and legal battles over fishing and water rights on the Klamath, brought him to tears.
Clarence Hostler, of the Hoopa Valley, Yurok and Karuk tribes, waits on the shore at the mouth of the Klamath River to greet the young Indigenous paddlers as they reach the ocean. Having grown up on the river in the 1950s, Hostler witnessed decades of violence, protests and legal battles over fishing and water rights before the dams were removed last fall. (Eleanor Bennett / Aspen Journalism & Aspen Public Radio)
“A lot of the early warriors had to do the difficult work, and there are some of us, older ones, who carry the knowledge of old ways,” Hostler said. “But now, some real work starts with these young people who are activists on the water because there’s more contaminated water yet that needs to be worked on.”
As Carmen and her fellow kayakers reached the ocean and splashed in the waves, she felt the weight of that history.
“We shouldn’t be having to do this — like, there shouldn’t have been dams in the first place — but we fought a lot for nearly a century, for decades and decades, and now dams are finally out,” Carmen said.
Even with feelings of sadness and frustration over what her people endured, Carmen is proud of what she and her peers accomplished.
“We’re making history,” she said. “This is something I never thought I’d ever do, but I’m doing it today.”
Now that the dams are out, Carmen and several of the other young kayakers who have already started their own kayak clubs, are looking forward to returning to their communities to help the next generation of young paddlers reclaim their rivers and their ancestry.
This story was produced by Aspen Journalism and Aspen Public Radio, in partnership with The Water Desk at the University of Colorado Boulder’s Center for Environmental Journalism.
Cranes and construction equipment line the shore at Gross Reservoir on June 19, 2025 in Boulder County, Colorado. The construction is part of an expansion project that will supply water to Denver’s residents. (Cassie Sherwood/The Water Desk)
Pieter Strauss used to love hosting stargazing parties at his house in the Lakeshore Park neighborhood up Flagstaff Road southwest of Boulder. The hobbyist astronomer would fire up the barbecue and spend hours showing his neighbors the night sky through his observatory and telescopes.
Strauss’s house sits looking directly over Gross Reservoir, which provides water to Denver residents.
But when a project to significantly raise the reservoir’s dam began construction in 2022, those moments of neighborhood tranquility were lost for some residents. For Strauss the biggest impact was the bright construction lights used to keep work moving overnight.
“It became impossible to sit on the deck before sunrise and after sundown, astrophotography was impossible. They lit up the skies,” with powerful floodlights, Strauss said.
For over 20 years, residents and various environmental groups have protested the project, which suffered a series of legal blows this year. Construction on the massive dam ground to a halt in April amidst the courtroom wrangling, and subsequent decisions have cast a new level of uncertainty over large-scale water projects that propose to draw on the beleaguered Colorado River.
However, by the end of May, federal courts ruled that construction could continue due to concerns surrounding uncompleted construction and potential flooding possibilities, but that the reservoir could not be filled.
Raising the dam
Gross Reservoir’s dam is owned and operated by Denver Water. The utility built it in the 1950s, with two other building phases planned to accommodate future water needs. The current dam expansion will raise the height of the dam 131 feet, tripling the current capacity of the reservoir, and providing more water for Denver Water customers.
The construction was spurred by “a combination of demands in our system, as well as concerns about climate and concerns about the needs for greater resilience in our system,” said Jessica Brody, general counsel for Denver Water.
The need for the expansion is similar to a bank savings account, Brody said. Tripling the capacity of the reservoir is a savings account that can be drawn on in circumstances of an emergency.
“If we have an extreme drought event, we want to have more water banks that we can help smooth the impacts to our customers,” Brody said.
When the utility initially announced plans to begin moving forward with a dam expansion, residents of the area were concerned. Environmental threats and the disruptions from the massive construction project topped the list of worries. They attended meetings at town halls with county commissioners. They organized with other residents in and around Coal Creek canyon.
While some residents fought the expansion, others anticipated it. When the dam was initially constructed, the utility planned to expand further down the line.
Since construction began in 2022, residents have experienced noise and light pollution. Five neighbors have moved from the Lakeshore Park neighborhood. Pieter Strauss, at whose house they once held stargazing gatherings, was among them.
Beverly Kurtz, member of TEG, on Pieter Strauss’s former porch overlooking Gross Reservoir on June 19, 2025. Once construction began, Strauss was no longer able to host neighborhood stargazing parties due to light pollution. (Cassie Sherwood/The Water Desk)
“The most valuable thing to all the people who have moved up here is that they had a quiet nature sanctuary. But then when you take that away, is it worth it?” said Anna McDermott, another resident of the area.
“We sleep with our windows open. Not one house has air conditioning, so you sleep with your windows open in the summer months,” she said. “You hear these giant backup beepers crashing, grinding all night long. Even with earplugs, I can’t sleep.”
The Environmental Group (TEG) is an organization of residents in the Lakeshore Park neighborhood and surrounding residents, focused on engaging the community in action when environmental issues arise. Along with Save the Colorado, The Sierra Club, and other environmental organizations, TEG has fought the expansion. Beverly Kurtz, former president of TEG, has worked to hold Denver Water and the companies working on the dam, Kiewit Corp. and Barnard Construction Company Inc., accountable during construction.
Heavy duty trucks are required to use a different road to access the dam rather than the paved road up Flagstaff Mountain due to fire concerns. Large semi-trucks have slid off the road due to the steep grade, which can cause traffic jams and road closures.
“At one point they had one of the two roads down this mountain closed for five months,” Kurtz said. “It wasn’t until we called the sheriff out here and he realized the safety concern that they opened the road back up.”
Legal snares slow construction
In October 2024, two years after construction began, Save the Colorado, along with other environmental groups, won a lawsuit against Denver Water. U.S. District Court judge Christine Arguello found the utility’s dam construction permit violated the Clean Water Act and the National Environmental Policy Act. At the time, construction was able to continue and Arguello ordered the groups to work out an agreement regarding damages.
In April 2025, the judge ordered a temporary halt on construction. The initial lawsuit argued that the U.S. Army Corps of Engineers, who provided the project permitting, did not fully consider climate change impacts when it approved the dam’s expansion.
A month later, Arguello ruled that Denver Water could finish construction on raising the dam, but that the reservoir could not be filled until the Army Corps reissued the permits.
“If you stop the construction of a dam when it is partially built, the dam doesn’t function as it was ultimately designed to function,” said Denver Water’s Brody. “That was a big concern of ours and the Federal Energy Regulatory Commission.”
The utility has also been ordered to not remove any additional trees surrounding the dam until the proper permits are obtained. The project proposes the removal of over 200,000 trees.
Arguello’s opinion also called into question the underlying water rights Denver Water would rely on to fill the newly enlarged reservoir when construction finished. Gross Reservoir is filled with water from the headwaters of the Colorado River, which has experienced steep declines in water supply amid a long-term warming and drying trend in the Rocky Mountains.
“The Environmental Impact Statement didn’t even look at the fact that the flows of the Colorado River are in decline. Most of the science suggests they will continue to decline further,” said Doug Kenney, Western Water Policy Program director at the University of Colorado Boulder’s Natural Resources Law Center. Acquiring new permits will require Denver Water to redefine the project’s purpose and evaluate the environmental damage, he said.
The case is more than a local water project. Diverting more water across the western slope of Colorado has created concerns for ecosystems throughout the overappropriated watershed and for communities downstream in California, Nevada and Arizona.
“It makes it more difficult to ensure that there’s sufficient flow downstream as a result,” Kenney said. “We have got to stop this practice of taking more and more water out of the upper reaches of the Colorado River because it just increases the stress on a river that is already under a tremendous amount of stress.”
By calling into question the project’s potential to have downstream impacts, the decision could add a new legal hurdle future water development infrastructure will have to clear.
“Historically, agencies in recent decades have not done enough to consider climate change in decisions,” Kenney said. Cases like this one need to happen in natural resource law more generally, he said, as they help establish precedents for future projects that could potentially put the environment at risk.
Denver Water is appealing the court decisions that bar the expansion. That could result in a reissue of the permits with a redefined purpose or a dismissal of the court rulings made earlier this year.
“We think that the district court made some misjudgements or misinterpretations when it found the Army Corps committed these errors,” Brody said.
Learning to live alongside it
Amid the stops and starts of Gross Reservoir construction, nearby residents are not ready to let go of what they used to have.
Kurtz and McDermott recall their old activities along the reservoir’s north shore. A handful of neighbors would walk their dogs everyday along the hiking trail that connected the reservoir to their neighborhood. The trail has since been widened significantly, to allow for excavating equipment. They would host Memorial Day parties along the water’s edge.
Beverly Kurtz and Anna McDermott, longtime residents of the Lakeshore Park neighborhood pose in front of Gross Reservoir on June 19, 2025. They are members of TEG, an environmental group involved in a lawsuit against Denver Water. (Cassie Sherwood/The Water Desk)
Now they minimize their excursions to the shore as much as they can. At this point they’re more than ready for construction to be completed, exhausted from the daily disruptions, explosions and drilling.
“Now clearly, when the work is done, the things which negatively impacted my life would go away. But I couldn’t last them out,” Strauss said. He recently relocated to the Boulder area. “It was just my bad luck that my golden years coincided with the worst effects of the project.”
Some residents found that the expansion project has renewed their sense of community in Lakeshore Park.
“In a weird way a lot of us have gotten even closer because we were in the battle together,” Kurtz said. “We feel like at this point we won the battle, but we’ve lost the war.”
“They will get the permits to eventually fill this reservoir following the expansion,” she said.
However, federal courts requiring the proper permits to continue construction is a win in her and TEG’s book, as it sets a precedent for any large construction processes that occur in the future. It will ensure that the proper environmental permits are obtained before construction can begin on a project.
“If nothing else, we hope that precedent still stands. Because it will help somebody else,” she said.
This story was produced by The Water Desk, an independent journalism initiative at the University of Colorado Boulder’s Center for Environmental Journalism.
Dogs are permitted and regularly accompany human hikers into places like the Cirque of the Towers, but the domestic animals leave behind waste that may be contributing to water quality issues. (Mike Koshmrl/WyoFile)
LONESOME LAKE, WYOMING—Whit Coleman belly flopped with style into some of Wyoming’s most famous alpine waters on a summer day.
Out on a father-son backpacking trip with friends, the Salt Lake City man took the plunge with an incredible backdrop: the Wind River Range’s Cirque of the Towers, a semi-circle of big-walled granite peaks that all top 12,000 feet. The dip was pleasant, he recalled later in the day.
“It’s probably better that we didn’t know,” Coleman said. “We enjoyed ourselves. I’m not too worried about getting sick.”
Coleman learned of a potential health concern after the fact while hiking out from Lonesome Lake, which sits at the bottom of the cirque and forms the headwaters of the North Popo Agie River.
Lonesome Lake has long been reputed to be unfit for drinking and even swimming. That’s due to contamination presumed to be from the hordes of humans who poop while traveling through the popular backcountry basin. Now there’s a datapoint to back it up.
On Aug. 9, 2022, during the height of the recreation season, environmental regulators gathered a water sample from a foot below the surface near the outlet of Lonesome Lake.
The concentration of Enterococci — bacteria indicative of fecal matter — jumped off the page.
The U.S. Environmental Protection Agency didn’t make the results public for two years. When they were published, heads turned.
Lonesome Lake’s sample contained 490,895 calibrator cell equivalents of Enterococci for every 100 milliliters. The EPA’s safety threshold for swimming is 1,280 CCE/100 mL.
The concentration of fecal bacteria, in other words, was 384 times greater than the EPA’s criteria. Not only that, but the fecal bacteria were more concentrated in Lonesome Lake than in any of the other 981 lakes that were surveyed around the country for the federal agency’s National Lakes Assessment, which gathers data for randomly selected ponds, lakes and reservoirs every five years.
A group of backpackers from the Salt Lake City area cross the outlet of Lonesome Lake on July 9, 2025. (Mike Koshmrl/WyoFile)
Arguably, Lonesome Lake was the most spectacular, remote waterbody in the broad study examining lake health all around the United States. Its snowmelt-fed 35 acres of crystal clear water, located within the Popo Agie Wilderness, are just a half mile off the Continental Divide along the spine of a mountain range that hosts more than two dozen glaciers and the highest peak in Wyoming.
And yet the data also suggested that Lonesome Lake’s water was the most polluted by poop. That’s especially remarkable given that the assessment also looked at lakes and ponds in urban areas and agricultural regions more typically associated with feces-related pollution.
Early in the process
The sky-high Enterococci concentration found during the EPA’s 2022 survey — sampling conducted by the Wyoming Department of Environmental Quality — set off a chain of events.
Because of its location in a designated wilderness area, Lonesome Lake is classified by Wyoming as a “Class 1” water. That’s a designation that protects uses like “primary contact recreation,” and demands that “nonpoint sources of pollution” be controlled through “best management practices.”
The DEQ and the Shoshone National Forest decided they needed more data to understand the scope of what’s going on.
“A single datapoint doesn’t necessarily tell us much of anything,” said Ron Steg, DEQ’s Lander Office Manager. “We need to get some real data to understand if there is a problem. If there is, we’ll react to the results of the data.”
Jackass Pass sits along the Continental Divide, and also marks the dividing line between wilderness areas in the Bridger-Teton and Shoshone national forests. The pass descends east into the Cirque of the Towers, which surrounds Lonesome Lake. (Mike Koshmrl/WyoFile)
In October 2022, weeks after the EPA results came out, staffers with the federal and state agencies trekked into the cirque to conduct follow-up testing. Gathering water samples outside of the busy backpacking and climbing season — trail-counter data shows that use virtually shuts off entirely come mid-September — they weren’t able to detect any levels of another fecal indicator bacteria, Escherichia coli (E. coli).
That sample was collected “well past peak recreation season, from a source standpoint,” said Jeremy ZumBerge, who supervises DEQ’s Surface Water Monitoring Program. “You’re also past peak exposure time — when people are most likely to be exposed.”
Water near popular recreation areas in Lonesome and Big Sandy lakes is being sampled five times during the busy summer backpacking season in 2025. The Wyoming Department of Environmental Quality probe could precede an impairment designation in one or both lakes, if regulators detect dangerous levels of E. coli bacteria. (Wyoming Department of Environmental Quality.)
This summer, a much more extensive effort is underway to suss out what exactly is going on in Lonesome Lake. Between July 14 and Sept. 11, DEQ and U.S. Forest Service officials will take five samples near the south and west shore, where trails come down off of Jackass Pass and the North Fork and concentrate use. While they’re at it, the team of hydrologists and watershed protection specialists will also take water samples from Big Sandy Lake, located on the Bridger-Teton National Forest.
“That was of interest to the Forest Service, knowing that Big Sandy is also a very popular destination — and it is very convenient, as it’s off the main trail used to access Lonesome Lake,” ZumBerge said.
The specifics of the joint state-federal investigation are laid out in a “sampling and analysis plan” for Lonesome and Big Sandy lakes that Wyoming DEQ published in March. The results will be published in a subsequent DEQ assessment report.
The scientific inquiry has the potential to elucidate an environmental hazard that frequent Wind River Range travelers have long been aware of. It’s no secret: Lonesome Lake’s diminutive watershed — just 2 square miles — is thought to be overrun with poop that makes its water unsafe. The guidance is all overthe placeonline, and is also frequently passed along word of mouth.
The south and west reaches of Lonesome Lake are visibly shallow in this July 2025 photo taken while descending from Jackass Pass. Long reputed to have quality issues related to human waste, the Shoshone National Forest lake is being examined for an E. coli impairment after regulators initially detected fecal bacteria levels several hundred times more than is believed to be safe. (Mike Koshmrl/WyoFile)
Poop lake
“I tell people definitely do not swim in there, I tell people definitely do not drink the water,” said Brian Cromack, an employee of Pinedale’s Great Outdoor Shop who often advises Wind River Range travelers. “It’s been heavily contaminated for a long time, just via the negligence of outdoor recreation enthusiasts over the years.”
Fecal bacteria readings 384 times the safety threshold “sounds about right,” Cromack said.
“Hopefully, people are more mindful,” Cromack said. “I think the big problem why Lonesome Lake is so bad is because of the serious climbing prevalence there. Generally, backpackers are a little bit more conscientious about how to dispose of their waste. Not to rag on any one group — I love to climb.”
The Shoshone National Forest has imposed special regulations to protect the water and resources near Lonesome Lake, one of the most-visited interior destinations in the Wind River Range. The restrictions may not be enough to protect the lake from contamination from human feces. (Mike Koshmrl/WyoFile)
Regardless of who’s doing the pooping, there’s a lot of it and it’s easy to find.
WyoFile visited Lonesome Lake in July and within minutes found seven makeshift latrines in likely areas — in the trees, not far off the trail. Most were loosely buried to varying degrees. In other places, toilet paper and excrement had become exposed.
And it’s not yet peak busy season. Early July, according to the trail-counter data, attracts 100 people or fewer to Lonesome Lake weekly. By early August, the weekly counts crest 250 wilderness travelers, and by the middle of August, a whopping 400 people are trekking into the Cirque of the Towers every seven days.
The Shoshone National Forest has imposed special regulations to protect the water and resources near Lonesome Lake, one of the most-visited interior destinations in the Wind River Range. The restrictions may not be enough to protect the lake from contamination from human feces. (Mike Koshmrl/WyoFile)
Collectively, it’s a lot of biomass. A decent chunk of it gets left behind. Back-of-the-napkin poop math suggests that, at roughly a quarter pound per stool, perhaps 100 pounds of human feces are getting squished under rocks or buried in the shallow soil that rings Lonesome Lake on a weekly basis during the height of summer.
“I don’t know specifically how that [fecal bacteria] transport to the lake could occur,” said ZumBerge, the Surface Water Monitoring Program supervisor. “I imagine there’s a few different ways that transport can make it to the lake — if it’s happening.”
At between 10,000 feet and nearly 13,000 feet in elevation, the Cirque of the Towers and the basin it surrounds are buried by feet of snow each winter. It melts off in the spring and summer, bound for the low point of Lonesome Lake.
Possible fixes?
Hiking along Lonesome Lake’s southern shoreline on a July afternoon, Glenwood Springs, Colorado, resident Carl Meinecke, an arborist, wasn’t so shocked by the fecal phenomenon.
“It’s not completely surprising,” Meinecke said. “Things aren’t like they used to be. We’re getting such high use in some of these areas, it becomes tricky.”
Carl Meinecke, a Roaring Fork Valley, Colorado arborist, reflects on human use-related water quality issues suspected to be plaguing Lonesome Lake, in the background. (Mike Koshmrl/WyoFile)
The regulations on many western rivers, he pointed out, require that campers carry out their waste in specialized containers known as wag bags or a groover.
“That would be pretty tough here, carrying it out,” Meinecke said.
It wouldn’t be unheard of.
As nearby as Grand Teton National Park, poop-removal regulations are in place. Portable toilet systems are required for backcountry camping on Jackson Lake and all overnight users of Garnet Canyon must pack out their human waste in EPA-approved containers, according to the park regulations.
Steg, at the DEQ, emphasized that it’s tough to know what the future holds. But if the data bears out, he said, the fecal bacteria concentrations will “certainly need to be addressed.”
“It’s a very unique situation to have a water quality issue this many miles into a wilderness area,” Steg said. “It’s not something that any of us have regularly dealt with. We’ll see where the data points us.”
ZumBerge, his DEQ colleague, was unaware of any other Wyoming waters where human use has been implicated in a fecal bacteria problem. During the 2022 EPA assessment, there were 27 total lakes randomly sampled in the state, including six in the Wind River Range.
“Lonesome was the only one that rose to our attention as being potentially elevated,” ZumBerge said.
Environmental regulators do have tools at their disposal designed to address water quality problems. “Total maximum daily load” [TMDL] plans, for example, are years-long strategies commonly used to bring waterways into compliance with the Clean Water Act. In Wyoming, they’ve been used to attempt to address livestock feces-related E. coli bacteria pollution in places like Star Valley’s Salt River.
Steg, who supervises that program, said it’s way too early to say if a TMDL will be necessary for Lonesome Lake.
“That’s a pretty big tool for a pretty simple problem — if, in fact, there is a problem,” he said.
This story is produced by WyoFile, in partnership with The Water Desk at the University of Colorado Boulder’s Center for Environmental Journalism.
Hoover Dam holds back the waters of the Colorado River at the Arizona-Nevada state line. (J. Carl Ganter/Circle of Blue)
The long-term drying of the American Southwest poses a gathering and measurable threat to hydropower generation in the Colorado River basin.
Should Lake Mead, the reservoir formed by Hoover Dam, continue to shrink, a substantial drop in the dam’s hydropower output is on the horizon.
The diminished state of the lake and the potential severe drop in electricity supply illustrate the consequences of a warming climate for the region. Built in the throes of the Great Depression, Hoover was the signature project of a country displaying its grit and engineering prowess to tame the West’s mightiest rivers to irrigate farmland and build cities. Today the dam is an aging asset buffeted by hydrological change and generating half the power that it did just a generation ago.
According to the Bureau of Reclamation, the federal agency that manages the basin’s large dams, if Lake Mead falls another 20 feet, Hoover Dam’s capacity to generate electricity would be slashed by 70 percent from its current level.
If there is a reason not to be especially alarmed it’s this: Hoover is just a small piece of the region’s electric power infrastructure. Federal dams along the Colorado River account for just over 4 percent of Arizona’s generating capacity, for instance.
Still, the cheap electricity is a lifeline for tribes and small rural electric providers. And the dam’s ability to be quickly turned on and off helps regulate the peaks and troughs of electricity demand. Curtailing this source of inexpensive electricity would raise the cost of power in the region while also challenging the integration of renewable energy into the electric grid.
A hydropower shortfall will be “bad news for us,” said Ed Gerak, executive director of the Irrigation and Electrical Districts Association of Arizona, which represents power providers that receive federal hydropower from Colorado River dams.
Lake Mead now sits at an elevation of 1,055 feet. The break point for hydropower is 1,035 feet. At that level, 12 older turbines at Hoover that are not designed for low reservoir levels would be shut down, Reclamation said. Five newer turbines installed a decade ago would continue to generate power.
Hoover Dam, at the center of the photo, forms Lake Mead, which is currently just 31 percent full. (J. Carl Ganter/Circle of Blue)
The threat is real, especially as this year’s runoff forecast for the basin continues to worsen. Every month, Reclamation updates its projection of reservoir levels over the next two years. The June update shows a 10 percent chance that Lake Mead breaches 1,035 feet in spring 2027.
In a worst-case scenario, the breach would happen at the end of 2026, just when current operating rules for Lake Mead and Lake Powell expire. The modeling indicates a similar chance that Lake Powell drops low enough in 2027 that Glen Canyon Dam, another key hydropower asset in the basin, stops producing electricity.
The probability that Lake Mead drops that far is small and laden with uncertainties about weather and water use. But it is large enough that Hoover’s power customers are signaling their concern.
Reclamation, for its part, acknowledges the problem at Hoover and is evaluating its options. The agency estimates that replacing the 12 turbines would cost $156 million.
“Reclamation is assessing the cost-benefit analysis of replacing some of the older style turbines and the timeline for installation,” the agency wrote in a statement to Circle of Blue. “Ordering new turbines is a lengthy process as they have to be designed, model tested, built and ultimately installed.”
The dozen older turbines are not designed to operate at low reservoir levels. Dams like Hoover, which was completed in 1936, function based on the principle of hydraulic head, which is the difference in elevation between the top of the reservoir and the intake pipes for the dam’s powerhouse. When the hydraulic head drops, so does the water pressure. That can trigger the formation of air bubbles in the water, which can gouge and damage the turbines in a process called cavitation.
The five turbines that would not be shut down are low-head units that can accommodate lower reservoir levels. Installed a decade ago at a cost of $42 million in response to a previous rapid decline in Lake Mead, they can operate down to 950 feet. (One of those five turbines is currently offline, and Reclamation does not have an estimate for when it will resume operating.)
Hoover is already hobbled by low water. Power generation in 2023 was roughly half the output of 2000, the last year that Lake Mead was effectively full.
When Lake Mead is full, Hoover has a generating capacity of 2,080 megawatts, equivalent to a large coal-fired or nuclear power plant. Today its capacity is 1,304 MW. If the dozen older turbines go offline, it will drop again, to 382 MW.
These declines in hydropower generation have been felt by the customers who buy Hoover Dam’s electricity, Gerak said. In a shortfall, they have to buy market-rate electricity. Depending on the season and power demand, market rates can be considerably more expensive.
Eric Witkoski is the executive director of the Colorado River Commission of Nevada, which manages the state’s allocation of Hoover’s power. Witkoski said that rural electric companies in his state have a higher share of their electricity coming from the dams and would be most affected by a shortfall.
The value of Hoover’s electricity is measured not just in raw megawatts and dollars. It is a flexible power source that can be ramped up and down to match the region’s daily and seasonal rhythms. Energy use rises in summer afternoons when air conditioning units are blasting and electricity-consuming household chores are at hand. It falls at night when cooler air prevails and washing machines are silent.
“The beauty of hydropower is that it’s great for helping to stabilize and regulate the grid,” Gerak said.
IEDA and other interest groups are pursuing a number of fixes. They are encouraging Reclamation and its parent agency the Interior Department to use federal infrastructure funds to install new low-head turbines or to request appropriations from Congress.
They are writing their congressional representatives in support of the Help Hoover Dam Act, a bill that would unlock some $50 million in ratepayer funds that had been set aside for pension benefits for federal employees. The trade groups claim that Congress funds the pension benefits through other means and that the funds could be spent on dam upgrades if Reclamation was given the authority to do so.
They also want to set up an organization modeled after the National Parks Foundation that can accept donations for dam operations and maintenance, including the visitor center, which is supported by power sales.
These fixes will take time. But as Lake Mead declines, the urgency to achieve them will intensify.
The Yampa River meanders outside of Craig, Colo. on May 12, 2025. The city is one of a few small communities that line the mostly rural waterway. (Luke Runyon / The Water Desk)
What used to be a calm stretch of the Yampa River near Craig, Colorado, now boasts a new set of rollicking whitewater rapids.
They’re not the result of some new rockslide. The boulders in these rapids were selected to create just enough splashy holes to attract kayakers, and they act as the focal point of the city’s new effort to draw residents and tourists down to the river’s banks.
On a breezy spring afternoon Melanie Kilpatrick, the project manager overseeing the construction of the new Yampa River park, stood along its banks as large earthmoving machinery prepped more large boulders for placement in the river channel.
“I’ve always felt like the Yampa has been an underutilized asset in the area,” Kilpatrick said, noting that the river hasn’t always been seen as a recreation amenity. It flows to crops and through the nearby coal plant. But its ability to generate tourism dollars was underplayed, she said. Just getting down to its banks has been a challenge.
“I may have come to tube the area, but access is very rough and rustic,” Kilpatrick said.
Craig, a city of 9,000 residents in Colorado’s northwest corner, is facing a big transition.The local coal plant is slated for closure in a few years. The ensuing economic anxiety sent its leaders looking to diversify and establish a new draw for tourists. They decided to double down on becoming a recreation hub for the region, centered on the Yampa River, which flows through town.
The Yampa River Corridor Project is set for completion in October. It boasts new rapids, an established boat ramp and improvements to the city’s drinking water infrastructure.
But unlike officials in other Colorado communities, Craig officials have so far chosen not to pursue a water right to support this new recreation amenity.
The city of Craig’s Melanie Kilpatrick oversees construction of the new Yampa River Park on May 12, 2025. It’s slated to open later this summer. (Luke Runyon / The Water Desk)
The Yampa’s flows are notoriously hard to predict, and rather than ruffle feathers with other local users, the city has tabled discussion over what is known as a recreational in-channel diversion, or RICD. The right can hold a place in line in Colorado’s water appropriation system and gives legal standing to the cities and towns that invest in whitewater parks. If exercised, an RICD could force another water user on a stream to stop diverting in order to preserve flows for recreation alone.
In the arid West, a hierarchy of water users has long favored agricultural and municipal uses, some of the first major uses to come online during the region’s colonization. Newer uses that embody the Southwest’s changing values — uses such as incorporating water to support ecosystems or to boost recreation — have had to weave their way into that more traditional, inflexible system. And recreation advocates are often trying to forge new alliances with traditional users to further their aims or to avoid causing undue friction among their fellow users.
In the design and construction of the city’s new whitewater park, Craig’s leaders considered obtaining an RICD but aren’t ready to pull the trigger, Kilpatrick said.
“We were very mindful about flow levels, but also just, you know, concerned about what’s happening on the horizon,” Kilpatrick said. “We can’t design this massive park if we don’t have the flows to support it. And that’s not what we intended to do. We wanted to build something that would naturally integrate in the flows that we anticipate to see now and in the future.”
Part of the city’s calculation is that in the short term, there’s a good chance that the existing water rights structure on the Yampa will end up benefiting the park even without any additional protections. Large users with older water rights sit downstream of Craig. When those farmers and ranchers call for water through the river channel, it ends up flowing past the city anyway, boosting its flow. The same goes for additional flows to protect endangered fish species farther downstream that can happen throughout the spring and summer months.
But even with a rosier short-term outlook for flows, Kilpatrick said there is growing concern about the Yampa’s viability in a warming, drying world. Eventually, she said, there could be a good reason to apply for a recreational water right.
“I think at least keeping that dialogue going is going to be an important factor as we kind of determine, as a community, whether that’s something we approach or not,” she said.
The Yampa River Park begins to take shape in Craig, Colo. on May 12, 2025. Facing an impending closure of its nearby coal plant, the city has invested more in recreational opportunities to draw tourists and new workers. (Luke Runyon / The Water Desk)
Meeting multiple needs at once
It’s a similar story a couple hours’ drive south in Grand Junction, where a meandering side channel flows off the Colorado River, ready for tubers and stand-up paddleboarders. Over Memorial Day weekend, dozens of people splashed and swam along the banks to cool off amid temperatures in the mid-80s.
“It’s a great amenity for the city of Grand Junction and the whole valley to get to come down and experience the river in a way that wasn’t really accessible before,” said Hannah Holm, associate director for policy for the advocacy group American Rivers.
The side channel is relatively new and gives residents a safer way to come play in the swift-moving Colorado. The river through town can drop very low in the summer — too low to comfortably raft it at times — as farmers draw water away to grow crops. Here, too, recreational use often holds a lesser legal standing. Water isn’t guaranteed to flow all summer long through this side channel, even in very wet years.
A reach of the Colorado between the large diversion structures that take water off its main channel to its confluence with the Gunnison River has long been a focal point for recreation advocates who want to see more robust flows through town in the summer.
“So, we do have some water rights that are supposed to protect those values, but they’re very junior, and sometimes, sometimes, they come up short,” Holm said.
Hannah Holm of the advocacy group American Rivers stands along a slow meader of the Colorado River in Grand Junction, Colo. on May 13, 2025. (Luke Runyon / The Water Desk)
But much like portions of the Yampa, additional flows happen here for other uses — and recreation just happens to benefit as well. The reach through Grand Junction often is boosted to help endangered fish habitat or to generate hydropower at a nearby plant. That extra water also makes for good floating in rafts, kayaks and tubes. Getting limited water to benefit more than just one type of water user requires cooperation among all of them, Holm said.
Holm says it’s possible for the strained Colorado River, and its main tributaries, to meet multiple needs at once — it just requires all of the different groups who use its water to talk to one another.
“We need to avoid a crisis on the river first of all, because when you get into a crisis, you just, you know, make decisions on the fly,” Holm said. She added that emergency releases from some large reservoirs in 2021 to boost levels at Lake Powell could have been optimized to take place at the height of the summer recreation season or to have environmental benefits.
Abby Burk of Audubon Rockies stands on the banks of the Colorado River in Grand Junction, Colo. on May 13, 2025. (Luke Runyon / The Water Desk)
But even with good cooperation, at a certain point with rapidly changing water levels, river recreators need to take matters into their own hands.
Abby Burk, a kayaker in Grand Junction and a river policy expert with Audubon Rockies, said that since snowmelt causes rivers to rise and then fall, sometimes it’s a matter of matching the vehicle to the flow.
“We see the transformation from maybe getting out on a raft to maybe getting out in an inflatable kayak, and then maybe in really low waters, getting out on a tube and just enjoying your local river at its water level,” Burk said.
In Craig, Kilpatrick said such a mindset is present in the design of the town’s new river park. Even without a specific water right on the Yampa right now, she said she’s confident about making sure it’s fun at all levels, and could spur a whole new recreation-based economy to take off in town.
“It really gives us an opportunity to kind of reinvent ourselves as what we want to be as a community,” Kilpatrick said.
This story is part of a series on river recreation in Colorado, produced by Aspen Journalism, KUNC and The Water Desk at the University of Colorado Boulder.
Early-spring runoff flows through the Roaring Fork River whitewater park in May. The park has been adjusted to make some features safer in higher water. (Heather Sackett / Aspen Journalism)
There’s an old catchphrase that Colorado kayak park proponents used in the early 2000s to sell the idea that keeping water in streams mattered just as much as water for big farms or new housing developments: “The greater the flow, the greater the dough.”
“You would have thought it was an Economics 101 class,” said Glenn Porzak, a Boulder attorney who worked on behalf of the city of Golden and the towns of Breckenridge and Vail to secure the state’s first water rights for recreation.
Some towns saw these recreational in-channel diversions, or RICDs, as a way to boost tourism dollars and spur economic development by drawing kayakers and spectators to a whitewater park. So, giving legal standing and recognition to a growing sector of Colorado’s economy — outdoor recreation — was the argument that legal experts focused on.
“The Golden course started somewhat of a transformation of downtown Golden, bringing people into the downtown area, and so we really went in and talked about the economic benefit,” Porzak said.
Unlike other traditional uses of water that require taking water out of streams — such as irrigated agriculture, cities and industry — a RICD isn’t really a diversion at all. It is meant to keep water in rivers by tying a water right to a manmade river feature, most commonly the waves in whitewater parks.
More than two decades after Porzak helped the city of Golden acquire the state’s first RICD, 21 local governments in Colorado now have water rights for recreation. About half of these towns have built whitewater parks around these water rights. The Town of Vail’s RICD has been an integral part of the GoPro Mountain Games, an early-summer celebration of mountain sports competitions, with four kayaking events in the whitewater park in Gore Creek.
Vail’s RICD, which the town secured through the Eagle River Water and Sanitation District, dates to 2000. Instead of building immovable concrete structures in the river, as many other communities have done, the Vail Whitewater Park has a series of adjustable, inflatable bladders that create waves at different flow levels. The games draw thousands of athletes and spectators to Vail each June. And a popular Tuesday night race series brings kayakers from around the region.
But determining the value that these RICDs — or river recreation in general — bring to the state’s outdoor economy is difficult. According to the Colorado River Outfitters Association, the total industrywide economic impact for 2023, the most recent year for which data is available, was $215 million. But that figure is only from commercial river trips.
“We don’t have good numbers on economic benefit data coming from private use,” said Nathan Fey, former director of the Colorado Office of Outdoor Recreation and former Colorado stewardship director at American Whitewater. “People come from all over the West to spend money on gas and food and beer and ice, and those numbers are never captured in an economic impact report.”
Kayakers paddle down Slaughterhouse Falls on the Roaring Fork River on June 15, 2021. Changes to Colorado water law in the early 2000s gave river recreation advocates a stronger voice in keeping streams flowing. (Heather Sackett / Aspen Journalism)
Protection from future water development
Some say the value of a recreation water right can’t be measured in dollars, but it’s a legal tool that can be used in other ways. One could be to prevent future water development on a particular stream.
For Pitkin County Healthy Rivers, the main goal of securing a RICD water right for two manmade waves in Basalt was always to keep water in the Roaring Fork River.
Boater and retired science teacher Andre Wille has been on the Healthy Rivers board, whose mission is to improve water quality and quantity, since its inception in 2008.
“It is true that we weren’t looking to build a whitewater theme park that was just to draw in boaters,” Wille said. “Our primary goal was to get this water right that would keep water in the Roaring Fork in perpetuity.”
The Pitkin County River Park was one of the biggest and most expensive multiyear projects that the board has undertaken. Keeping water flowing west is an especially important goal for Pitkin County and the communities along the Roaring Fork because about 40% of the river’s flow is taken from the headwaters in what’s known as a transmountain diversion, to be used by cities and farms on Colorado’s fast-growing Front Range.
“The transmountain diversions are one of the biggest threats because of the amount of water that they can divert,” Wille said.
Securing a RICD saves a place in line for recreational water use in Colorado’s system of prior appropriation where the oldest water rights get first use of the river. Therefore, Pitkin County’s RICD could limit how much additional water transmountain diversions can take from the Western Slope in the future because this water is already spoken for.
Pitkin County Healthy Rivers Board member Andre Wille stands on the banks of the Roaring Fork River in May. The county’s recreational water right was an attempt to keep more flowing in the river. (Heather Sackett / Aspen Journalism)
Challenges and limitations
But the road to a RICD hasn’t been easy for Pitkin County. The county has spent more than $3.5 million on the park, an amount that included, among other things, building the waves and then modifying them twice after high flows turned them into dangerous holes that regularly flipped boats.
“We’re doing our best to make it safe,” Wille said. “But at high water, the river changes dramatically, and things that you would never think are dangerous suddenly become dangerous.”
Part of this is simply the unpredictable nature of building concrete features in a dynamic river channel. But it also highlights the limitations of a RICD water right, which must be tied to an artificially constructed wave instead of a naturally occurring rapid or stretch of river. If communities want water for recreation, they must build the costly waves themselves.
“I think the current statute is a bit archaic,” Fey said.
In 2021 and 2022, American Whitewater and other groups twice lobbied the state legislature to expand this narrow definition. First, they proposed tying a RICD to an already existing natural river feature such as a rapid; the next year, they sought to allow municipalities to create a “recreation in-channel values reach,” where they could then lease water to boost flows in the segment during certain times.
These were attempts to adapt the RICD statute to new forms of river recreation — mostly day floats on sections of rivers — that have outpaced the popularity of kayak playboating in whitewater parks.
“The early aughts to, like, early 2010s was where that type of whitewater recreation was popular, this rodeo surf river feature,” said Hattie Johnson, southern Rockies restoration director with American Whitewater. “We’ve seen kind of a big shift away from that.”
But Colorado lawmakers weren’t convinced that the RICD statute should be changed. Both bill proposals failed.
American Whitewater’s Hattie Johnson stands along the Crystal River in May 2025. (Heather Sackett / Aspen Journalism)
In some cases, if a local government wants to secure a RICD, it must also make concessions to future water users by agreeing to allow a certain amount of development before they can exercise their legal authority to call for water. In Pitkin County’s case, officials agreed to allow 3,000 acre-feet of additional water development to cut them in line. That cap was reached in 2024, effectively pushing the county’s priority date back 14 years from when it filed for the rights in 2010.
Fey said these types of “carve-outs,” which allow for future water development, go against the cornerstone of Western water law: the system of prior appropriation, also called first-in-time, first-in-right.
“There is a subordination clause in many of the decrees associated with RICDs,” he said. “That’s a point of contention for a lot of people in the river conservation space that look at RICDs as a tool for long-term protection.”
Besides limiting future water development, the main way a RICD can keep water in rivers is by using its legal authority to force others to stop using water. When a water right isn’t getting all the water to which it is entitled, it can place what’s known as a call and force upstream junior water users to cut back. The problem is there aren’t that many big water rights younger than RICDs — which carry dates from the late 1990s to 2013 — that could cut back enough to make a difference.
None of the 13 RICDs on the Western Slope have ever placed a call, according to the state Division of Water Resources.
“[RICDs] are very, very close to the end of the line, which means all other uses that are more senior to that date get their water first,” Johnson said. “So the utility of a recreational in-channel diversion really comes in to protect that reach of river from further development.”
Are RICDs worth it?
With all these expenses, challenges and limitations of RICDs — and the difficulty of directly quantifying their economic benefit — it’s worth asking whether they have proved worthwhile for the communities that have gone to the trouble of securing them.
Johnson said the real value of RICDs is in giving a voice to the river recreation community. They may be an imperfect tool, but they are an important one. For the first 150 years of Colorado water management, agriculture and cities held all the decision-making power when it came to how water was used. That may be slowly changing as outdoor recreation becomes more important to Colorado’s culture, identity and economy.
RICDs have expanded cultural perceptions of how Colorado’s water is best used, and water for recreation is now an acknowledged beneficial use of a public resource.
“Both the environment and recreation are extreme newcomers to that table, but have a seat now,” Johnson said. “I think RICDs have helped to do that.”
Despite the challenges and limitations of a RICD water right, Wille said building the Pitkin County River Park was still worth the expense to taxpayers. He feels good about the county’s effort to protect river flows as it confronts a warmer and drier future, and water becomes scarcer.
The project also included upgrades to the Fisherman’s Park boat ramp, a new boardwalk and tiers of large streamside boulders where people can lounge or eat lunch next to the waves. The park represents a connection between the community and its local waterway.
“It’s been, I think, a very wise investment and a very good use of our fund that we have for protecting rivers,” Wille said. “That’s one of our goals: to try and acquire water rights and keep water in the river. This is one of the few ways that we’ve been able to do that. So, yes, I think it’s been money well spent.”
This story is part of a series on river recreation in Colorado, produced by Aspen Journalism, KUNC and The Water Desk at the University of Colorado Boulder.
The San Juan River, a major tributary of the Colorado, snakes through canyons in southern Utah. (Mitch Tobin / The Water Desk)
The Water Desk is now accepting applications for grants of $5,000 to $10,000 to support media outlets and individual journalists covering water issues related to the Colorado River Basin.
The deadline for applications is Monday, June 16, 2025, at 11:59 pm Pacific.
This grantmaking program is only open to journalists (freelance and staff) and media outlets.
The Water Desk is interested in supporting a wide variety of media and journalistic approaches: newspapers, magazines, websites, video, television, radio, podcasts and other channels.
The Water Desk will support journalism that focuses on water issues involving the seven states of the Colorado River Basin—Arizona, California, Colorado, Nevada, New Mexico, Utah and Wyoming—as well as the borderlands of Northwest Mexico.
Proposals related to areas that lie outside of the hydrologic boundaries of the Colorado River Basin’s watershed must have a strong connection to the basin and its water resources.
Because water is intertwined with so many issues, we are open to proposals covering a broad spectrum of topics: climate change, biodiversity, pollution, public health, environmental justice, food, agriculture, drinking water, economics, recreation and more.
Funding for these grants comes from the Walton Family Foundation. As a journalistic initiative, The Water Desk maintains a policy of strict editorial independence from our funders, as well as from the University of Colorado Boulder. Funders of The Water Desk have no right to review nor influence stories or other journalistic content that is produced with the support of these grants.
David Hajoglou paddles through the Clear Creek Whitewater Park in Golden, Colorado, on April 21. Recreators hold special legal protections in the state, but some say it’s time for the law to evolve. (Alex Hager / KUNC)
David Hajoglou sat on the rocks next to a rushing stretch of river in Golden, Colorado. As he scouted a kayak route through the riffles and waves, he thought back to the first time he visited this spot, the Clear Creek Whitewater Park, nearly 20 years ago.
“Boy howdy, did it kick my butt,” he said. “I swam a few times. I chased a kayak probably all the way to 10th Street there, whatever the cross street is, and it was just a riot.”
Hajoglou — better known as Hojo in the local kayak scene — has come back to this stretch of Clear Creek more times than he can count since that first rowdy run through the waves. And since then, the park has grown in stature.
It’s a series of rocks strategically placed in the river to create waves, pools and eddies that form a watery playground for kayakers such as Hojo. It holds a legendary status among Colorado’s paddlers and river advocates. This stretch of Clear Creek was the first to receive legal protections that guarantee a certain amount of water will always flow through it. That was the result of a high-profile legal battle nearly 25 years ago.
Those protections gave recreators some legal footing — the same kind of status long held by cities and farms. As a result, they helped put Colorado on the map as a destination for people who want to play in rivers.
That rings true for Hojo and other kayakers.
“The second you get hooked on it,” he said, “you look at this park and you get excited for the prospect of getting on moving water. It’s very addicting.”
In the more than two decades since the courtroom showdown that set up protections for water used by recreators, more than a dozen whitewater parks have been built across the state. Now, river advocates are asking if those protections should change to meet the moment.
Sunbathers and kayakers enjoy Clear Creek Whitewater Park in Golden, Colorado, on April 21. The park was the first in the state to receive protections for river recreation after a high-profile legal battle in 2001. (Alex Hager / KUNC)
Making room for boaters
If you have ever questioned how seriously Colorado takes its water, let attorney Glenn Porzak tell you about the time he went to the Colorado Supreme Court in 2001. He was arguing for the protections that would make today’s Clear Creek Whitewater Park possible
“When I walked in, every seat in the Supreme Court chambers was taken,” he said. “They brought in a whole host of extra chairs. There were people just standing in the aisles.”
Porzak, now a veteran in the Colorado water law scene, was there to push back on the state’s attempt to outlaw recreational water rights. Cities around the state were looking at a sharp rise in the popularity of whitewater kayaking, and they were trying to draw people to their rivers. But first, they needed to make sure the water wouldn’t stop flowing because someone upstream wanted to pull that water away.
The Colorado Water Conservation Board (CWCB) was worried that adding recreation into the already contentious arena of water ownership would upset the status quo.
“They really saw this as a threat,” Porzak said. “You would think, in a state like Colorado, water for these various recreation uses … would be something that the state would really embrace. But I’ve never believed that that was the case.”
Porzak’s side won, enabling a boom of those so-called whitewater parks. If a Colorado city wants to bring kayakers and their money to town, they can throw some big rocks in the river and apply for a “recreational in-channel diversion,” or RICD. Basically, if the river is ever close to flowing too low for boaters, they could have the legal muscle to force upstream users to leave some water in the stream.
Time to evolve
These legal rights are limited in their capacity. They cannot add water to the river. They can tell other users to stop taking water out of the river. An RICD does not necessarily improve river conditions for recreational water users, but it makes sure they don’t get worse in the future.
Basically, it can play defense, but not offense.
Despite that ability to play defense, RICDs rarely flex their legal muscles. In the two and a half decades since recreational water rights holders have had the option to force another user to leave some water in the river, only three of Colorado’s 21 holders have ever done so.
Taking that option is called “placing a call.” The Clear Creek park in Golden did it for about two weeks in 2005. Longmont did it in 2023 and 2024, and Littleton has placed a call for at least a few days every year since 2016. None of the RICDs on the Western Slope have done so.
Kids play in the Poudre River Whitewater Park near downtown Fort Collins, Colorado, on Oct. 20, 2023. Some river advocates say legal protections for Colorado’s rivers should be expanded to include types of recreation that don’t hinge on whitewater features. (Alex Hager / KUNC)
Hattie Johnson, southern Rockies restoration director at the advocacy group American Whitewater, called the RICD designation a “necessary and important first step.”
“I would really like to see the state continue to evolve to really meet the realities of what recreation is like on Colorado’s rivers,” she said. “And I think there’s plenty of room for that evolution to happen.”
Johnson and other river experts think that evolution could happen in a few ways. Most of them have to do with making it easier to get a recreational water right.
Right now, for a nonstate entity to get any kind of water right, there is a legal requirement to divert the river or somehow change the flow of water. That’s why recreational water rights in Colorado are tied to whitewater parks, where rocks are used to modify the river’s course.
Kate Ryan, who has worked in Colorado water law for more than a decade, said putting boulders in the water in order to establish a protected stretch of river “seems like a legal fiction.”
“You just have to do something to the river in order to get a water right,” she said. “That just doesn’t seem practical, and it’s really expensive. I think that could go away.”
These river parks often attract more than kayakers. Visit any one of the stretches of river protected by a RICD and you will probably see swimmers, tubers, toe-dipping sunbathers and the occasional angler.
Those people are able to access protected stretches of river as a convenient side effect of the RICD laws. Ryan, now executive director of the Colorado Water Trust, said protections should be expanded to include a broader definition of “recreation.”
“You can go put your foot in the stream in lots of places,” she said, “But you don’t have a way of preserving that right into the future.”
Ryan and others also suggest lowering the barrier to get a RICD in the first place. Currently, anyone looking to get legal protection for their water needs to go to the state’s water court. That’s a standard practice for any kind of water user in the state – whether they’re hoping to open a kayak park, irrigate crops or send water through their town’s kitchen faucets.
Kayakers gather at the float course in Longmont, Colorado, on May 9. Although legal protections for river recreation are relatively weak now, experts say they will probably get more powerful in the future. (Alex Hager / KUNC)
But there’s an extra hurdle that most types of water users don’t face. Applicants for a RICD also have to answer a long list of questions for the CWCB — the state’s top water regulator.
“We haven’t had RICD applications in a pretty long time,” Ryan said. “So there must be a pretty high bar that’s been established to keep more of the entities who could apply for them from applying for them. … Nobody wants to go to water court for anything. It’s just incredibly expensive and time consuming. I think adding an administrative layer onto that is too much — possibly unconstitutional.”
Saving a spot in line
Despite the relative legal toothlessness of RICDs, river experts say they will get more powerful in the future.
Water law in Colorado and much of the arid West is governed by the concept of “prior appropriation.” It basically means that the first person to use water will be the last to lose it in times of shortage. If you were first in line, your access to a specified quantity of water is almost legally untouchable. People who were granted the right to use water more recently are at the end of the proverbial line and are required to stop using their water first.
RICDs give their owners a place in that line.
Although most RICDs are relatively junior to other users in the state, more new users will probably get in line behind them as time goes on.
The city of Steamboat Springs owns an RICD to protect some popular river recreation spots along the Yampa River. It has never put out a call, but it knows that it might have to if someone new wants to take water from the river.
“I think that the RICD will become a more important tool in the toolbox and an option that the city could potentially exercise in the future,” said Julie Baxter, Steamboat Springs’ water resources manager.
Baxter also pointed out that the RICD will become more powerful if another force removes water from the river: namely, climate change. With less water to go around, anyone with a legal claim to the river will have some added muscle to keep their water flowing.
“I think it will become more important down the road with a hotter and drier future,” she said.
This story is part of a series on river recreation in Colorado, produced by Aspen Journalism, KUNC and The Water Desk at the University of Colorado Boulder. KUNC’s Colorado River coverage is supported by the Walton Family Foundation.
Buckeye, at the western edge of the Phoenix metro region, is the location of a new data center development. (Brett Walton/Circle of Blue)
BUCKEYE, Ariz. – It was supposed to be called Cipriani, a master planned community with more than 9,700 homes at the western fringe of this sprawling desert city in central Arizona.
Plans have changed. One regional growth industry – housing – is being supplanted by another – computing. Even as both carry questions about efficient use of water in one of the driest, fastest-growing areas of the country.
Last August, Cipriani Holdings sold the 2,069-acre land parcel west of the Buckeye Municipal Airport to Tract, a Denver-based data center developer. Instead of housing people, the Cipriani site, now part of the Buckeye Tech Corridor, will incorporate up to 20 million square feet of commercial space to house the cloud.
These are boom times in central Arizona for data centers, particularly in Maricopa County, which is one of the country’s largest data center markets. Factors in its favor, according to Alan Howard, an industry analyst at Omdia, a research firm, include relatively cheap land, tax incentives, low power rates, and proximity to the computing needs of the 5 million people in the Phoenix metro area.
Data centers house the servers and advanced graphics processors that are the foundation of the contemporary internet – and modern life in general. Their purposes range from the small-scale and mundane (storing your beach photos) to the hyperscale and potentially world-changing (training AI models). In aggregate, their power demands and water consumption for cooling have increased exponentially, prompting concerns about the sustainability of data center growth in the Southwest.
Despite the environmental anxieties, there is reason for optimism on water. New data centers are more efficient than older models. Some are using reclaimed water to reduce potable water demand. If the local climate is right, they can use ambient air to cool their servers. Companies like CyrusOne and Microsoft are pioneering cooling systems that consume little or no water in their direct operations, not counting water used to produce their electricity. Though there are tradeoffs involved with energy use, water consumption is increasingly becoming less an absolute constraint and more about the choices companies make.
“I’m far more concerned about energy than water,” said Glenn Williamson, CEO of the Canada Arizona Business Council and chairman of EPCOR Water, a private utility that operates in the state. “For water, we know what we need to do. We just need to pull the trigger.”
New ‘C’ in Arizona’s Economic Geography
The server fervor extends to the highest reaches of government. On January 21, just a day after his inauguration, President Donald Trump hosted a trio of tech industry executives at the White House. Larry Ellison of Oracle, Masayoshi Son of SoftBank, and Sam Altman of OpenAI stood at the president’s side while Trump announced private sector investment in AI infrastructure that could approach $500 billion. For this Stargate Project, he promised the construction of “colossal data centers” to keep America leading the AI race against China.
“I’m going to help a lot through emergency declarations because we have an emergency, we have to get this stuff built,” Trump said.
More and more of this data center “stuff” is being built in Arizona.
School kids learn Arizona’s economic geography via alphabetic repetition. Five C’s were dominant in the state’s early years: cattle, citrus, climate, copper, and cotton. As those industries decline in relative importance, it might soon be time to add a sixth C: computing. Metrics vary, but according to Howard at Omdia, the Arizona data center market is between the fourth and eighth largest in the country. All the big tech companies – Amazon, Google, Meta, and Microsoft – have a presence in the state, as do the less visible names Centersquare, CyrusOne, and QTS.
Arizona encourages the growth of data centers through a sales tax exemption that was approved in 2013. The Arizona Commerce Authority, the regulating agency, says that 64 data centers have received the exemption that covers purchases of hardware and software.
Growth has been accompanied by guardrails. Chandler was the first municipality in the state to regulate data centers. An ordinance adopted in 2022 established siting and noise-reduction requirements, but it did not mention water. The city regulates data center water use through a 2015 policy that limits these facilities to 115 gallons per day, per thousand square feet of space. For additional water needs, the company operating the data center must find an outside source.
Marana, a town 20 miles northwest of Tucson, adopted an ordinance in December that prohibits the water department from supplying data centers with potable water. Companies must find an alternative source and file an application with the town that estimates annual water consumption. No data centers are currently operating in the Marana service area, said Heidi Lasham, the town water director.
In Buckeye, Tract is laying the foundation for a development that could house 40 data centers occupying 20 million square feet at full buildout. Tract’s business model is not to build the data centers, but to acquire land and develop water, wastewater infrastructure, and energy access for the site so that tech companies have a turnkey option for quicker entry into the market.
Tract would not discuss its water plans for the Buckeye development. Graham Williams, chief investment officer, did provide a written statement when asked whether Tract would set water-use requirements for tenants.
“We secure enough water for our sites for a solution that optimizes energy and water use,” Williams wrote. “This is built into our approval process so that our end users are incentivized to maintain these standards since relevant stakeholders have signed off on them.”
In effect, Tract will attempt to balance energy and water demands, since low-water cooling often increases energy consumption.
Terry Lowe, Buckeye water manager, said Tract intends to drill wells on the site to self-supply with groundwater. In the future, he said, Tract will transfer the water system to the city when it no longer wants to be in charge of operating it. A city planning document restricts the site’s groundwater use to 2,000 acre-feet per year.
Tract’s forthcoming groundwater use highlights a loophole in Arizona water law. The state, in 2023, placed a moratorium on new housing developments outside Buckeye whose water source is local groundwater. Existing housing developments that pump groundwater must pay to recharge what they use. Neither provision applies to industrial developments like Tract’s data centers that are located in areas without a renewable surface water supply. This irritates the homebuilding lobby, which complains of unequal treatment.
Amber Walsh, an analyst with Bluefield Research, said that data center water use is a complex topic because of rapid technological change in the industry. Total water demands at present have accelerated, even as individual data centers become more efficient. When viewed nationally, all those drops, in effect, have turned into a flood.
At the state level, data centers are a modest water user, even if they can put pressure on individual utilities. Walsh’s research at Bluefield indicates that data center water consumption in Arizona in 2025 will be roughly 905 million gallons, or 2,777 acre-feet. In the Phoenix area, this is enough water for nearly 10,000 homes annually. It’s less than a tenth of one percent of the state’s annual water use.
Site-specific water data is hard to come by because companies guard the information. Still, researchers and analysts have put together national and regional estimates.
According to Lawrence Berkeley National Laboratory, data centers accounted for 4.4% of U.S. electricity use in 2023, up from 1.9% in 2018. All that power creates heat that needs to be removed. The trend toward hyperscale data centers – the largest of the large, those from the tech titans that are involved in AI computing – has had a similar inflationary effect on water use. Nationally, water consumed in data center operations grew from 21 billion liters in 2014 to 66 billion liters (53,500 acre-feet) in 2023. Indirect water use – the water consumed by the power plants that provide electricity to data centers – amounted to another 800 billion liters.
Sterling Park in Loudoun County, Virginia, is part of the state’s “Data Center Alley,” the country’s largest data center market. (J. Carl Ganter/Circle of Blue)
Water demands are not set in silicon and they involve tradeoffs. They depend on three main factors: type of cooling system, climate conditions, and operational practices. These vary based on location and data center. In favorable climates, using ambient air to cool the equipment results in no water use, but it does require more energy. Evaporative cooling, in which water is the medium for transferring heat, is less energy hungry but consumes more water. Older, water-intensive cooling system designs are being phased out in many places in favor of more efficiency. The Berkeley Lab report, however, notes that the growth of hyperscale data centers using liquid cooling could reverse the efficiency gains.
“Unlike energy, using water to cool a data center is a choice, not a requirement,” according to Alex Setmajer of Equinix, a data center operator. “While all data centers require energy, the decision to use water or not is a decision we make intentionally based on the local climate and long-term sustainability of available water sources.”
Water is becoming a hotter topic in the data center world, but it is still not the main driver for industry decisions, Walsh said. “It’s more or less they select the site that they want and then they’re like, ‘Okay, how can we make whatever water requirements work?’”
For desert areas like Maricopa County, water limits are being met with technological innovation. The eight facilities in the Chandler data center campus operated by CyrusOne do not use water for cooling, and they use a negligible amount overall, only 180,000 gallons a year for humidification. All of the company’s new data centers from 2024 onward will use zero-water cooling.
There are other examples. In December, Microsoft, a computing giant, announced a similar operational innovation for its data centers: a closed-loop cooling system that recycles water, effectively cutting water consumption to zero. The company said in a post on its website that it will pilot the technology in 2026 in data centers in Phoenix and Mount Pleasant, Wisconsin, as it works to make zero-water cooling the “primary cooling method across our owned portfolio.”
The shift to less water-intensive cooling is not without a penalty. The tradeoff is more energy use. Microsoft says this energy increase will be “nominal” due to more efficient cooling equipment. The company declined to respond to questions about how it would implement the new zero-water cooling system designs.
Shutting the Bedroom Door
For Buckeye officials, the Tract development is another step in its rapid demographic evolution. At the turn of this century, Buckeye was a quiet farm town of 8,000 people. Now, it holds almost 120,000. By the turn of the next century, city officials are planning for more than 1 million.
Every weekday morning Buckeye witnesses an exodus. Workers flow out, leaving for jobs elsewhere. City officials reckon that 90 percent of working residents leave town to earn a paycheck, many joining the Interstate 10 caravan east into Phoenix. Peak drive times can be 30 minutes longer than in the off hours.
In the evening, the flow reverses. This is the standard definition of a bedroom community: sleep there, work elsewhere. Eric Orsborn, the mayor, said he wants to change that pattern. Buckeye’s future is aimed at developing not only its residential plots but also its business sector.
The Tract development, though it will generate only a modest number of non-construction jobs, is part of this plan.
“If you’re going to build a city of let’s say 300,000 by 2040, we don’t want everybody leaving the city every day to go to work,” Orsborn said. “So it is one of our highest priorities is to attract those jobs out this way.”
This story was produced by Circle of Blue, in partnership with The Water Desk at the University of Colorado Boulder’s Center for Environmental Journalism.
Lake Powell at Wahweap Marina as seen in December 2021. Dwindling streamflows and falling reservoir levels have made it more likely that what some experts call a Colorado River Compact “tripwire” will be hit in 2027. (Heather Sackett/Aspen Journalism)
Time is ticking for states that share the shrinking Colorado River to negotiate a new set of governing rules. One major sticking point, which has the potential to thrust the parties into a protracted legal battle, hinges on differing interpretations of a few sentences in a century-old agreement.
In a recent letter, the river’s Lower Basin states – California, Nevada and Arizona – asked federal officials to analyze the effects of a hypothetical legal concept known as a “compact call.”
The problem? The 1922 Colorado River Compact says nothing about a compact call. And although the phrase often looms like a threat over Colorado River discussions, there is no agreed-upon definition of the term, what would trigger a compact call nor how one would play out. In fact, the Upper Basin states – Colorado, New Mexico, Utah and Wyoming – don’t believe the laws governing the river even contemplate it.
The February letter comes as water managers from all seven Colorado River Basin states are in the midst of deciding how Lake Powell and Lake Mead will be operated and cuts will be shared after 2026 when the current guidelines expire. In March 2024, each basin submitted competing proposals to the U.S. Bureau of Reclamation. In January, federal officials with the outgoing Biden administration released their analysis of five different potential ways forward and did not include either basin’s proposal, but a “basin hybrid” that incorporated elements from both.
In essence, the Lower Basin states have identified a potential opening with the Trump administration, and asked new leaders at the Interior Department to adopt the Lower Basin’s view on some of the most contentious and disagreed-about parts of Colorado River management.
“I believe that under the law, the compact requires delivery of 7.5 million acre-feet of water on a 10-year rolling average, plus one-half of the Mexico Treaty obligation to the Lower Basin,” said Tom Buschatzke, director of Arizona’s Department of Water Resources. “So we want to see Reclamation, as our request indicated, incorporate that outcome into the modeling for any alternative to look at. That includes how reductions in the Upper Basin states might have to occur.”
Over a century ago, the compact split the river’s water evenly, with half (7.5 million acre-feet a year) going to the Upper Basin and half to the Lower Basin. Another 1.5 million acre-feet a year was later allocated to Mexico.
The crux of the dispute comes from how the Upper Basin states and the Lower Basin states each interpret a key phrase in the compact: “The States of the Upper Division will not cause the flow of the river at Lee Ferry to be depleted below an aggregate of 75,000,000 acre-feet for any period of ten consecutive years…”
To the Upper Basin states, “will not cause” means that their use won’t be the reason the Lower Basin doesn’t get its allocation. They see it as a “non-depletion” obligation.
According to Colorado officials, they’re not delivering water downstream, but rather they’re not causing the flows to be depleted.
“What this means is that if the flows were to drop below 75 million acre-feet over a ten-year period, there would be an inquiry into what caused that to occur,” Michael Elizabeth Sakas, Colorado River communications specialist with the Colorado Water Conservation Board said in a written response to questions from Aspen Journalism.
On the other hand, the Lower Basin states say they’re owed the water, with the Upper Basin states required to send the 75 million acre-feet over 10 years, plus half of the Mexico Treaty obligation (which works out to 82.5 million acre-feet every 10 years) downstream to the Lower Basin.
Colorado River expert Eric Kuhn says that the latest report from the U.S. Bureau of Reclamation is a major caution sign for the basin. An anemic snowpack this past winter could be setting the basin on the road to a compact call (as defined by the Lower Basin). The most recent federal forecast predicts that in 2027, the 10-year cumulative flow at Lee Ferry could drop below 82.5 million acre-feet, a threshold Kuhn calls the first “tripwire” for a compact call.
“If flows were to go below 82.5 million, then that’s the first time, in theory, the lower division states could point to the Upper Basin and say, ‘You’re not complying with your compact obligations,’” Kuhn said. “This is not going to sneak up on us. I think most of the modeling shows that it’s almost inevitable we will drop below 82.5 in the next three or four years.”
But Upper Basin officials disagree. In their interpretation, this tripwire doesn’t exist. A compact call is a concept recognized only by the Lower Basin.
They also point out that calls for water apply to situations where there is a senior rights holder and a junior rights holder. Under the prior appropriation system, the oldest water rights get first use of the river, and senior rights can force junior rights to stop using water so seniors can get the full amount they are entitled to. But Upper Basin officials say there is no priority between the two basins; they are on equal standing.
That may be true, but the three Lower Basin states are also home to the basin’s biggest water users and cities, with more political power than the sparsely populated Upper Basin states.
Navajo Bridge spans the Colorado River downstream from Lake Powell near Lee Ferry, the dividing line between the upper and lower basin. Some federal forecasts predict that in 2027, the flow at Lee Ferry could drop below a critical threshold that some experts call a “compact tripwire.” (Heather Sackett/Aspen Journalism)
River headed for “wildly uncharted territory”
So what would happen if and when the river shrinks enough to trigger the first compact tripwire?
In practice, a compact call could mean the Lower Basin states would sue the federal government to get them to send more water downstream from Lake Powell. (The U.S. Bureau of Reclamation is responsible for making releases from Lake Powell and Lake Mead.) The Lower Basin states could also demand that the Upper Basin states implement cuts to get more water into Lake Powell. But the Upper Basin states will almost certainly argue they are in compliance with the compact and don’t need to make cuts. The Supreme Court could then decide whether the Upper Basin states are in compliance with the compact.
“It’s wildly uncharted territory,” said Chuck Cullom, the executive director of the Upper Colorado River Commision. “It’s not a straightforward path to say: ‘We need you to release more water out of Glen Canyon Dam and curtail uses.’”
The Upper Basin’s argument hinges on what is causing the flows at Lee Ferry to drop. The four states say it’s not their fault, because they only use between 3.5 and 4.5 million acre-feet a year, far less than their allocation of 7.5 million acre-feet. The culprit, they say, is climate change, which according to scientists has contributed to a 20% decline in flows from the 20th century average. They have also shown that every 1 degree Celsius of warming results in a 9% reduction in flows.
With a fixed number for how the river is shared, and a slowly dwindling amount of water available, the Upper Basin has been bearing the brunt of the effects of climate change, a phenomenon that Kuhn calls the “Upper Basin squeeze.” But the climate change argument could open a can of worms.
“There are numerous other water compacts between states,” Kuhn said. “Are we reopening every one of those? It could mean that other states do not have to comply with their compact obligations.That would be a precedent decision that would affect every compact in the western United States.”
How would cuts work?
Water users on Colorado’s Western Slope are eager to know how cuts could play out and over the past few years they have asked state officials repeatedly for more clarity on this issue. One reason is because most of the big transmountain diversions that take water from the mountainous headwaters of the Colorado to Front Range cities date to after the 1922 compact, meaning they would likely be cut first. But as the population centers and economic engines of the state, it’s unlikely a plan to cut water use would include turning off the taps to Denver.
In a crisis situation where cuts are mandatory, the strict prior appropriation system would probably not hold.
“They’re going to have to make hard decisions, and they are going to primarily meet the human health and safety needs of people first,” Kuhn said. “It’s an open secret that the priority system works under normal conditions; it doesn’t work in emergencies.”
Western Slope water users also want to know the state’s plan for cuts, because some areas may be more at risk of forced cutbacks than others. The Yampa/White/Green River basin in the northwest corner of the state, for example, developed later than other places, with lots of more junior water rights. Would they be first on the chopping block?
“We believe that regardless of where things stand on the river, clarity can’t hurt water users,” said Peter Fleming, general counsel with the Colorado River Water Conservation District. “In the long run, clarity will help people to plan better.”
But state officials have been reluctant to provide clarity about how cuts could be implemented, saying now is not the time to plan for it and that the Upper Basin states have always been in compliance with the compact.
“Colorado is not at risk of any compact curtailment scenario in the near future,” Sakas said in a written response to Aspen Journalism. “For the last 20 years, the Upper Basin has been using half of what we are allowed to use under the 1922 Compact while our downstream neighbors use significantly more than their apportionment.”
Figuring out who would be the first to take cuts and tracking that water to the state line would not be an easy task, said Colorado River expert Jennifer Gimbel. Gimbel is the senior water policy scholar at the Colorado State University Water Center and is the former director of the Colorado Water Conservation Board.
“It would be a tremendous headache and a huge undertaking,” she said. “But I don’t know if that means we shouldn’t be doing it.”
The Colorado Division of Water Resources, in a first step, has been developing measurement rules and requiring measurement devices for water users across the Western Slope. According to state officials, the goal of this effort is to accurately measure diversions so that if necessary, Colorado sends downstream only the water that is required to maintain compact compliance and not a drop more.
Trying to stay out of court
One thing most water managers agree on is that finding a seven-state consensus is better than the potentially protracted litigation possible under some kind of compact call scenario. Some are hoping for the best but preparing for the worst. The Arizona Department of Water Resources requested about $1 million last year for Colorado River litigation from the state budget. Buschatzke said the Upper Basin states might fare worse under a compact call than they would by adopting the Lower Basin proposal.
“Because there are a lot of moving parts, litigation — a compact call — is a possibility,” he said. “It’s not a possibility I want to see occur. But I’ll have to do what I have to do to protect the state of Arizona.”
If the states can come up with new guidelines that fairly share the river, the threat of a compact call, which has long hung over Colorado River management discussions, could evaporate like water from the surface of Lake Mead. Cullom said that in 2007 when the seven states implemented the soon-to-expire guidelines that are currently in place, they agreed that if the two basins made good on their commitments outlined in those guidelines, they would set aside the issue of compact compliance — at least until after 2026.
“If they can figure out a way to live within the means of the river in such a manner that both the Upper Basin and Lower Basin agree, hopefully addressing a compact call again won’t be needed because it’s been addressed,” Gimbel said.
This story was produced by Aspen Journalism, in partnership with The Water Desk at the University of Colorado’s Center for Environmental Journalism.
Sleepy Bear Mobile Home Park resident Renee Hoffman washes dishes at her kitchen sink on January 21, 2025. After learning that her neighborhood water system is contaminated with PFAS, Hoffman started to distrust her tap and stopped using tap water for most household purposes. After washing the dishes, she carefully wipes them down, out of an abundance of caution. (Rae Solomon/KUNC)
Renee Hoffman was never thrilled about the water quality at her house in Sleepy Bear Mobile Home Park on the outskirts of Steamboat Springs.
“It just didn’t taste great,” she said. “It had that kind of calcium buildup and stuff.”
But one day in 2023, she got a letter from the mobile home park management that made her distrust her tap in a whole new way.
“This drinking water notice came through, telling us that there was PFAS in the water,” she said.
Polyfluoroalkyl Substances, or PFAS, are a class of compounds sometimes called “forever chemicals” because they don’t break down naturally in the environment.
“PFAS are ubiquitous,” said Zach Schafer, director for policy at the Environmental Protection Agency’s Office of Water. “They’re used in countless products that we use every day, whether it’s nonstick cookware or waterproof clothing. It’s used in stain resistant carpets. It’s used in firefighting foam. And it’s very useful, which is why it’s been used since the 1940s.”
But PFAS are also very harmful. Exposure to even a small amount of some PFAS compounds, like Perfluorooctanoic acid, or PFOA, and Perfluorooctanesulfonic acid, or PFOS, can disrupt immune response, liver and thyroid function and cause heart disease and cancer. They can also affect developing fetuses.
“We’re increasingly learning that some PFAS that we’ve studied a great deal have pretty serious adverse health effects at very, very low levels,” Schafer said. “Based on the latest science, there really is no safe level in drinking water.”
The notice that Hoffman received included information from the Colorado Department of Public Health and Environment informing her that the shallow water well supplying her small neighborhood had tested positive for PFOA and PFOS and warning about the potential health impacts of exposure.
“I almost threw it out,” she said. “But I’m glad I opened it, because I wouldn’t have heard of it any other way.”
The shallow well at the Sleepy Bear Mobile Home Park on the western edge of Steamboat Springs sources water from the Yampa River to supply the 54-lot neighborhood. The water system tested positive for PFAS in 2023. (Rae Solomon/KUNC)
The letter offered some recommendations for reducing exposure but stopped short of telling residents to stop drinking their tap water, “as current health advisories are based on a lifetime of exposure.”
That did little to reassure Hoffman that the water was safe for her family.
“We stopped giving it to our animals, stopped using it to cook noodles and things like that. We just stopped using it altogether,” she said.
New drinking water standards
Last year, the EPA created new drinking waterstandards that limit PFOA and PFOS to less than 4 parts per trillion, which is the smallest concentration tests can reliably detect. But PFAS have already worked their way from industrial sources into drinking supplies across the country. The EPA estimates between 6 and 10 percent of the nation’s utilities are contaminated. They have until 2029 to fix the problem.
“We are going to save thousands of lives, prevent tens of thousands of avoidable illnesses, and reduce the levels of PFAS in more than 100 million people’s drinking water nationwide,” Schafer said.
The new rules will require all water systems across the country to start monitoring PFAS by 2027. But some states are ahead of the curve. The Colorado Department of Public Health and Environment launched a free, voluntary testing program in 2020 and state officials report that so far, about two-thirds of the state’s water utilities have opted in.
Through that program, the state has already identified 29 water systems, in communities large and small, with a PFAS problem that needs to be addressed.
For the most part, the point of contamination remains a mystery and public health officials are more focused on removing the chemicals than discovering their source.
“Rarely can we trace the levels we detect in drinking water back to specific sources of PFAS contamination,” a CDPHE representative wrote in an email. “Our focus is to help our public water systems assess PFAS levels in their drinking water and reduce exposure.”
The good news, according to Schafer, is that the technology to remove PFAS from drinking water already exists and is readily available.
“Those include activated carbon ion exchange and reverse osmosis,” he said.
But for some utilities, it might make more sense to reduce their reliance on or to simply stop using a contaminated water source.
“Depending on the specific characteristics, the size and the needs of a water system, they can choose how to meet the standard,” Schafer said. “It’s going to vary based on what PFAS are in their water, at what levels, and what the design of the water treatment system already is. So, it really isn’t going to be a one-size-fits-all approach.”
Costly fixes for small water systems
No matter the approach, dealing with PFAS contamination is bound to be a major undertaking. According to John DeGour, regulatory affairs specialist with the National Rural Water Association, smaller communities are likely to find it a struggle.
“You have to pay for sampling, you have to install treatment if necessary, or find a new source,” he said. “But if you’re a small system, you obviously have less resources to do that.”
When PFAS turned up in one of the wells supplying rural Keenesburg, on Colorado’s Eastern Plains, public works director Mark Gray was surprised.
Well 11, one of several wells supplying water to rural Keenesburg, Colo. from the Lost Creek Alluvial, first tested positive for PFAS contamination in 2019. The small water system serving about 860 users has until 2029 to reduce PFAS levels to new federal standards adopted last year. (Rae Solomon/KUNC)
“I never anticipated us to have any PFAS in our wells,” he said. “It’s the biggest problem we have. It’s the only problem we have.”
His first instinct was to look for ways to pay for potentially expensive fixes.
“We have made applications to every grant available — grants for engineering, grants to build filtration. We are very actively looking at everything that’s available to us,” Gray said.
Congress set aside billions in the Bipartisan Infrastructure Law of 2021 to address PFAS in drinking water. That includes $6 billion specifically for small and disadvantaged communities. According to the CDPHE, Colorado has already received $31 million out of a promised $189 million for PFAS remediation. But with a cloud of uncertainty over how the new Trump administration plans to dole out federal funds, it’s suddenly unclear whether and when the balance will ever reach its intended users.
It’s still too soon to know which PFAS removal approach will be right for Keenesburg, or what the price tag will be. And while any grant funding that is made available can help cover the initial costs, utilities will ultimately be on the hook for the cost of ongoing operations.
“We’re being tasked from the EPA to try to come up with an almost impossible standard,” Gray said. “You almost have to anticipate the increased cost in treatment.”
Those increased costs will likely raise the rate that consumers pay for water. But utilities will have little choice.
“We’re a small town and we’re one of the few communities that provides its own water,” Gray said. “We want it to be safe.”
As for the Sleepy Bear Mobile Home Park, the easiest solution just might be to abandon the neighborhood well altogether and tap into the municipal system in Steamboat Springs.
Renee Hoffman no longer gives her dog and cats tap water after learning that the local water system contains PFAS. Now she hauls in extra filtered water from a private treatment plant down the road. (Rae Solomon/KUNC)
“We support that and we want to work with Sleepy Bear to make that happen,” said Steamboat Springs water distribution and collection manager Michelle Carr. “It’s really just a matter of figuring out the logistics.”
Those logistics would have to include extending the city water main westward, a project Carr said the city has already planned and budgeted for as they eye future developments on the city’s western edge.
But even that could come at “significant cost,” according to Thomas Morgan, manager of KTH Enterprises, which owns Sleepy Bear Mobile Home Park. Via text message, he wrote that he has been meeting with city officials, “to see if costs and requirements could be lessened.”
Indeed, there might be some appetite among city council members to subsidize a connection to the city water system for the mobile home park, “because of their interest in supporting affordable and low-income housing,” Carr said.
But from resident Renee Hoffman’s perspective, the park management needs to make clean water a priority, whether or not those subsidies come through.
”There’s a lot of young kids here,” She said. “To think that they were drinking that water from infancy — what levels they might have in their bodies.”
And she just wants her family to be able to do normal things again, like brush their teeth and wash the dishes without worrying that the water could make them sick.
“Nobody wants their rent to be raised, right?” she said. “But if we were to secure a better water source for our long-term health, I think you just have to weigh the benefits of it and ante up, I guess.”
This story was produced by KUNC, in partnership with The Water Desk at the University of Colorado’s Center for Environmental Journalism.
Buckeye, Arizona, has plans to become one of the Southwest’s largest cities in the next decades. (Brett Walton/Circle of Blue)
BUCKEYE, Ariz. – Beneath the exhausting Sonoran sun, an hour’s drive west of Phoenix, heavy machines are methodically scraping the desert bare.
Where mesquite and saguaro once stood, the former Douglas Ranch is being graded and platted in the first phase of a national real estate developer’s gargantuan plan that foresees, in the next few decades, as many as 100,000 new homes to shelter 300,000 people. In late October 2024, dozens of trees, salvaged from the land and potted as if they had just arrived from the nursery, watched over the quiet construction zone.
This remote site in western Maricopa County, between the stark White Tank Mountains and frequently dry Hassayampa River, is the location of Teravalis, the largest master planned community in Arizona and one of the largest in the country. It is part of a constellation of roughly two dozen master planned communities in the area – with names like Tartesso, Festival Ranch, Sun City Festival, and Sun Valley – that could propel upstart Buckeye in the coming decades to one of the largest cities in the Southwest. Buckeye planning documents anticipate a city population later this century between 1 million to 1.5 million if all the master planned communities are fully built out.
The Phoenix metro area is expanding ever outward, riding the decades-long wave of a nationwide redistribution of people toward warmer, sunnier states. That population growth – the state added nearly 1.2 million people in the last 15 years – has driven up home prices and pushed single-family home buyers into lands farther removed from the center. Buckeye is about as far removed as it currently gets.
All the while, the state’s water supply has declined. The Colorado River, shrinking due to a warming climate, has been in shortage condition since 2022, a situation that has cut Arizona’s allocation from the river by at least 18% annually. Groundwater, which has nurtured Buckeye to this point, is no longer sufficient for new growth in the area, the state says. Arizona Department of Water Resources decisions in 2023 about groundwater availability in the region sent shockwaves through the housing industry, halting new subdivisions in Buckeye and certain other locations around Phoenix that would have used local groundwater. The decisions affected only proposed developments that had not yet received permits to pump groundwater.
“We’re in an era of limits,” Tom Buschatzke, director of the Arizona Department of Water Resources, reiterated during a January 16, 2025, meeting to discuss new policies that could unlock homebuilding in the area. The Arizona Municipal Water Users Association echoed that sentiment weeks earlier: “Arizona’s future is not secure if we continue to depend only on groundwater.”
The Home Builders Association of Central Arizona, an influential trade group, reckons that 200,000 homes in the greater Phoenix area for which builders thought they had sufficient water are now in limbo. On January 22, 2025, the association announced a lawsuit against the state over its restrictions on groundwater use that have held up home construction.
Howard Hughes Holdings, the national real estate company that is developing the 37,000-acre Teravalis site, has secured water for only the first 8,500 homes, some of which are scheduled to be ready by next year. Where will the rest of the water come from? Deals could be made with nearby tribal nations to lease their senior rights. Ag land could be bulldozed and the water given over to housing. Wastewater can be cleaned up and reused. Groundwater could be pumped from designated “transport” basins from which water can be moved outside its natural watershed. Many options are on the table – even a farfetched pipeline carrying desalinated water from Mexico – but they require delicate political negotiation, wads of money, or both.
The exurban growth is a clash between Old Arizona, with its cotton fields and cattle ranches, and New Arizona’s subdivisions and silicon chip manufacturers. In Buckeye, the two eras often occupy adjacent parcels, each representing different ways of irrigating the Arizona Dream. Behind all the political maneuvering is one overriding question: How should Arizona’s limited water be used?
Growing Pains
Until this century, Buckeye was a tiny farm town known for its cotton fields and rodeo. Its story since then has been one of audacious growth. In the last 25 years, the number of residents has climbed from roughly 8,000 to now almost 120,000. And that’s just the start.
The Buckeye Planning Area, designated by the city, encompasses 639 square miles. Phoenix, by comparison, spreads across 519 square miles. Not all of the Planning Area is within the current Buckeye city limits, but city officials do anticipate that those lands, prior to development, will be incorporated in order for them to access city services. At present, just 15% of the Planning Area is developed and the city boundaries are a patchwork of annexations.
“Water and infrastructure are really the two most significant challenges I think that we have moving forward,” said Eric Orsborn, mayor of Buckeye.
Orsborn, an enthusiastic municipal booster who owns a construction business, knows the importance of the homebuilders. “You’re the fuel that helps us grow,” Orsborn told a representative from the Home Builders Association of Central Arizona at a Buckeye City Council meeting on October 15, 2024.
Because of its farming history, Buckeye is latticed with irrigation canals. (Brett Walton/Circle of Blue)
To understand the current brouhaha over housing development, turn back the clock 45 years. At the time, groundwater extraction was so rampant that the land surface was sinking and wells were going dry. The state needed to rein in its use. Lawmakers did so through the Groundwater Management Act of 1980, which established four “active management areas,” or AMAs, in which groundwater would be regulated. Now there are seven AMAs. Municipalities in the AMAs could become “designated water providers” if they proved a 100-year renewable supply of water such as treated wastewater or a surface water source like the Salt River or Colorado River, which began to be delivered to the Phoenix area via the Central Arizona Project canal in 1985.
Buckeye, because it still relies almost exclusively on groundwater, is one of the few cities in the Phoenix AMA that is not a designated provider. This has consequences. The city’s three water providers pump groundwater and residents pay the Central Arizona Groundwater Replenishment District, a state-created agency, to recharge a portion of that pumping. Meanwhile, commercial and industrial users, which are not subjected to the same groundwater restrictions as residential customers, are allowed to build and pump without replenishment. The city has recently welcomed distribution centers from the retailers Five Below and Walmart. But Buckeye is not allowed to pump more groundwater to serve new outlying subdivisions. Instead, master planned communities like Teravalis that are located in an AMA are responsible for securing their own water and proving a 100-year renewable supply. This is called a certificate of assured water supply.
Until recently, local groundwater sufficed for these certificates. Howard Hughes will be using groundwater for Floreo, the 8,500-unit first phase of Teravalis that is now under construction. But at the moment water supply for the rest of the project and for other projects around it in the Hassayampa basin are in doubt because of a state determination in 2023 that local groundwater is insufficient and cannot be used for a certificate of assured water supply. The Home Builders Association of Central Arizona disputes the modeling that informed the decision, and filed a lawsuit on January 22 to reverse it.
In parallel, state lawmakers and water officials are attempting to promote workarounds that would appease homebuilders and cities like Buckeye and allow limited groundwater pumping in the short term, but also protect long-term groundwater sustainability in the AMAs.
One option, which has already been approved by the Gov. Katie Hobbs, provides places like Buckeye a way to become designated providers while still pumping groundwater in the interim. Buckeye leaders and representatives for the master planned communities initially objected to stipulations in the program that they felt required them to give up too much water for too little benefit. Nonetheless, Buckeye has now committed to applying for this ADAWS program.
The second consideration is a voluntary program to incentivize the conversion of farmland to housing. These discussions were initiated after Gov. Hobbs vetoed a bill on the topic last year because she felt the ideas needed more vetting. The intent is two-fold, said Tom Buschatzke of the Department of Water Resources: allow more housing to be built but also secure a long-term reduction in groundwater use by facilitating what has already been taking place in the state in the last century. The ag-to-urban concept would not help places like Teravalis, which is being built on desert land north of I-10, not former farmland. And there are still big unanswered questions about how much water could be given over to housing, how much would need to be replenished underground, which lands would qualify, and where the water could be used.
Billboards in Buckeye advertise new homes for sale. (Brett Walton/Circle of Blue)
Grady Gammage Jr., a lawyer at the Phoenix-based firm Gammage & Burnham who works at the intersection of real estate development and water supply, called the current groundwater situation a “logjam.” In his view, what’s needed is a compromise that allows for some groundwater use now with an assurance to build the expensive infrastructure to bring in an alternative water source down the road to fill the gap.
“One of the things that I think somebody needs to take the lead in thinking about is the big picture infrastructure solutions,” Gammage Jr. said.
Those discussions will take some time because state officials do not want to rush the process, said Patrick Adams, the governor’s water policy adviser. “We want there to be consensus, bipartisan work, and really rigorous analysis on these pretty impactful water policy program changes.”
Water-Efficient Designs
What gets built determines water use. New housing developments in Arizona require less water than their predecessors because of landscaping changes, said Spencer Kamps, vice president of legislative affairs for the Home Builders Association of Central Arizona. Xeriscaping – employing desert-native vegetation – is the norm, both through changes in code and changes in culture. To mimic a lawn aesthetic, some homes in new subdivisions have patches of artificial turf in front of the house. But turf grass is out.
Outdoor use is the biggest factor for a residential development’s water footprint. The dry desert air vacuums moisture from the ground and turf grass lawns are relatively thirsty embellishments. Terry Lowe, Buckeye water director, said that about 60% of the city’s residential water is used outdoors.
Many new developments in the state share a defining trait: they are built atop former farm fields. The replacement of crops with cul-de-sacs has helped moderate water use, which is less today than in the mid-1950s, when only a million people lived in the state.
Howard Hughes is pitching Teravalis as a continuation of this trend toward environmentally conscious development, though it is being built in the desert, not on formerly irrigated fields. A slide deck for investors notes the company’s intention to be “one of the leading sustainable MPCs in the nation with a strong focus on environmental awareness and innovative technology.” Its promotional materials advertise water-efficiency goals of 35% below the state average water use per person. There will be limits on pool size and covers required to reduce evaporation when not in use. Wastewater will be reclaimed and recycled for park irrigation. Howard Hughes representatives declined to be interviewed for this story or to respond to written questions about their water use and development plans.
Before sunrise in mid-October, roosters crow and nail guns can be heard in the distance. Construction workers are already at the job site on a day in which the temperature will exceed 100 Fahrenheit. (Brett Walton/Circle of Blue)
Achieving these goals requires help. Building decisions are a three-partner dance between developers, homebuilders, and municipalities. Developers like Howard Hughes are responsible for the big capital investments: buying land, acquiring water, and installing streets, sidewalks, and drainage. This is all the “horizontal” infrastructure.
Once these assets are in place, the “vertical” stage – homebuilding – can begin. Developers offer blocks of the platted land to established companies like Lennar, KB Home, Brightland, and Century Communities. These homebuilders follow local and state codes, as well as developer preferences, which can be stricter than code requires, Kamps said. In the case of Teravalis, Howard Hughes will set the water use goals and homebuilders will follow the lead.
That guidance from Howard Hughes is not yet available, according to one of the seven companies selected to build homes there. Jill Ebding of Courtland Communities said that Howard Hughes has not told them final water-efficiency design guidelines.
“We can submit a house plan with just four walls, a roof, and a foundation – here’s our floor plan,” Ebding said laughing. “But we haven’t set up anything with landscaping or anything additional like that.”
Will the designs in the Floreo phase of Teravalis be substantially different from what is already on the market? Ebding did not think so, at least not from Courtland Communities.
Road to Somewhere?
The road to Teravalis, at exit 109 from I-10, is named Sun Valley Parkway. Built by private investors in the late 1980s, the road was a lonely speculation that one day people would move here. Expected growth did not happen immediately. “It was like a road to nowhere that was great for biking, was great for truck driving schools going out and practicing and training,” Orsborn said about the parkway’s early years.
Teravalis, a project of Howard Hughes Holdings, a national real estate developer, envisions 100,000 homes in the desert north of Buckeye — if the company can find water for them. (Brett Walton/Circle of Blue)
Sun Valley is still, by and large, a lonely road. Tartesso is out this way, at the southern end, closest to central Buckeye. At the northern end, where the road loops east around the White Tank Mountains in the direction of Phoenix, is Sun City Festival. In the middle, miles from any habitation, is the blank slate of Teravalis and the outlines, in planning documents, of a half dozen other master planned communities. Gammage Jr. said that, due to the vagaries of real estate development, not all the housing units approved by the city will ultimately be built. But many will.
Such growth has been the history of Arizona since statehood: defying watershed limits while engineering solutions to fill the supply gap. Cities, meanwhile, have expanded farther into the desert and tapped increasingly distant water sources. New water sources will not be cheap water sources. Knowing this, Orsborn looks at future growth as a challenge to be met step by step.
“We don’t have to solve water for the entire 1 million people today,” Orsborn said. “We can do this incrementally and come up with the water needs for the next 10 to 20 years.”
If local groundwater is no longer available, the next chapter of growth in Buckeye will have to come from a creative alignment of finance, policy, technological innovation, and deal making – the New Arizona mix that sees a road in the desert and thinks it can lead somewhere.
Editor’s note: This article has been updated to reflect that Buckeye will apply for the state’s Alternative Designation of Assured Water Supply (ADAWS) program.
This story was produced by Circle of Blue, in partnership with The Water Desk at the University of Colorado Boulder’s Center for Environmental Journalism.
The Water Desk is excited to announce the participants for the Rio Grande Journalist Training and Workshop, taking place in Albuquerque, New Mexico, in January 2025.
This training program will bring together journalists dedicated to enhancing coverage of water issues along the Rio Grande, fostering collaboration among news outlets and deepening understanding of critical challenges facing the region.
The Rio Grande flows from the Rocky Mountains of Colorado, through New Mexico and Texas, while forming the U.S.-Mexico border. Like many Southwestern waterways, the river has been ravaged by a more than two-decade-long dry spell made worse by climate change. Coverage of the communities and ecosystems dependent on the Rio Grande is essential to understanding what’s at stake as the gap between water supply and demand widens.
The Water Desk selected 14 journalists to participate in the training, reflecting diversity in geography, race, ethnicity, gender and medium.
Participants:
Spenser Heaps, Indepdendent
Catherine Jaffee,Independent
Elizabeth Miller,Independent
Jeremy Miller,Independent, contributing writer, Sierra Magazine
Caitlin Ochs,Independent
Danielle Prokop,Source NM
Martha Pskowski, Inside Climate News
María Ramos Pacheco, The Dallas Morning News
Elliot Ross, Independent
Nadav Soroker, Searchlight New Mexico
Ishan Thakore, Colorado Public Radio
Caroline Tracey, Independent
Emery Veilleux, The Taos News
Christian von Preysing, KRGV-TV
As part of The Water Desk’s training program, participants will hear from legal experts, water users and tribal members along the Rio Grande to hear varying perspectives on how the river is a key part of the region’s cultural, political and geographic landscape.
The workshop will feature expert-led sessions on the complexities of water management and opportunities to network with peers and regional water experts. The Thornburg Foundation, a Santa Fe-based family foundation, is providing the financial support to make this training possible, while the program is the sole responsibility of The Water Desk.
The site where Ute Water plans to build Owens Creek Reservoir at 8,200 feet on the Grand Mesa was snow covered by mid-November. The Western Slope’s largest domestic water supplier has conditional water rights for the 7,000-acre-foot reservoir. Photo: William Woody
Just add waterThe site where Ute Water plans to build Owens Creek Reservoir at 8,200 feet on the Grand Mesa was snow covered by mid-November. The Western Slope’s largest domestic water supplier has conditional water rights for the 7,000-acre-foot reservoir. William Woody
Nearly two hours east of Grand Junction on a remote dirt road on the Grand Mesa is a nondescript, shallow, sage-brush-covered valley where two creeks meet.
The site, at 8,200 feet in elevation, is home to a wooden corral where ranchers with grazing permits gather their livestock and to the Owens Creek Trailhead where hikers set out for nearby Porter Mountain.
It’s also the spot where the largest domestic water provider on Colorado’s Western Slope plans to someday build a reservoir. The proposed Owens Creek Reservoir is modest in size, at about 7,000 acre-feet. It would help Ute Water Conservancy District satisfy the needs of its 90,000 customers into the future.
“Our job as a water provider is never done,” said Greg Williams, assistant manager at Ute Water. “You can develop one and you move onto your next project and go through that same process.”
Ute Water Assistant Manager Greg Williams, left, stands at the site of the proposed Owens Creek Reservoir on the Grand Mesa. Cities across the state have conditional water rights that save their place in line while they work to develop projects. William Woody
In most cases, water in Colorado must be put to beneficial use to keep a right to use it on the books. The cornerstone of Colorado water law is the system of prior appropriation, where the oldest water rights get first use of rivers. And hoarding water rights without using them amounts to speculation, which is illegal. But a Colorado water law feature known as a conditional water right allows water-rights holders to skirt this requirement and hold their place in line. The conditional water rights for the proposed Owens Reservoir date to 1972, although work to build this particular reservoir appears limited to preliminary studies and work on other related components of Ute Water’s system.
Ute Water, along with many other cities, conservancy districts and oil and gas companies across the Western Slope, are hanging on to water rights that are in some cases a half-century old without using them. Conditional water rights allow a would-be water user to reserve their priority date based on when they applied for the right, while they work toward eventually using the water. The result is millions of acre-feet worth of conditional water rights on paper that have been languishing for decades without being developed. Some of these rights are tied to large reservoir projects.
An analysis by Aspen Journalism found that across Colorado’s Western Slope, cities, conservancy districts, fossil fuel companies and private entities hold conditional water rights that would store about 2.6 million additional acre-feet from the Colorado River and its tributaries in not-yet-built reservoirs each bigger than 5,000 acre-feet. This is a staggering amount of water storage and more than the entire state of Colorado currently uses from the Colorado River basin, which is about 2.1 million acre-feet a year.
Most of this water would be stored in not-yet-built reservoirs, each bigger than 5,000 acre-feet. In some cases, the water would be stored in already-existing reservoirs, using conditional rights that would allow the reservoir to be refilled or enlarged.
Ute Water has plenty of company among the state’s conditional water rights holders. The Glenwood Springs-based Colorado River Water Conservancy District has rights from 1972 for the 66,000-acre-foot Wolcott Reservoir on Ute Creek in Eagle County; Mountain Coal Company says it wants to build the 75,000-acre-foot Snowshoe Reservoir on Anthracite Creek near Kebler Pass with rights from 1969; and Denver Water has plans for the 350,000-acre-foot Eagle-Colorado Reservoir on Alkali Creek in Eagle County using water rights from 2007. These are just a few examples of the 94 conditional water rights for new and existing reservoirs of 5,000 acre-feet or more planned for western Colorado identified by Aspen Journalism.
The 1922 Colorado River Compact promised 7.5 million acre-feet to the Upper Basin, which so far has never come close to using its half. The state of Colorado has the right to use 51.75% of the Upper Basin’s allocation.
In a way, this planned water development represents the hopes and dreams for the future growth of the Colorado River’s Upper Basin states — Colorado, Wyoming, Utah and New Mexico. The 1922 Colorado River Compact promised 7.5 million acre-feet to the Upper Basin, which so far has never come close to using its half. The state of Colorado has the right to use 51.75% of the Upper Basin’s allocation.
But some experts say these proposed reservoirs are unrealistic wishes of the past, a vestige of the mid-20thcentury frenzy of dam building across the West that is mismatched for 21st century conditions. They say if this scale of future development comes to pass, it would upend the system of water rights, as well as harm the environment. They say the water court system that keeps these phantom reservoirs alive is being abused and should be reformed. In the era of historic drought, climate change and crashing reservoir levels, where users already see shortages in dry years, some say this amount of water for new development simply does not exist.
The Colorado River flows past a golf course near Parachute. Cities, conservancy districts, energy companies and private entities have conditional water rights for 2.6 million acre-feet of water to be stored across the Western Slope. William Woody
The Upper Basin’s dreams of water development also highlight a central tension at the heart of the current disagreement between the Upper Basin and the Lower Basin states of California, Arizona and Nevada. The two sides have not been able to reach an agreement about how the river’s two largest storage buckets, Lake Powell and Lake Mead, should be operated in the future and how cuts should be shared in drought years. Negotiations are currently at an impasse.
“If all these water rights were developed, it would be a disaster. I think everybody understands that.”
Mark Squillace, a natural resources law professor at the University of Colorado Boulder
Over the past 100 years, the Lower Basin has fully developed its share of the river and then some. The Upper Basin has not, but it believes it is still entitled to, despite the contradictory nature of both committing to conservation while holding on to plans for new future uses.
“It’s especially a problem when we’re trying to find more water to reduce the amount of depletion on the Colorado River,” said Mark Squillace, a natural resources law professor at the University of Colorado Boulder. “If all these water rights were developed, it would be a disaster. I think everybody understands that.”
Holding on to conditional rights
The Colorado River meanders through the Grand Valley, where it turns peach orchards and alfalfa fields green. Ute Water, the largest domestic water provider on the Western Slope, plans to build additional reservoirs to serve its Grand Valley customers. William Woody
Entities can’t just hang on to conditional water rights in perpetuity. To maintain a conditional right, an applicant must every six years file what’s known as a diligence application with the state’s water court, proving that they still have a need for the water, that they have taken substantial steps toward putting the water to use and that they “can and will” eventually use the water. They must essentially prove they are not speculating and hoarding water rights they won’t soon use.
A cottage industry has sprung up around these diligence filings. Engineering firms produce studies that show a conditional water rights holder has worked to develop the water right. Attorneys file diligence applications with the water court and then see them through the sometimes yearslong process to get it renewed for another six years.
Aspen Journalism’s analysis looked at only the biggest proposed reservoirs on the Western Slope, but every year, hundreds of diligence applications are filed statewide for smaller amounts of water.
And the bar for proving diligence is low.
“It’s only limited by the imagination of the lawyer who’s filing the application about what you can claim for diligence,” said Aaron Clay, a longtime water attorney and water court referee in the Gunnison River basin, who teaches community courses about the basics of water law across the Western Slope.
The standard for reasonable diligence is much lower now than it was decades ago, Clay said, because state officials want at least some of these reservoirs to be built. The thinking is practical and political: Building more reservoirs makes it easier to control the timing and amount of water Colorado lets flow downstream.
Water court judges are hesitant to abandon these conditional water rights, even if they have been languishing without being used for decades partly because in Colorado water is treated as a fully vested property right, where the state may have to compensate water rights holders if they take it away from them. And owners of these rights believe they are valuable and are reluctant to let them go. The status quo is maintained because there’s no incentive for anyone to scrub these unused water rights from the books.
Water court judges are hesitant to abandon these conditional water rights, even if they have been languishing without being used for decades.
Some entities, such as Ute Water, have conditional water rights for several reservoirs, pipelines, pumping stations and other components of an integrated system. Applicants are not usually required to file separate diligence applications for each of the system’s components. For example, in Ute Water’s most recent diligence filing for Owens Reservoir, the conservancy district filed a combined application for 14 different components of an integrated system. The application, filed in August and still pending in Division 5 of water court, claims that work on one feature of the system constitutes reasonable diligence on all the features of the system.
Municipal water providers such as Ute Water are given special deference under Colorado water law through something called the Great and Growing Cities Doctrine.
“The standard for diligence for a municipality is even lower,” Clay said. “We’re going to give them a little leniency with diligence by saying if you can still show us you’re going to need that water 30, 40, 50 years from now and you’re doing something toward it — studying it, working on the environmental issues or whatever — that’s going to be enough diligence to get you by for another six years.”
Owens Reservoir is just one of several Ute Water plans to develop. Williams said they are currently working to enlarge Monument Reservoir No. 1 and will then explore building Buzzard Creek Reservoir, Willow Creek Reservoir and Big Park Reservoir, all on the Grand Mesa.
“It remains to be seen the timing of when those reservoirs would be developed,” Williams said. “But our intent would be to continue developing each one of those sources.”
Squillace said that although he understands cities may need more leeway when it comes to long-term water planning, there is a lot of abuse of the conditional water rights system. The state water courts should be tougher on denying claims of diligence and stop granting extensions to water rights that haven’t been developed despite having had decades to do so, he said.
“You’re not supposed to sit on them for 20, 30, 40 years before you develop them,” he said. “It’s the failure of the state water courts to take diligence requirements seriously. They just apparently seem to give out these extensions of water rights without a whole lot of showing that there’s actually any kind of diligent work toward developing the water. I think it’s a huge problem.”
Uncertainty hangs over decades-old proposed reservoirs
Smaller proposed reservoir sites are scattered across Grand Mesa in western Colorado, and are underpinned by decades-old conditional water rights. William Woody
One way in which these conditional water rights could present a problem is the uncertainty they create for the state’s other water users, especially those who have put their water to use in the past 60 or so years.
Andrew Teegarden is a fellow at the Getches-Wilkinson Center for Natural Resources, Energy and the Environment at the University of Colorado School of Law. The University of Denver Water Law Review plans next fall to publish his paper “Uncertain Future: How Conditional Water Rights Have Created Unintended Consequences in Colorado.” When the owners of conditional water rights with older priority dates finally begin diverting water that they have not used for decades, they may cut off junior water users who began using water between the conditional right’s older date and the present day. Teegarden calls this “line-jumping,” and if all these proposed reservoirs were developed, it could upend the entire priority system.
If all these proposed reservoirs were developed, it could upend the entire priority system.
The solution, he said, is for Colorado to stop treating conditional rights as property rights. Lawmakers could also reform diligence standards and impose a strict time limit, such as 50 years, for applicants to put their water to beneficial use. Otherwise, these conditional rights should be abandoned.
“Clearly, the history and precedent surrounding conditional rights were well-intentioned on giving users within the system flexibility to implement large-scale projects and the security to hold their place in priority,” the paper reads. “These rights, though, come with unintended consequences and it is vital that reforms be implemented before people begin seeing their water rights curtailed or diminished.”
If these proposed dams are built, they could also have a negative impact on the environment. Western Resource Advocates and several other nonprofit and government organizations within Colorado work to improve riparian habitats and keep water flowing in rivers for the benefit of fish and ecosystems. Many of the groups’ projects try to mitigate the effects of cities and agriculture taking too much water out of rivers.
If these proposed dams are built, they could also have a negative impact on the environment.
John Cyran, senior attorney with WRA’s Healthy Rivers Program, said this 2.6 million acre-feet of proposed reservoirs is a time bomb.
“Given that so many streams are already in stressed positions, it’s a big problem for the environment,” Cyran said. “We’re trying to look at the river as it is now and figure out how we can make it healthier. If a bunch of new claims come on the river, that work will be for nothing.”
Cyran brings up another potential issue with conditional water rights: They are able to be bought, sold, changed and transferred to another owner, another location or another type of use. In October, the Middle Park Water Conservancy District transferred conditional rights for a 20,000 acre-foot reservoir on Troublesome Creek near Kremmling to a private ranch for just $10. Some worry that this Western Slope water could be sold to the Front Range. And WRA is opposing another instance in the White River basin where an oil and gas company wants to transfer its storage rights to a new location.
“We’re trying to look at the river as it is now and figure out how we can make it healthier. If a bunch of new claims come on the river, that work will be for nothing.”
John Cyran, senior attorney with WRA’s Healthy Rivers Program
“The idea is supposed to be a conditional right saves your place in line,” Cyran said. “There should be restrictions on water users trying to change those rights to some new purpose while retaining their senior priority. If you can’t use it for what you intended, it goes back to the river. You don’t get to use it for something else, and you don’t get to sell it to somebody to use for something else.”
Future water development tensions persist on Colorado River
But perhaps the biggest issue with 2.6 million acre-feet worth of new water storage may be the effect on, and implications for, the Colorado River basin as a whole. Water managers from each of the seven basin states are in the midst of hammering out a deal that would decide how Lake Powell and Lake Mead are operated and how cuts are shared among the seven states beyond 2026.
The Colorado River flows along I-70 in De Beque Canyon just east of the Grand Valley. Water users hold rights to store an additional 2.6 million acre-feet from the Colorado River and its tributaries in proposed reservoirs on the Western Slope. William Woody
Colorado officials have been rolling out new talking points, which include that the Upper Basin already uses about 30% less water in dry years because the water simply isn’t there, so the Lower Basin should take a corresponding proportionate cut of 30%.
At a time when water managers are debating how to share cuts in a hotter, drier future and where some water users are already suffering shortages, why is this large scope of water development in western Colorado still planned?
JB Hamby, chair of the Colorado River Board of California and the state’s lead negotiator in Colorado River talks, who also serves on the board of the Imperial Irrigation District, which is the biggest water user on the Colorado River, laughed when Aspen Journalism told him that Colorado has plans to develop 2.6 million acre-feet worth of new reservoirs on the Western Slope.
“That’s crazy,” he said.
At a time when water managers are debating how to share cuts in a hotter, drier future, why is this large scope of water development in western Colorado still planned?
Hamby said building 20th century-style infrastructure to develop more water in the Upper Basin does not make sense. He said all water users in the basin should be working together to find ways to collectively reduce their use. That includes navigating differing interpretations of the Colorado River Compact without involving the U.S. Supreme Court.
“That’s our best step forward, not pretending like it’s 1965, which it is not,” Hamby said.
Hamby was getting at something that is a major sticking point between the Upper and Lower basins: two different interpretations of an aspect of the 1922 Colorado River Compact.
The agreement assumed there was 16 million acre-feet of available water each year, with 7.5 million acre-feet each allocated to the Upper and Lower basins. The goal was to reserve an equal portion of the river’s flows for the Upper Basin to prevent rapidly growing California from taking all the water. Giving half to the Upper Basin ensured that the states could slowly grow into their full allocation.
A century later, the Upper Basin still has not done that and currently uses about 4.3 million acre-feet a year. Experts have pointed out that 16 million acre-feet was an overestimate of how much water was available to begin with, and after two decades of being wracked by drought and climate change, that amount of water surely no longer exists in the Colorado River basin system. The foundation of the Colorado River Compact was flawed.
Upper Basin water managers cling not only to what was promised to them 100 years ago but to the belief that as long as they don’t use more than the 7.5 million acre-feet allocated to them, they will not be in violation of the compact. However, some Lower Basin advocates believe that regardless of the Upper Basin’s use, the upstream states could be subject to a compact call if they don’t deliver 7.5 million acre-feet a year. Because river flows have diminished over the past 20-plus years, additional use in the Upper Basin could exacerbate shortages and trigger litigation from the Lower Basin in the form of a compact call, which could force cuts on the Upper Basin. Legal uncertainties about how a compact call could unfold complicates the dynamic and heightens animosity between the two basins.
Amy Ostdiek, chief of the interstate, federal and water information section of the Colorado Water Conservation Board, said an additional 2.6 million acre-feet of reservoir storage won’t increase the risk of a compact call.
“We have the right to the beneficial use of 7.5 million acre-feet a year and in the Upper Basin, Colorado gets 51.75% of the available supply,” she said. “I do not see these projects as putting us in danger of going over that number.”
Upper Basin water managers cling not only to what was promised to them 100 years ago but to the belief that as long as they don’t use more than the 7.5 million acre-feet allocated to them, they will not be in violation of the compact.
According to Jason Ullmann, Colorado’s head engineer at the Department of Water Resources, 2.6 million additional acre-feet of water exists in some years and could be developed, especially since most of that would be captured as spring runoff. The way reservoirs typically work is by storing snowmelt in the spring and releasing it as needed later in the year. But any new reservoir would be at the mercy of the particular and variable hydrologic conditions of any given year and may not always fill.
“Typically, storage buckets, the larger ones in particular, they may not accomplish a full fill every year,” Ullmann said. “It may not be a [2.6 million acre-foot] draw on the river every year. It’s just a water right for that amount of storage.”
Hamby said the Upper Basin point of view is one of the past and out of alignment with the hydrology of the river, which has been declining over the past two decades and is expected to continue to decline.
“The idea of developing new infrastructure to put more water to use does not make sense in this century,” he said. “And while there may be feelings of promises from 1922, this is 2024.”
What if it was all a dream?
One reason these proposed reservoirs don’t seem to worry many water managers is because nobody believes they will ever all be built. Although these projects represent the desires of the Upper Basin, this scale of development may be just a pipe dream.
Eric Kuhn, a Colorado River expert, author and former general manager of the Colorado River District, doubts that many of these reservoirs will be built, but not because the water isn’t there or because of the permitting hurdles, environmental impacts or expense of construction. Rather, Kuhn says there’s no longer a need for many of these storage buckets.
Some of these conditional rights, especially in the Yampa-White-Green River basin, are associated with oil shale development, which has become less economically feasible in recent years. There are no new large-scale federally subsidized irrigation projects on the horizon. And as more agricultural land is converted to residential developments across the West, water use goes down.
Oil and gas wells line the Colorado River along a rural stretch of western Colorado. Energy companies hold conditional water rights across the region, many linked to the potential future development of oil shale. William Woody
Cities such as Aurora and Las Vegas have implemented aggressive conservation programs and have proved they can grow without using a lot more water. As the Upper Basin continues to urbanize, it may never grow into its 7.5 million-acre-foot allocation. The only reservoirs that will realistically be built, Kuhn said, will be small (1,000 acre-feet or less) and on a creek where there’s municipal demand.
“Maybe you need additional storage for streams that don’t have enough storage today, but that’s a tiny, minute amount,” he said. “Conditional water rights are a product of 50, 60, 70, 80 years ago, when they had a purpose. I don’t even see that they have a purpose anymore. They also represent a whole bunch of projects that, if they had been economically feasible, would have been built a long time ago.”
“Conditional water rights are a product of 50, 60, 70, 80 years ago, when they had a purpose. I don’t even see that they have a purpose anymore.”
Eric Kuhn, former general manager of the Colorado River District
Although many entities continue to hang on to conditional water rights that they are unlikely to develop, some are starting to take a more clear-eyed approach, recognizing that some of these phantom reservoirs are dreams of the past and letting them go.
The River District has abandoned conditional reservoir rights on the Crystal River and other places; in January, a company with ties to oil shale development abandoned rights for a reservoir on Thompson Creek south of Carbondale; Colorado Springs recently gave up water rights for reservoirs in Summit County; and in October, the town of Breckenridge let go of water rights for two reservoirs on the Swan River but kept rights for a third: Swan River Reservoir No. 4.
James Phelps, director of public works for the town of Breckenridge, said they didn’t file the diligence claims this time for Swan River Reservoirs Nos. 1 and 2, which had water rights dating to 1981, because the town doesn’t need to develop that much reservoir capacity. Other factors in the town’s decision to not keep the reservoirs alive were the huge financial costs; the fact that housing developments encroached on the reservoir sites; and disturbance to the ecosystem in a place where residents place a high value on the environment.
“It was determined that if there was a need for the water in the future, whatever that need may be, we wouldn’t need to develop all three of those,” Phelps said. “We know that developing reservoirs is not an easy thing to do.”
Despite Colorado water courts’ tendency to rubber-stamp most diligence applications to keep alive decades-old unused water rights, there is at least one recent example of legal pushback on a reservoir enlargement project.
In October, a federal judge ruled that Denver Water’s Gross Reservoir expansion violated the Clean Water Act because it didn’t take into consideration the potential for a Colorado River Compact call and the declining hydrology of the basin. Although it’s unclear if this ruling would set a precedent for any other dam and reservoir project in Colorado, it signals a growing understanding of the risks that new water development could pose to the entire Colorado River system.
“The Colorado River Compact rests on a politically unpalatable truth — the Compact promised the basin states water that simply does not exist,” a footnote in the ruling reads. “The Court emphasizes this context for good reason: The cracked foundation of the Colorado River’s management system all but demands skepticism over any proposal that will affect the hydrology of the Colorado River basin.”
This story was produced by Aspen Journalism, in partnership with The Water Desk at the University of Colorado Center for Environmental Journalism.
How we produced this report
Aspen Journalism used publicly available data on conditional water rights from the Colorado Division of Water Resources to produce the interactive map of Western Slope reservoirs over 5,000 acre-feet. Information from this state database was confirmed for accuracy with state officials, who verified it was current as of September 2024. Information about who owns each water right was found in water court filings. We have mapped the reservoirs to the best of our knowledge by cross-checking publicly available information with water court filings, but inaccuracies may still exist.
This project looks at only the water rights for the largest 94 conditional reservoir water rights over 5,000 acre-feet on the Western Slope. Most of these would be stored in not-yet-built reservoirs. Some of this water would be stored in existing reservoirs using conditional rights that would allow the reservoir to be refilled or enlarged. There are more water rights for storage amounts smaller than 5,000 acre-feet, which Aspen Journalism did not attempt to quantify, meaning there is more than 2.6 million acre-feet of new reservoir storage planned for western Colorado.
Groundwater pours from an irrigation well in Buckeye, Arizona, an area of the state that has brackish groundwater both near the surface and deep underground. (J.Carl Ganter/ Circle of Blue)
The numbers are so vast, so enticing that they tantalize like a desert oasis.
Deep below the surface in Arizona – roughly a quarter mile underground – sit large volumes of water that are less salty than the ocean, but not easily used. At a depth of 1,200 to 1,500 feet, between 530 million and 700 million acre-feet fill this layer statewide.
If it were all pumped to the surface and purified, this brackish groundwater would supply Arizona’s water needs for a century or more. Problem is, it can’t all be pumped.
Though the numbers are legitimate – and detailed in an updated state assessment that was published in August – the reality for brackish groundwater, at this point, is more of a mirage. Exploiting this resource to satisfy the state’s demand for water in an arid climate is not as simple as drilling wells.
“This is not a new supply of water,” said Juliet McKenna, a hydrogeologist with Montgomery & Associates, the consulting firm that the state contracted for the brackish groundwater assessment. “This is physically groundwater and this is legally groundwater. And there are consequences and restrictions in both areas for trying to use this.”
McKenna, who managed the assessment, and other state water experts interviewed for this story explained that brackish groundwater has a slew of impediments – environmental, physical, financial, technical, regulatory, and legal – that limit its use, despite the efforts of enthusiastic backers in the Arizona Legislature who are looking for ways to counter the state’s declining Colorado River supplies.
“Brackish groundwater is still groundwater, right?” echoed Patrick Adams, water policy adviser to Gov. Katie Hobbs. “So its extraction impacts the aquifer as much as any other groundwater supply when it’s removed from storage. And really that needs to be considered – and its use needs to be considered –against that backdrop. Where’s the brackish groundwater located? What are the local groundwater conditions? What’s the health of the aquifer?”
Securing a reliable water supply is an existential question for high-growth Arizona and its desert economy. The Colorado River, a major source for central Arizona, has sputtered in the last two decades amid hotter, drier weather attributed to a warming climate. The state’s allocation from the river was whittled by at least 18% in each of the last three years. New operating rules that are under negotiation will likely extend or deepen those cuts past 2026, when current guidelines expire.
Water, as a result, is prominent in state policy debates.
Drilling into Arizona’s Brackish Supplies
A desire for more data on its water sources is why the Legislature inserted $50,000 for an updated brackish groundwater inventory in the 2023 budget. The Arizona Department of Water Resources then commissioned Montgomery & Associates to do the analysis.
Arizona is not alone in its quest to better understand its subsurface water. New Mexico is looking to expand its water supply by treating both brackish groundwater and the high-salinity, chemical-laden water that gushes out of oil and gas wells. To the east, the Texas Water Development Board has investigated and mapped the state’s brackish groundwater zones for the last 15 years. A $1 billion water fund approved by voters last year will include at least $250 million for marine and brackish water desalination.
The Arizona inventory identified 21 areas with brackish groundwater, four of which the state singled out for more detailed assessment. One focus area is the Little Colorado River Plateau, in the state’s northeast corner. About half of the assessed brackish groundwater is located there. (The assessment defined brackish groundwater as having total dissolved solids greater than 1,000 parts per million. Sea water, by comparison, is 35,000 parts per million.)
The other areas – Gila Bend, Ranegras Plain, and West Salt River Valley – are closer to the population centers in Maricopa County or to the Central Arizona Project canal that moves water across the state.
“We wanted it to be meaningful or useful,” said Ryan Mitchell, chief hydrologist for the state’s Department of Water Resources, about selecting the focus areas.
A kiosk in Bouse, Arizona, advertises “salt free” drinking water. The town is located in Ranegras Plain, one of the areas assessed in the state’s brackish groundwater inventory. (Brett Walton / Circle of Blue)
The discussions around brackish groundwater are as much about its limitations as its possibilities. McKenna pointed out several challenges. One, water in storage does not equal available water. The same physical drawbacks from pumping fresh groundwater also apply to brackish. As groundwater is pumped, the land above can crack and sink, damaging houses, roads, and other public infrastructure. The water table can drop and cause neighboring wells to go dry. Those outcomes can occur with relatively modest levels of pumping, let alone with a massive drawdown to access all the deep brackish groundwater assessed in the inventory. In an arid region, water at that depth is essentially non-renewable.
“If we dewatered those aquifers to 1,500 feet below ground surface, that’s an apocalyptic scenario,” McKenna said. “So we’re not pumping groundwater to those depths under any reasonable scenario. So the estimate of water that is there, in aggregate, does not translate to water that’s available for folks to use.”
Water is already used unsustainably in the study’s four focus areas. Each is currently operating at a groundwater deficit, McKenna said. More water is pumped out than is recharged.
Steep Challenges Remain in Using Brackish Water
Even if brackish groundwater is physically available, it is not necessarily desirable. Buckeye, one of the state’s fastest growing cities, sits within the Buckeye Waterlogged Area, located on the western outskirts of the Phoenix metro area. “Waterlogged” is a regulatory definition based on the area’s unique hydrogeology at the junction of three rivers: the Agua Fria, Gila, and Salt. Water pools here, and farmers have to pump it out so that their crops will grow. Due to salts in irrigation return flows, the water is brackish in places near the surface.
Buckeye, which pumps groundwater for its municipal supply, is surrounded by brackish groundwater, but Terry Lowe, the water resources director, says the city avoids it. For Buckeye, brackish groundwater is “not deployable,” as he puts it. Some of the Buckeye Waterlogged Area groundwater is between 3,000 and 4,000 parts per million of total dissolved solids, and the equipment and energy required to remove the salts is not cheap. “Treating that out is a waste of money,” he said.
What’s more, brackish groundwater has complications that involve waste disposal. Treating brackish groundwater produces a concentrated brine that must be handled delicately and expensively. Small quantities might be handled by a wastewater treatment plant. Large volumes are typically injected deep underground, but in Arizona that method is “effectively prohibited” without policy changes, a governor’s water council determined in 2022. The Arizona Department of Environmental Quality, the permitting agency for aquifer protection, said that no Class I deep injection wells operate in the state. Carollo, an engineering firm, concluded that cheaper brine disposal was essential for brackish groundwater to become an “economically viable water supply” in the state. Lowe also cited brine management as a reason his department shies away from brackish groundwater.
Then there are the legal and regulatory hurdles. The Legislature passed the Groundwater Management Act in 1980 in response to unsustainable use. It established Active Management Areas (AMA) to steward a finite resource. In practice, most users in the six AMAs need permission to pump and must replace a portion of their use. In the Phoenix AMA, which roughly corresponds with Maricopa County but also extends into neighboring Pinal, the goal is “safe yield” by 2025 – balancing groundwater extraction with recharge. It is not on track to meet that deadline. Incentivizing brackish groundwater use could put safe yield farther out of reach.
Farmers in the Buckeye Waterlogged Area must contend with elevated groundwater salinity. The area’s unique hydrogeology and irrigation legacy has resulted in salty groundwater near the surface. (Brett Walton / Circle of Blue)
And one more headwind: Arizona restricts the movement of groundwater within the state. Five groundwater basins are designated as “transport” basins. Water in these areas can be pumped and exported to an AMA. Most other groundwater must be used in its basin of origin. Without a change in legal status, brackish groundwater would be stranded in place, able to be used locally but not moved to the areas of highest demand.
“For us it’s still considered groundwater,” Mitchell said. “It’s still regulated the same, it’s still accounted for and tracked and all the authorities are still in place, whether it’s brackish or fresh, it’s still treated the same.”
The Search for Water
To state Rep. Alexander Kolodin, these hurdles – physical, financial, regulatory – are obstacles that can be overcome. Kolodin, a Republican who represents northeastern Maricopa County, is the most enthusiastic booster of brackish groundwater in the Legislature. He sees the big number in the updated inventory and grows excited.
“Arizona is sitting on an absolute ocean of brackish groundwater,” he said. With the state’s take from the Colorado River declining, Kolodin wants to consider other sources of water that could fill the gap. “I’m very interested in figuring out how we can tweak the law to utilize this resource’s maximum potential.”
Those tweaks at the state level, he said, would include reducing groundwater replenishment requirements in the AMAs for brackish water and relaxing the restrictions on moving groundwater out of its natural basin. “If you can’t transport it, you never really have much incentive to do it in rural areas because it’s still much more costly than our historical sources of water,” he said.
Kolodin advocated for $11 million in the state budget last year for a brackish groundwater pilot program. The Department of Water Resources published a request for information in October 2023. The pilot didn’t go much farther than that. Mitchell, who reviewed the submissions, said they read more like “qualifications packages” than a careful project plan. Due to a state budget shortfall this year, funding for the pilot was retracted.
Brackish groundwater boosters like Kolodin note the efforts in Texas, where the state government mapped its brackish reserves, estimated yields, required impacts analysis, and provided financing. El Paso has the country’s largest inland desalination facility, which has a production capacity of 27.5 million gallons a day. Mitchell, however, points out that the comparison is not one-to-one. Arizona has different hydrogeology, as well as more stringent legal and regulatory requirements.
The hunt for new water supplies is a longstanding feature of Arizona politics, extending back to the pursuit of the Central Arizona Project canal in the mid-20th century. In recent years, the prospectors have sought to turn salty water fresh.
A decade ago, under Gov. Jan Brewer, the state produced the Arizona’s Next Century report, which listed brackish groundwater as one of seven potential sources to augment the state’s supply.
Water augmentation was a major focus of Gov. Doug Ducey’s administration. In 2015, Ducey signed an executive order to establish the Governor’s Water Augmentation Council. In 2019, he signed another executive order that expanded the work to “investigate long-term water augmentation strategies for the state.” The Governor’s Water Augmentation, Innovation, and Conservation Council lasted until Gov. Hobbs was elected. In 2023, Hobbs formed the Governor’s Water Policy Council.
The Hobbs administration is less focused on brackish groundwater than her predecessors. The Governor’s Water Policy Council report, published earlier this year, does not mention it by name.
“Brackish groundwater development as a source for augmentation is not really at the forefront of where the Water Policy Council is focusing its efforts,” Adams, the governor’s water policy adviser, said.
For now, as more data is collected, brackish groundwater will remain just off center stage, with lingering questions about how and when it should be used.
“If it were to be utilized, it needs to be done so thoughtfully and mitigate impacts from pumping,” McKenna said. “It’ll be expensive, in terms of treating and permitting. But it is a supply that’s in our state, and like our other water supplies, I think we need to think about it and make thoughtful decisions about how to use it, if we want to use it.”
This story was produced by Circle of Blue, in partnership with The Water Desk at the University of Colorado Boulder’s Center for Environmental Journalism.
A directional boring machine sits outside a home in Edgewater, Colo., on Sept. 25, 2024. Crews are working on replacing lead pipes in homes built before the 1950s with copper pipes by drilling a new hole and abandoning the lead in place. (Emma VandenEinde / KUNC)
On an early morning, a quiet Denver neighborhood was temporarily transformed into a construction zone. A boring machine on the road outside someone’s home pointed a long, thin drill bit at a sharp angle toward a hole in the ground. It’s going to make a path for a new water service line.
All the commotion is for a singular purpose: to reduce the amount of lead flowing into Denver homes.
“Previously, the technology was pulling (the old line) or open trench excavation, which is not customer friendly,” said Denver Water’s Alexis Woodrow. “People do not like their entire yard dug up.”
A man grabbed a big coil of copper line and brought it into the home. Another contractor took out an electronic locator to help guide the boring machine operator.
Wesley Fischer with Five Star Energy Services brings a large coil of copper line from the truck into the nearby home. He will wait until the new hole is drilled and then connect the copper line to the drill bit, which will pull the new line through. (Emma VandenEinde / KUNC)
“They are essentially boring in a new line and then pulling out a copper (line) so they leave the lead abandoned in place,” said Woodrow, who manages the program. “That’s often because we can’t pull it out, or it’s just more efficient to put in a new line.”
This is just one of many work sites for the utility’s Lead Reduction Program – a nearly $670 million project designed to replace lead service lines with copper ones in the Denver area at no cost to the customer.
Lead is toxic. It can cause brain damage in children, as well as increase the risk of a miscarriage, according to the World Health Organization. Denver Water isn’t delivering lead-laden water to customers, Woodrow said, but old household plumbing and service lines can leech lead into that water and cause problems.
“There were homes in the Denver Water service area where lead levels were elevated and the corrosion treatment that we were doing was not sufficient enough to create that protection that they needed,” she said.
In 2012, Denver Water exceeded the lead action level of 15 parts per billion set by the Environmental Protection Agency, coming in at 17 parts per billion. Service lines are owned by the customer, but the utility felt the need to do something. The city researched effective treatment solutions and found that changing the pipe as well as increasing the pH of the water was their best bet.
Lead pipes contaminate the drinking and cooking water inside tens of thousands of Denver homes. They can impact peoples’ teeth, kidneys, blood, liver and more. (Emma VandenEinde / KUNC)
Denver Water has found nearly 65,000 lead lines in the city, primarily in homes built before the 1950s. That’s roughly 220 miles of pipe, according to Denver Water officials. The condition of about 17,000 lines is still unknown.
Since starting the Lead Reduction Program in 2020, the utility has replaced around half of the lines. They also sent Brita pitchers and filter replacements to homes that are still waiting to get their lines replaced.
“What we were giving to them through this program was a chance at health and safety,” Woodrow said. “(We’re saying), ‘You are likely to have a lead service line, so here’s what Denver Water is going to do to protect you.’”
These replacements come in the wake of the Flint Water Crisis in Michigan in 2014, when the city changed their water source from Lake Huron to the Flint River. Pipes corroded and there were no treatment methods in place. Lead levels were nearly double the lead action level set by the EPA in most of the homes, while others were in the hundreds or thousands for parts per billion.
It put the dangers of lead in drinking water in the national spotlight. So why weren’t Denver’s lines, and others, replaced sooner?
Siddhartha Roy is a professor at Rutgers University and has done research on the Flint Water Crisis. He said one reason could be that lead was the plumbing standard in the turn of the 20th century when many cities were growing rapidly.
“Cities had mandates that, ‘Hey, if you want public water, you have to use a lead pipe,’” he said. “There was an industry push. There was a lead lobby as hard as it is to believe that…it will poison you, but lead will last thousands of years.”
Woodrow with Denver Water said even as the dangers came to light, everything was still evolving and utilities were not sure what the best solution was at the time.
“I think there were a lot of questions within the industry, and also in public health, about how lead in drinking water kind of fits in the whole scale of lead exposure, and how serious it is,” she said.
Jason Stern grabs the extra part of the copper line that was pulled through the new hole in the ground. Even after the line is replaced, homeowners still are asked to use a water pitcher with a filter for a few months as the lead cycles out of the piping. (Emma VandenEinde / KUNC)
“You had steps like, ‘Oh, flush (the water) for a few minutes the night before you took a sample in the morning,’ and that lowers lead levels,” he said. “That made it appear that the problem was not as worse as we thought.”
This fall, the Biden Administration introduced a stricter policy, where cities have to remove all of their lead pipes by 2037. Cities will also have to comply with the new lead action level of 10 parts per billion.
Some local utilities have already gotten financial help from the EPA and the Biden administration to get started on this work. Denver Water received $76 million in funds from the Bipartisan Infrastructure Law to speed up this process. The utility was originally paying for its Lead Reduction program on its own with its water rates, bonds and hydropower sales.
Claire Thomas sits with her cat in her historic home that was built in 1890 in the Curtis Park Historic District in Denver, Colo., on Oct. 1, 2024. She got her lead pipe replaced at the end of August. (Emma VandenEinde / KUNC)
Roy said he’s cautiously optimistic.
“The question is financing,” he said. “The question is organizing this at grand levels, coordinating. There’s so much to be done…This is the single biggest policy jump on improving lead in water in more than 30 years.”
When lines do get replaced, it can be revolutionary. Claire Thomas lives in a historic home built in 1890 in the Curtis Park Historic District near the Five Points area of Denver. She got a water filter from the utility and never expected any sort of replacement.
“It was just, this is our way of life,” she said. “We drink from the Brita, and just kind of accepted that.”
Thomas and her partner cook a lot and have friends over often. They’d end up using more water than their small filter could handle.
“In reality, we’ve probably been drinking water that has lead in it because we’ve been overusing our filters,” Thomas said.
Thomas’ new copper pipe sits in her unfinished basement of her home. Contractors did a quick site visit of her home and told her what to expect before they scheduled a day for the replacement. Thomas was pleased by how quick the replacement was and the kindness of the contractors to sweep up the dust and be careful inside her home. (Emma VandenEinde / KUNC)
When she first heard from the utility that her lines were going to be replaced, she was elated.
“I’ve been in a lead water house for so long, I was so excited,” she said. “That same day we returned to the post office with our water samples.”
She got her line replaced at the end of August. She was shocked at how quick the process was and how kind the workers were, cleaning up the street within a week and being very careful within her home.
“(I) feel really lucky moving into this house and a year later being able to have normal water,” she said. “And as I say that, I realize that that’s a weird thing to have to be thankful for, but here we are.”
Denver Water has about 1,000 more replacements to finish before the end of the year. It plans to work in East Denver in 2025 to stay on track with the goal of finishing the whole project within 15 years.
To find out if you have a lead service line, you can enter your address on Denver Water’s Lead Service Line dashboard. Homeowners with questions can call the utility call center at 303-893-2444.
This story was produced by KUNC, in partnership with The Water Desk at the University of Colorado’s Center for Environmental Journalism.
The Rio Grande cuts through a mountain range on the border of the United States and Mexico. In the Forgotten Reach, upstream impoundments reduced water flow by more than 70 percent. (Omar Ornelas for Inside Climate News)
Reporting supported with a grant from The Water Desk at the University of Colorado Boulder’s Center for Environmental Journalism. Aerial photography support provided by LightHawk.
FAR WEST TEXAS—The year was 1897. Flood waters from the Rio Grande submerged entire blocks of downtown El Paso.
The New York Times described the crash of crumbling houses and the “cries of frightened women and children” on its May 26 front page. The raging river displaced hundreds of people and destroyed scores of adobe homes.
In Mexico, the Rio Grande is known as the Rio Bravo—the rough, or wild, river—signifying the force that caused several devastating floods in El Paso and neighboring Ciudad Juárez.
Today these historic floods are hard to imagine. The river channel in El Paso-Juárez now only fills during the irrigation season. Further downstream, the river is frequently dry in a 200-mile section known as the Forgotten Reach.
Inside Climate News documented this remote stretch of the river in July on a flight with the non-profit Light Hawk. Other than limited flows from springs and creeks, known locally as arroyos, this section of the Rio Grande barely has water.
That’s because reservoirs now harness the flows of snowmelt and monsoon rains that once defined the river and deliver that water to thirsty cities and sprawling farms. Making matters worse, climate change is increasing temperatures and aridification in the desert Southwest.
Competition over dwindling water is growing. All that leaves little water to support fish, birds and wetland ecosystems that once thrived along the Rio Grande.
But environmental scientists and local conservation advocates say there are opportunities to restore environmental flows—the currents of water needed to maintain a healthy river ecology—on the Rio Grande and its West Texas tributaries. Proponents of environmental flows are restoring tributaries and documenting little-known springs that feed the river. They are working with counterparts in Mexico to overcome institutional barriers.
Samuel Sandoval Solis, a professor of water resource management at the University of California Davis and an expert on the Rio Grande, compared this restoration model to a “string of pearls.”
“Ultimately, we start connecting these pearls,” he said. “And we start putting it back together.”
But to replicate and expand these local initiatives will require more funding and political support on the embattled binational waterway.
Water for Agriculture, but Not for Nature
For millions of years, the flow of the Rio Grande in present-day New Mexico and West Texas was dictated by two natural cycles. Spring snowmelt in Colorado sent water rushing downstream, triggering floods throughout the watershed. In the summer, the monsoon dumped rain on the desert and swelled the river.
These annual “pulses” of water sustained biodiverse ecosystems in the arid Chihuahuan Desert.
Karen Chapman, coordinator of the Rio Grande Joint Venture, a public-private migratory bird conservation partnership, said the Big Bend segment of the Rio Grande in West Texas is an “emblematic, important wetland for migratory birds in the middle of a big desert region.”
Floods spread the seeds of cottonwoods and tornillos, a native mesquite shrub. Thriving wetlands attracted the southwestern willow flycatcher. Floodplains provided spawning habitat for the Rio Grande cutthroat trout and silvery minnow. Indigenous people harnessed the water for subsistence agriculture.
These cycles came to an end in the early twentieth century. In 1916, the Bureau of Reclamation completed Elephant Butte Dam outside Truth or Consequences, New Mexico. Its 301-foot retaining wall captured the crush of water coming out of the mountains. The dam released water on a precise schedule for farmers farther down the river. The three cities immediately downstream—El Paso, Las Cruces and Ciudad Juárez—continued to grow.
Agricultural fields line both sides of the Rio Grande between El Paso and Ciudad Juárez photographed in July 2024. The Rio Grande Compact determines how much water reaches Texas from the Rio Grande. (Omar Ornelas for Inside Climate News)
The Rio Grande Compact—signed in 1938 between Colorado, New Mexico and Texas—sealed the river’s fate. The compact ensured that farmers in all three states would get their share of water. But there was no obligation to guarantee water flowed beyond the last irrigation district south-east of El Paso, at a point called Fort Quitman. The once-mighty Rio Grande began to dry up downstream of that now abandoned ghost town.
When seasonal flooding ceased in the Forgotten Reach, salt cedars and arundo river cane invaded the floodplain and crowded out native cottonwoods and tornillos. With meager volumes of water in the river, sediment has built up and further hampered the flow. Wetlands shriveled and migratory birds lost stop-over points.
“The river transforms from a natural flashy system to a straight ditch,” explains Kevin Urbanczyk, director of the Rio Grande Research Center at Sul Ross State University in Alpine, Texas. “You lose the aquatic habitat when that happens.”
The Forgotten Reach ends where the Rio Conchos flows from Chihuahua into the Rio Grande at Presidio, Texas. Before the construction of Elephant Butte, over 500,000 acre feet of water reached Presidio each year. After the construction of the dam, the flow fell by 77 percent, according to the Army Corps of Engineers.
In West Texas, the Rio Grande Joint Venture works with landowners to restore grassland and riparian habitats near Rio Grande tributaries like the Terlingua Creek and Alamito Creek. These projects reduce the amount of sediment reaching the Rio Grande, a key intervention to improve flow on the river.
In recent years, flows have also declined downstream of Presidio. Mexico is obligated under the 1944 water treaty to send water from tributaries, including the Conchos, to the United States on a five-year cycle. But since the 1990s Mexico has consistently fallen behind, diminishing water levels in the Rio Grande downstream of Presidio.
The river ran dry through the iconic Santa Elena Canyon in Big Bend National Park in 2022. Rafting expeditions, a bedrock of the Big Bend tourism economy, rely on a river that is less and less dependable.
What water Mexico does deliver is stored at the Amistad and Falcon Reservoirs in South Texas. The Texas Commission on Environmental Quality (TCEQ) then distributes water from the reservoirs to irrigation districts and cities in South Texas and the Rio Grande Valley.
This section of the Rio Grande is considered “over appropriated,” which means there are more assigned water rights than there is water normally available. In other words, every drop of water already has an assigned end-user. There is no water left over for dedicated environmental flows in South Texas.
The problem was abundantly clear in 2001, when for the first time in decades the Rio Grande failed to reach the Gulf of Mexico.
Advocating for Environmental Flows Across Borders
Conservation advocates and scientists working on the Rio Grande face formidable challenges: a binational treaty dispute, climate change, an over-appropriated river. But UC Davis’ Sandoval Solis is convinced environmental flows are possible if water is managed differently.
Sandoval Solis would like to see Mexico release water from its Rio Conchos reservoirs to the Rio Grande to mimic the cycles of spring floods and the summer monsoon. He said better timing of releases can help native species without infringing on farmers’ water rights.
He acknowledged that environmental flows are not a priority in ongoing diplomatic talks as the U.S. works to compel Mexico to release any water. But he said “pulses” of water at opportune times could go a long way.
The idea has already been implemented on the Colorado River, another binational river governed by the 1944 water treaty. In 2014, water was released from the Morelos Dam to create a pulse flow that connected the Colorado River to the Gulf of California for the first time in 16 years. In 2017, the U.S. and Mexican governments agreed to ongoing water deliveries for restoration of the Colorado River delta in Mexico.
The Rio Grande winds through the Chihuahuan Desert in far west Texas. Diversions for agriculture and cities have reduced the flow by at least 70 percent compared to historical flow levels. (Omar Ornelas for Inside Climate News)
U.S. International Boundary and Water Commission spokesperson Frank Fisher said “nature-based solutions” have been part of the agency’s discussions with Mexican counterparts, but did not indicate whether there is interest in a pulse flow on the Rio Grande/Rio Conchos.
In February, the U.S. IBWC and its Mexican counterpart, known as CILA, created the Rio Grande Environment Work Group. The group has met several times this year to identify and implement binational environmental projects on the Rio Grande.
Karen Chapman of the Rio Grande Joint Venture advocated for the creation of the working group and is now a member. “There are folks on both sides of the river in both countries that are concerned about the health of the river and want to work towards some solutions,” she said.
There have been some successes in restoring flows to the Rio Grande. In a 2022 paper in Ecology & Society, Sandoval Solis and colleagues at UC Davis and the University of Oklahoma compiled examples of environmental flows throughout the Rio Grande/Rio Bravo watershed. They point to in-stream flows on Rio Grande tributaries in New Mexico and the first environmental water right in Mexico at the Cuatro Ciénegas wetlands as models to replicate.
A 2023 paper published in the Journal of Water Resources Planning and Management, by lead author Brian Richter of Sustainable Waters, with Sandoval Solis as a co-author, expanded on these ideas. The authors model how converting farmland to less water-intensive crops and leaving some acreage fallow could decrease consumption in agriculture, which currently uses 83 percent of the water rights in the watershed. This would make more water available for environmental flows, without reducing agricultural revenue.
Sandoval Solis said politics is getting in the way of expanding on these models to restore flows to the river.
“The problem of environmental flows on the Rio Grande is not about science,” he said. “We know that the river is drying and we know that it’s about willingness, political willingness.”
Protecting Groundwater that Feeds the Rio
Sul Ross’ Kevin Urbanczyk studies the Lower Canyons on the Rio Grande, downstream of Big Bend. At least once a year he loads up a canoe to reach the canyons, which are not accessible by road, where he measures the flow from aquifer-fed springs into the river.
Urbanczyk said that when Mexico does not send water from the Rio Conchos, all the water in this section of the Rio Grande comes from the springs. He said more research is needed to understand how groundwater contributes to the Rio Grande.
Texas has two separate systems to regulate surface water in a river and groundwater in aquifers. But Urbanczyk said regulations need to account for how these sources are interconnected. He worries that an increase in groundwater pumping near the river could deplete the springs’ contributions to the Rio Grande.
“We’re talking… as if they’re two different things,” he said. “But they’re not. It’s the same water, so the connection needs to be understood.”
The IBWC spokesperson said that historic water gauge data and field studies indicate that groundwater amounts to a discharge of approximately 200 cubic feet per second in the Big Bend region to the Amistad Reservoir.
“[IBWC] understands the importance of these groundwater contributions to providing reliable and predictable water supply to downstream users as well as sustaining environmental processes in the region,” said the spokesperson.
Environmental Flows Legislation in Texas
Largely absent from the discussion of environmental flows on the Rio Grande is the Texas legislation meant to achieve that very objective. In 2007, the Texas Legislature passed Senate Bill 3, which provides protections for environmental flows in Texas rivers and into bays and estuaries.
However, TCEQ excluded the Forgotten Reach from the environmental flows program for the Rio Grande from the outset. The Forgotten Reach would stay forgotten—there would be no environmental flow protections in this 200-mile long stretch of the river.
But in a 2008 study with the Army Corps of Engineers, TCEQ expressed interest in restoring the Forgotten Reach. The study explored restoration options and stated that “The ‘Forgotten’ Rio Grande might have great value as a laboratory for the art and science of rehabilitating perturbed rivers.”
The Rio Grande rises out of the agricultural valley and into the mountains of West Texas. This is the beginning of the Forgotten Reach, a 200-mile stretch of the river with little water flow. (Omar Ornelas for Inside Climate News)
The TCEQ declined a request for an interview about the environmental flows program. In an emailed statement, TCEQ spokesperson Victoria Cann did not respond to questions about why the agency excluded the Forgotten Reach from the program.
The TCEQ formed a scientific working group, including academics and civil society representatives, that recommended environmental flow regimes for the Rio Grande basin. TCEQ then formalized flow standards for the Rio Grande which were adopted into the state administrative code. However, a brief from the Texas Living Water Project points out that the standards TCEQ adopted were a far cry from what the scientific working group recommended.
Myron Hess, a water lawyer and consultant with the Texas Living Waters Project, authored a 2021 report on the “unrealized potential” of Senate Bill 3. The report states that efforts to revive environmental flows have “stalled” in most river basins. Hess said that the models to calculate environmental flow standards do not account for climate change, which is expected to diminish water resources in central and west Texas.
“As droughts get more severe there is going to be less and less water available to protect the environment,” he said. “It’s going to be a world of hurt.”
The TCEQ spokesperson did not respond to multiple requests for comment about the exclusion of climate change from the models. She said that the adopted standards can be revised if new information and data becomes available.
UC Davis’s Sandoval Solis characterized the Texas legislation as “a check box” for regulators to complete. He said the studies commissioned by the legislature have not been acted on.
“In the end you use those studies to do nothing,” he said. “You don’t have any teeth to enforce and to put some water in [the river].”
Despite the setbacks, Sandoval Solis still believes that flows can be restored to the drying Rio Grande. Human intervention over the past 130 years has dramatically transformed the river and stymied its natural flow. But even in the face of climate change he maintains that it’s not too late to reverse some of these changes.
“The river is very forgiving,” he said. “When we have seen the full river coming back to life… in a monsoon, in a hurricane… to me that’s been a very happy experience.”
The Rio Grande Gorge near Taos, New Mexico, on June 24, 2024. (Mitch Tobin /The Water Desk)
The Water Desk is excited to announce an in-person training and workshop for journalists interested in covering the Rio Grande watershed.
The Rio Grande faces significant challenges: climate change, aridification, pollution, development, population growth, invasive species and more. The river forms part of the U.S.-Mexico border and is a critical water supply for three U.S. states—Colorado, New Mexico and Texas. As supplies shrink and tensions ramp up, litigation among the river’s users continue to make headlines. Diplomatic relations between the U.S. and Mexico have the potential to affect the Rio Grande as well.
To equip journalists to better understand the river’s history, its current legal cases and future challenges, The Water Desk is hosting a training program for journalists in Albuquerque, New Mexico, on January 29-31, 2025. Participating journalists will hear from legal experts, tribal leaders, environmental advocates and other speakers who can shed light on the Rio Grande.
We will select up to 15 participants who represent diversity in geography, race, gender and journalistic medium. Travel, lodging, meals and other expenses will be covered for all attendees. Additional funding for story coverage after the training will be made available. The program will begin the evening of January 29 and conclude in the afternoon on January 31.
The Thornburg Foundation, a Santa Fe-based family foundation, is providing the financial support to make this training possible, while the program is the sole responsibility of The Water Desk.
The Colorado River Indian Tribes have the right to divert 662,402 acre-feet of water per year from the Colorado River for use on their lands in Arizona. Congress recently granted the tribes authority to lease some of this water to entities elsewhere in the state. (Brett Walton/Circle of Blue)
PARKER, Arizona – South of Headgate Rock Dam, beyond riverbanks lined with willow and mesquite, the broad floodplain of the Colorado River spreads across emerald fields and sun-bleached earth.
The Colorado River has nourished these lands in present-day western Arizona for millennia, from the ancestral Mohave people who cultivated corn, squash, beans, and melons, to the contemporary farmers of the Colorado River Indian Tribes, or CRIT, whose reservation extends for 56 miles along its namesake river.
CRIT has rights to divert a large volume of Colorado River water – nearly 720,000 acre-feet in Arizona and California combined, which is more than twice Nevada’s allocation from the river. To this point, the water has remained within the bounds of the CRIT reservation. But soon, the water might flow to lands far beyond CRIT’s borders.
Due to an act of Congress signed into law in January 2023, CRIT now has the authority to lease or exchange its water for use elsewhere in Arizona. (The authority does not apply to water rights held by CRIT on the California portion of its reservation.) Agreements signed in April with the Arizona Department of Water Resources and the federal Bureau of Reclamation to fulfill administrative requirements in the legislation brought the tribes another step closer to greater control over their water.
What remains is the work of negotiation, both within CRIT and with potential leaseholders. CRIT leadership must decide what it wants in leasing deals – how much water to part with, to whom, for what price, and for how many years. And they will have to find a partner who agrees to those terms.
CRIT’s leasing authority opens a new chapter, not only for the tribes but for other water users in the state who might covet CRIT’s high-value, high-priority Colorado River water. Leasing this water would represent a financial windfall for CRIT’s more than 4,600 enrolled members. CRIT leadership has framed it as an economic and civic development opportunity. For those on the other side of the deal – be they environmental groups, farm districts, mining companies, or fast-growing cities in the center of the state – it is a rare chance for a relatively secure source of water in an arid region where most supplies are already claimed or running out. Homebuilders west of Phoenix, for instance, have recently seen their access to local groundwater restricted by state regulators.
For CRIT leaders, the new powers come at an auspicious time. They see their duty as stewards of the river intersecting with the mounting challenges of maintaining Arizona’s desert empire amid merciless heat and a drying climate.
“With the climate crisis and the drought going on at the present time, there’s going to be a major shortage of water,” Dwight Lomayesva, CRIT Tribal Council vice chairman, said at a conference in March. “But we would like to be part of the solution to the problem.”
A valuable asset
CRIT is a union of sorts. Four tribes with distinct histories live on the 278,000-acre reservation that spans Arizona and California. The Mohave, known for farming and beadwork, and the Chemehuevi, masterful basket weavers, were original inhabitants of the land. The Hopi and Navajo came later. The federal Bureau of Indian Affairs relocated members of the two northeastern Arizona tribes to the area after World War Two.
Some 79,350 acres are farmed on the Arizona portion of CRIT’s reservation. More acres are dedicated to alfalfa than any other crop. (Brett Walton/Circle of Blue)
CRIT’s history and location translate into a strong water rights position. Like in most western states, water in Arizona is based on a priority system. “First in time, first in right,” as the saying goes. Junior users, who have a later priority date, are cut off first in times of shortage, while senior users like CRIT who have earlier claims can continue to divert.
CRIT’s reservation along the banks of the Colorado was established in 1865, making it one of the first in time in Arizona for water rights – and one of the last to lose access to water. Crucially, leased water retains its place in the priority system. That’s what makes it valuable, said Cynthia Campbell, the water resources management adviser for Phoenix. “That’s front of the line, basically.”
Not only does CRIT have secure water. The tribes also have a lot of it. Comparatively speaking, their water rights are massive. A display at the CRIT Museum makes the point visually. Tubes of foam insulation painted blue depict the volume of water held by tribes along the lower Colorado River. CRIT has the right to divert 662,402 acre-feet per year to its Arizona lands and 56,846 acre-feet to its much smaller landholdings across the river in California. The museum display reflects this bounty – the blue foam bar representing CRIT’s water towers over the others.
For now, CRIT is keeping its water leasing intentions close to the vest. Chairwoman Amelia Flores and Tribal Council members declined to be interviewed for this story.
John Bezdek, CRIT’s lawyer, said that Tribal Council had been focused on finalizing the state and federal agreements and is now turning its attention to how it might structure leases. “There’s a number of additional steps that need to be done in terms of developing a water code, developing provisions on how proposals will be evaluated, looking at those types of things,” Bezdek said. “And so that is all being done right now. We’re working on the next steps internally.”
Despite that public reticence, the contours of CRIT’s thinking have been previewed in other venues. Vice Chairman Dwight Lomayesva outlined his thoughts on the matter in a panel discussion earlier this year, when he participated in the Eccles Family Rural West Conference, held in Tempe, on March 27.
Lomayesva reiterated the cultural and spiritual significance of the Colorado River to his people. “We want to save the river,” he said. “We’re not just a benevolent nation trying to help other countries and tribes and water districts.”
Dwight Lomayesva, vice chairman of the Colorado River Indian Tribes, speaks at the Eccles Family Rural West Conference, held in Tempe, Arizona, on March 27, 2024. (Courtesy Bill Lane Center for the American West, Stanford University)
CRIT has a history of working with state and federal agencies to protect the Colorado River. The tribes participated in a pilot farmland fallowing program from 2016 to2019, in which they saved 45,373 acre-feet for storage in Lake Mead. That deal was the precursor to a larger commitment in 2020, when the tribes pledged to fallow 10,000 acres of farmland and store 50,000 acre-feet of water per year in the basin’s largest reservoir. For the three-year effort, the tribe earned $38 million, from the state and the Environmental Defense Fund.
CRIT’s capacity to lease water is directly related to the farming operations that take place on the reservation. About 79,350 acres are farmed on its Arizona lands, mostly for alfalfa. Some of the land is farmed by a tribal enterprise, but many of the acres are leased by non-tribal members. A majority of the fields are flood irrigated, an inefficient method in which only half of the water is taken up by the crop. The rest eventually flows back to the river or evaporates.
This is important because CRIT can only lease water that it has put to consumptive use in at least three of the previous five years. The consumptive-use stipulation is part of the agreement signed with Arizona and Reclamation in April. CRIT diverts less Colorado River water than its allocation, so the agreement dictates that the tribes can’t part with unused water to which they have rights but bypasses their fields. In effect, it means that water conserved from farming is water that can be leased.
“That’s a very, very important component that we then have to factor into in terms of how we want to develop the program,” Bezdek said.
A huge impediment is CRIT’s obsolete means of moving water to its fields. The Bureau of Indian Affairs, a federal agency, owns and operates the Colorado River Irrigation Project, an irrigation system that is, by all accounts, deteriorating and badly needs repair. It was developed piecemeal starting in the 1870s and diverts water into the main line canal at Headrock Gate Dam. Two-thirds of the 232 miles of lateral canal are made of packed dirt, Lomayesva said. (All quotes from Lomayesva in this piece are from his comments at the March conference.)
Lomayesva said that one study pegged the cost of rehabilitating the system at $300 million – an amount of money that CRIT cannot afford. And even if it could, Lomayesva said that because the tribes do not own the water delivery infrastructure, they would hesitate to invest in it. But he said that leasing deals could provide the capital for farming on the reservation to become more efficient.
“We’re going to only market the water if we can use those funds to develop conservation systems – sprinklers instead of flood [irrigation], pipes instead of dirt ditches, recycle some of that water and reuse it again,” Lomayesva said. “That’s the only reason why we would market our water.”
Others have concluded that the outdated irrigation system is a hindrance. “The high cost to repair infrastructure, including lining canals, reconstructing gates and turnouts, and realigning reaches of the system, limit the Tribes’ ability to realize the full potential value of its water,” according to a 2018 Bureau of Reclamation study.
CRIT recently asked BIA to increase the amount it charges for irrigation water because the tribes believe that the system is underfunded and additional revenue could improve the irrigation infrastructure.
BIA did not respond to interview requests.
The Bureau of Indian Affairs, a federal agency, owns and operates the canal system that supplies the Colorado River Indian Tribes reservation with irrigation water. The system, which draws from the Colorado River, was developed piecemeal starting in the 1870s and needs repair. (Brett Walton/Circle of Blue)
Tribal members voted on an ordinance in 2019 that endorsed leasing and set certain boundaries for its implementation. The ordinance, which passed with 63 percent of the vote, was the result of an attempt a year earlier to recall all nine council members over some residents’ objections to leasing. Two council members, including former chairman Dennis Patch, lost their seats.
Under the ordinance, Tribal Council intends that the same number of acres will be farmed after water is leased. “We are farmers,” Lomayesva said. “We are farmers first, and we will probably always be farmers. And we want to continue farming. But the savings from conservation efforts, we could make some of that water available.”
The way for that to happen is for farming on the reservation to become more efficient – and that means applying less water to the fields. It could happen through conservation. But what tribal leaders like Lomayesva really want is a better irrigation system.
“Water could be made available for conservation or off-reservation leasing, exchange or storage in accordance with the requirements of the federal legislation and agreements if deferred maintenance was addressed along with improvements to the irrigation project,” according to a statement from the tribal government.
How much water might be available? In 2018, CRIT participated in a Bureau of Reclamation study to assess current and future tribal water use in the Colorado River basin. CRIT told Reclamation to assume that up to 150,000 acre-feet per year might be leased and moved off the reservation by 2060. CRIT used the same figure in a December 7, 2020, public meeting discussing the proposed legislation to authorize leasing. However, at the end of July the tribal government said in a statement, “No decisions have been made on a baseline amount of water to be available for leasing.”
What about the length of the leases? Many leases signed as part of a settlement extend for 99 or 100 years. CRIT’s authorizing legislation caps leases or exchange agreements at 100 years. But otherwise CRIT will be a free agent, able to negotiate its terms. Several water policy experts in Arizona interviewed for this story said they heard CRIT was considering a lease length of 25 years. The tribes, however, said in a statement that they have not decided any lease parameters.
Farming is a cultural legacy and economic driver for the Colorado River Indian Tribes. (Brett Walton/Circle of Blue)
The length is significant because of state water supply rules for municipalities. The Arizona Department of Water Resources requires proof of a 100-year supply. A shorter lease would not fully satisfy that requirement, but the water could be used in other ways, said Kathryn Sorensen, the former director of the Phoenix water department. It could be stored underground to offset groundwater pumping, or be paired with other water to fulfill the state’s 100-year directive. In the end, it will be a cost-benefit analysis for cities whether to lease CRIT water with a shorter term, she said.
“Each provider is going to have to weigh the length of the lease versus the priority and weigh the value,” said Sorensen, who is now with the Kyl Center for Water Policy at Arizona State University. “But, look, it’s the highest priority Colorado River water in the state. So it’s bound to be very valuable, even with a short [lease] term.”
Autonomy and flexibility
Though it has liquid riches, this form of tribal wealth has been stuck in place. Tribes elsewhere in Arizona determined their rights to the Colorado, Gila, Salt, Verde and other rivers through negotiated settlements.
In these agreements, tribes generally ceded a portion of their historical rights in exchange for state and federal funding to build the infrastructure that would deliver water to their lands. A settlement currently before Congress – the Northeastern Arizona Indian Water Rights Settlement – is the largest yet, a $5 billion proposal to determine water rights and build water supply and energy generation systems for the Navajo Nation, Hopi Tribe, and San Juan Southern Paiute.
Those settlements typically include leasing provisions. Twenty-four tribes in the West and eight in Arizona currently have leasing authority. The Fort McDowell Indian Community’s settlement, approved by Congress in 1990, for instance, sends 4,300 acre-feet a year to Phoenix. The lease extends for 99 years. Other central Arizona cities, including Gilbert, Glendale, Mesa, and Scottsdale, lease Colorado River water from the tribes, as do mining companies and a housing developer.
CRIT, however, is an entirely different case study. The tribes did not receive their water through a settlement. Their rights were part of the U.S. Supreme Court decree in 1964 that resolved a Colorado River quarrel between Arizona and California and set water allocations in the lower basin. The decree granted CRIT a significant volume of Colorado River water but it did not confer the right to lease. Instead, CRIT had to seek the blessings of Congress to gain leasing authority.
CRIT is now celebrating that authority. In April, three weeks before the state and federal agreements were signed, the tribes held a Water Rights Day, a community festival “honoring our continued commitment to the living river.”
This story was produced by Circle of Blue, in partnership with The Water Desk at the University of Colorado Boulder’s Center for Environmental Journalism.
The Colorado River is in the midst of one of the worst water crises in recorded history. Climate change and overuse are taking a significant toll. Leaders from seven U.S. states must compromise and reach a solution to prevent the river from collapsing.
LAist Correspondent Emily Guerin
To understand how negotiators from those states are thinking in this moment, Emily Guerin, a reporter for LA’s public radio station, LAist 89.3, took a deep dive into the river’s political landscape in her latest podcast series, “Imperfect Paradise: The Gen Z Water Dealmaker” from LAist Studios.
Emily brings a sharp eye to the river’s notoriously complex, multi-layered political landscape, and paints a compelling portrait of the most powerful people tasked with negotiating agreements to share the dwindling water supply.
In this recorded webinar, The Water Desk co-director Luke Runyon and Emily talk about narrative storytelling on the Colorado River, and what the story of the river basin’s most powerful decision-makers tells us about our ability to adapt to a changing climate.
Photos by Paul Ratje. Reporting supported by the Water Desk at the University of Colorado Boulder.
HATCH, N.M.—After 13 years, Texas and New Mexico have finally reached a settlement in a Supreme Court case over Rio Grande water management.
Now comes the hard part.
Texas sued New Mexico in 2013, arguing that its upstream neighbor was hogging water on the river that millions depend on for irrigation and drinking water. The settlement requires New Mexico to reduce the amount of water drawn from wells that deplete the flow of Rio Grande water to Texas.
The agreement also introduces a new accounting method to determine how much water New Mexico owes Texas. And for the first time, the volume of water flowing into Texas will be measured at the state line. Compliance will cost New Mexico upward of $150 million. If the state fails to meet the settlement’s requirements, it could face harsh penalties or another taxing lawsuit.
New Mexico officials hope that buying water rights from farmers and shutting off their wells will be enough to comply. But if climate change continues to drive drier conditions in the Rio Grande basin, those initial voluntary measures will likely fall short. The state expects to have 25 percent less water in 50 years because of rising temperatures.
If New Mexico has to make further reductions to water use, the possibility of mandatory water cuts looms over the region. Behind closed doors, major water users, including farmers and the city of Las Cruces, are negotiating contingency plans. The Lower Rio Grande in New Mexico shows how difficult it will be to fairly reduce water use among farmers, industry and residents as the climate gets hotter and drier.
From Hatch to Anthony, New Mexico, farmers are contemplating whether to sell their water rights and turn off their wells permanently. Towns built on agriculture are asking what comes next in a future with more fallow fields. The settlement comes as a hyperscale data center begins construction in the basin, raising further questions about sustainability.
Norm Gaume, a former New Mexico Interstate Stream Commission director who now leads the nonprofit New Mexico Water Advocates, compared the Rio Grande to a company in bankruptcy. He likened the Supreme Court to the bankruptcy judge.
“They’ve issued their recovery plan,” Gaume said in an interview. “And it’s going to be painful.”
The settlement “is going to change the way we view water and use water in the Lower Rio Grande in New Mexico,” he said. “It has huge consequences.”
People watch the arrival of waters at the Rio Grande in Las Cruces, New Mexico on Thursday, May 30, 2026. Water from Elephant Butte was released for the irrigation season, amid record low water levels at Elephant Butte lake, which is a major reservoir for the Rio Grande. (Paul Ratje for InsideClimate News)
When hydrologists and climatologists reviewed the impacts of climate change on Western water for a 2015 paper in Ecological Applications, they identified the Rio Grande as “the best example of how climate-change-induced flow declines might sink a major system into permanent drought.”
The prognosis hasn’t improved.
Snowmelt runoff, the primary water source for the Rio Grande basin in New Mexico, has decreased 17 percent since 2000. The federal Bureau of Reclamation projects that temperatures in the basin will increase by another four to 10 degrees this century, increasing evaporation and the amount of water needed for crops.
People wait for water to arrive in the dry riverbed of the Rio Grande in Las Cruces, New Mexico on Thursday, May 30, 2026. Water from Elephant Butte was released for the irrigation season, amid record low water levels at Elephant Butte lake, which is a major reservoir for the Rio Grande. (Paul Ratje for InsideClimate News)
Hard times in Elephant Butte
The farmers in the Elephant Butte Irrigation District (EBID) had just received their first deliveries of irrigation water when they met for a board meeting in Las Cruces on June 10. The mood was one of excitement as they worked long hours to harness the water flowing into irrigation canals after the dry season. But board secretary Randy Garay opened the meeting on a somber note with an invocation.
“Help us with our watershed this coming year,” he said, head bowed. “We desperately need it.”
EBID water resources consultant Phil King was blunt when he presented the monthly water report to the board.
“It’s a phenomenal water year,” he deadpanned. “And not in a good way.”
Elephant Butte Irrigation District board members John Clayshulte, Preston Colquitt III, Henry Ludwig and Legal Counsel David Lutz listen to engineering advisor Dr. Phil King discuss the drought situation for the Rio Grande at their monthly board meeting in Las Cruces, New Mexico on Wednesday, June 10, 2026. (Paul Ratje for InsideClimate News)
The district relies on Rio Grande water stored at Elephant Butte Reservoir. That supply is shared by southern New Mexico, far West Texas and Ciudad Juárez, Mexico. Two decades of drought in the Southwest have left the reservoir at a fraction of capacity. After a winter with little snowpack in the Colorado headwaters, the reservoir was roughly 13 percent full in May.
The Rio Grande downstream of Elephant Butte and Caballo reservoirs began to fill with water when the floodgates were opened in late spring. Starting on May 30, muddy, foamy water flowed past the towns of Hatch and Las Cruces before making its way to the Texas and international borders. After the water was released, Elephant Butte fell to 3 percent capacity.
Waters of the Rio Grande arrive in Mesilla, New Mexico on Thursday, May 30, 2026. (Paul Ratje for InsideClimate News)
Farmers in the Elephant Butte Irrigation District are entitled to three acre-feet of water per acre—enough to cover each acre in water three feet deep. But this year they only got four inches of water. Pecans, the biggest crop in the district, need between 4 and 5 acre-feet of water, more than 12 times what they received from the river this year.
Farmers make up the difference with well water. But those wells are the root of Texas’ Supreme Court case against New Mexico.
After the Compact, recurring droughts
The Rio Grande Compact governs how water is shared between Texas, New Mexico and Colorado. The compact was adopted in 1938 after years of disputes.
Not long after, a deep drought fell over the Rio Grande basin. During the 1950s, water levels at Elephant Butte plummeted. Farmers who had planted chile peppers and pecan orchards along the Rio Grande drilled wells into the aquifer.
Eventually the rains and snowpack returned. The aquifer, depleted during the drought years, replenished. Many good years followed. Cities and towns in the region grew. Cities gradually used more water, but agriculture still consumed the lion’s share.
But drought returned in 2002 and hasn’t left since. With years of low reservoir storage, groundwater pumping has once again depleted the aquifer. The aquifer is now siphoning water out of the Rio Grande that should be flowing to Texas and drawing it underground.
Texas took notice and sued New Mexico for allegedly violating the Rio Grande Compact. Colorado and the United States later joined the suit.
Last August, the three states and the federal government reached a final settlement in the case. The Supreme Court approved it this May. New Mexico will have to reduce groundwater pumping to allow more water to reach Texas.
The problem isn’t limited to New Mexico. A 2025 paper in Discover Water by lead author Brian Richter found that 52 percent of water consumption in the entire Rio Grande basin, across the United States and Mexico, is causing depletion of reservoirs, aquifers and river flows.
Implementing the settlement
The day the Supreme Court approved the settlement, some two dozen farmers and local residents gathered at a community college in Anthony, New Mexico, to understand what comes next. It was the first of a series of meetings hosted by the Office of the State Engineer, which regulates New Mexico water.
Ryan Serrano, Lower Rio Grande Basin bureau chief, dove into the details of the settlement package. Serrano explained that New Mexico has 10 years to reduce groundwater pumping by 18,200 acre-feet annually in the basin between Caballo Reservoir and the Texas state line. That’s roughly 6 to 7 percent of all groundwater use in the basin, or enough to fill about 9,000 Olympic swimming pools every year. Between 2021 and 2024, more than 80 percent of groundwater used in the basin went to agriculture.
“We’re on the clock now, May 2026,” Serrano said. “We have until May 2036 to get this done.”
He explained that farmers who are actively using their groundwater rights would be eligible to sell those rights to the state. The state would permanently retire the water rights and let the land go fallow. A study was underway to determine fair market price.
Fallowed fields in Hatch, New Mexico on Tuesday, June 10, 2026. (Paul Ratje for InsideClimate News)
New Mexico already has $150 million allocated for the voluntary water rights purchase program. Officials acknowledge there will be further costs to comply with the settlement. But they say it is a better outcome than if the case had gone to trial. Attorneys for the United States were arguing for even steeper cuts to groundwater use than what was ultimately agreed to.
“We really see the state’s investment in this settlement—and it will be expensive—as an investment in the long-term future of the region,” Hannah Riseley-White, New Mexico’s Interstate Stream Commission director, said in an interview.
“We’re very committed to gathering community input on how to shape a program that’s as responsive as possible to community needs and concerns,” she said.
In Hatch, concern over fallowed fields
After Anthony, the agency hosted subsequent meetings in Hatch and Las Cruces.
Victoria Franzoy, the chief financial officer at Chile River Farms, attended the public meeting in Hatch. She worried that the nascent water rights purchase program will hurt the local economy.
“Up here, farming is a deep family tradition,” she said on a warm afternoon at Chile River’s office and processing plant near Hatch. Victoria’s daughter Lexi, who has her own farm, sat across from her.
People enjoy the arrival of waters at the Rio Grande in Las Cruces, New Mexico on Thursday, May 30, 2026. Water from Elephant Butte was released for the irrigation season, amid record low water levels at Elephant Butte lake, which is a major reservoir for the Rio Grande. (Paul Ratje for InsideClimate News)
Franzoy’s great-grandfather Joseph Franzoy emigrated to Hatch in the early 20th century from Austria. He grew chile peppers to sell at nearby mining camps, eventually becoming the area’s first commercial chile farmer and the patriarch of a large clan of local farmers.
Onions, pecans, alfalfa and cotton are also grown locally, but chile peppers put Hatch on the map. The Hatch Chile Festival each Labor Day brings thousands of visitors to the small town, which pronounces itself the Chile Capital of the World on signs along the interstate.
New Mexico already runs a voluntary groundwater conservation program in which the state pays farmers to temporarily leave their fields fallow. A higher proportion of land in the Hatch area is enrolled in the fallowing program than further downstream in the Mesilla Valley.
Pecan orchards dominate in the Mesilla Valley. Pecan trees must be watered for years to reach maturity, so irrigation cannot be suspended from year to year without jeopardizing pecan production. Meanwhile, farmers in Hatch who grow vegetables have more flexibility to shift production annually.
“Hatch is going to be impacted hard,” Franzoy said. “All the businesses are built around farming in this community.”
The Rio Grande flows through Hatch, New Mexico on Tuesday, June 10, 2026. (Paul Ratje for InsideClimate News)
Franzoy said that local businesses will suffer if more land around Hatch is left fallow. She said that it shouldn’t just be farmers who are asked to cut back.
New Mexico officials are considering putting a cap on the volume of water rights that could be sold in the Hatch area to address the disparate impacts.
“We are hearing loud and clear,” Riseley-White said. “And doing a lot of thinking on our end about how to support the lands from which these rights are being acquired to be viable and valuable to the community.”
In the Mesilla Valley, managing with less water
EBID general manager Josh Smith lamented that drought has become “the ordinary” in southern New Mexico.
“We’re in year 24 of a severe drought,” he said. “At this point, most people are used to these dry conditions.”
He said that each water right holder is going to have to evaluate their situation and decide whether to take the state’s offer. Farmers with large properties could choose to retire groundwater rights on only a portion of the farm. Others who are struggling to make ends meet could sell all their water rights. The state has not yet determined the payment per acre.
“Statistically, there are going to be people for whom it makes sense,” he said.
Elephant Butte Irrigation District General Manager Josh Smith poses for a portrait at EBID headquarters in Las Cruces, New Mexico on Thursday, June 25, 2026. (Paul Ratje for InsideClimate News)
Smith hopes that the farmers in his district start to have more certainty in their water supply now that the Texas v. New Mexico case has settled. But he acknowledged that challenges could continue, and didn’t rule out future lawsuits.
“The primary concern is that if our water situation doesn’t change and we don’t receive snowpack in Colorado and northern New Mexico and get flows, we’re going to have big problems,” he said.
Downstream in the Mesilla Valley, pecan farmer Rafael Rovirosa is sober about the challenges facing the region. In the 1930s, his great-grandfather Deane Stahmann was the first local farmer to commercialize pecans, which are native to the Mississippi River basin. He founded Stahmann Farms, which now extends over 3,200 acres.
Rovirosa grew up on the farm and took over as director of operations in 2017. He has managed the farm through a decade of drought, currently as the vice president, and is preparing for more dry years to come.
“I think we need to plan for a future that’s more similar to what we’re seeing now than what we had before,” he said.
Rovirosa has installed soil moisture sensors in his orchards to improve irrigation efficiency. By measuring the soil moisture, he is able to irrigate only when necessary. He is experimenting with growing pistachios, which require less water than pecans. But he said more research is needed to identify alternative crops that could do well in the area.
“It’s going to take years to really understand,” he said. “If a more economically feasible crop appears, then people will transition. But we’re not there yet.”
He pointed out that not all of the water diverted for agriculture ends up depleting the aquifer. A portion of that water seeps back underground. “That water is not gone, it hasn’t been depleted,” he explained.
Despite the challenges, Rovirosa still sees agriculture playing an important role in the Mesilla Valley for decades to come.
“Our constraint is not going to be accessible water,” he said. “What’s going to limit our water use is the legality and the constraints that the government puts on it.”
Meanwhile, a new water user is setting up shop in the basin, worrying conservation advocates.
The Project Jupiter data center, backed by Oracle and OpenAI, is under construction in the town of Santa Teresa, within the Rio Grande watershed. The 2.5-gigawatt data center has sparked controversy because of its water demands and massive energy needs. The developers purchased existing water rights that are currently being used by a sod farm.
State officials have said that no new water pumping rights will be issued in the Lower Rio Grande. New water users, whether data centers or any other industry, will have to obtain existing water rights.
New Mexico seeks a collaborative water management
In early June, irrigation canals have once again filled with water and residents enjoyed the brief window when the Rio Grande flows through their communities. But they sense what’s coming.
Both to comply with the Supreme Court settlement and to assure long-term sustainability, New Mexico will have to reduce water consumption on the Lower Rio Grande. More cuts will be needed if the voluntary water purchases come up short.
States across the West use a prior appropriation system, included in the New Mexico constitution, which protects the rights of those who first put water to beneficial use above those who began using water later. Under this system, known as priority administration, those who started using water more recently would be cut off first.
The Rio Grande flows through Rincon, New Mexico on Tuesday, June 10, 2026. (Paul Ratje for InsideClimate News)
New Mexico has another tool in its toolbox known as alternative administration, or active water resource management. Riseley-White of the Interstate Stream Commission said this allows the state to decide with stakeholders “how the cuts are made and in what order and with what water users.”
“We’re really lucky that we have that statute here in New Mexico because it allows us to work with communities on plans that more align with their values and concerns,” she said.
The agency is working with major water rights holders to determine what happens if the state needs to curtail water use beyond the voluntary purchase program. The confidential mediation includes EBID, the city of Las Cruces and New Mexico State University, all of which hold extensive water rights. The parties have until October to reach an agreement. New Mexico also has to submit a Rio Grande management plan within two years as part of the settlement.
Amanda Wyatt, a spokesperson for the university, confirmed that it is participating in confidential discussions about water administration but declined to comment further. The city of Las Cruces declined to respond to questions, citing the confidentiality of the negotiations.
The university, Las Cruces and EBID were also amici, or friends of the court, in the Texas v. New Mexico case, which allowed them to file briefs.
“All water users in the [Lower Rio Grande], including the New Mexico Amici, have a direct
interest in how New Mexico will administer water to comply with the Compact Decree and Groundwater Settlement Agreement,” wrote state engineer Elizabeth Anderson in a brief last year. “My hope is that the New Mexico Amici, New Mexico, EBID, and the United States will agree to a plan for alternative administration.”
“The 18,200 acre-feet is only the beginning,” said Gaume, of New Mexico Water Advocates, referring to the amount of water usage New Mexico must reduce over the next decade.
Gaume worries that New Mexico, without presenting a comprehensive plan at the outset, will allow more deficits from groundwater pumping to add up in the meantime. He said the threat of priority administration can be a powerful motivator to get stakeholders to reach a collaborative agreement for reduced groundwater pumping.
“A good outcome in October would be to work together on a plan instead of continuing to litigate their differences,” he said.
The Arizona Canal cuts through Phoenix. Photo: Brett Walton/Circle of Blue
This story was originally published by Circle of Blue on July 7, 2026.
The Colorado River, from one viewpoint, is a mess.
The iconic waterway, fundamental to the region’s modern existence—its desert metropolises, its high-tech industries, its agriculture, and its recreation economy—is on the verge of crashing. A two-decade drying trend, aided by carbon pollution in the atmosphere and water use that exceeds supply have nearly drained the basin’s liquid savings accounts.
Nature is now threatening to overwhelm human interventions. Lake Powell is 28 percent of its capacity. Lake Mead, just 24 percent. Climate pressures abound in these hot, dry times. A March heat dome obliterated temperature records. Snowpack was the worst on record. At least five fires larger than 25,000 acres are currently burning in the parched basin.
The basin’s seven states, unable to find consensus on how to live with a shrinking supply, are deadlocked after four years of attempting to negotiate the river’s management rules. State and federal authorities are deciding how much less Colorado River water will be available, anticipating that the reductions will hurt. Knowing that water enables economic growth, they don’t want to be viewed as selling out their constituents.
Look closer, however, and the narrative of warring factions fades a bit. At the local level, water managers are collaborating to ensure residents and businesses have adequate water supplies. They are signing multiparty deals and pursuing joint projects to share resources and keep water flowing to homes and businesses. Such dealmaking is not a remedy to all that ails the basin. But it is viewed as essential in a time of deep climate uncertainty and anxiety.
In June, six water suppliers in Arizona, California, and Nevada signed a memorandum of understanding with the Bureau of Reclamation, a federal agency, to facilitate interstate exchanges of desalinated and recycled water for Colorado River water. The exchanges, taking advantage of spare treatment capacity on the California coast, would introduce new water into a depleting basin.
Earlier this spring, Phoenix, Tucson, and other Arizona water users announced a venture to create an emergency reserve of water for cities facing shortages and to simplify voluntary water transfers in the state — “an easy button” to move water to where it is needed, said Max Wilson, Phoenix’s water resources management adviser.
And in New Mexico, Santa Fe’s water utility is in early talks with neighboring pueblos about joint infrastructure for storing water underground, recycling water, and sharing water between systems in case wildfire pollutes a water source and renders it unusable.
“Cities have the ultimate responsibility to make sure there’s tap water,” said Kathryn Sorensen of Arizona State University and the former director of the Phoenix water utility. “And that means they have to be constantly vigilant and constantly innovate and constantly find new arrangements and new supplies.”
These arrangements, while not a new development, have taken on greater significance as the American West struggles through record heat and aridity this year that is an indicator of worsening water supply challenges in the drying region. Based on a decades-long track record, these arrangements also illustrate that neighbors helping neighbors can be a cost-effective form of climate adaptation.
“It makes sense to me that this happens at the local level because that’s where the risk is,” Sorensen said. She cited the Central Arizona Project, or CAP, as another example. CAP delivers Colorado River water to Phoenix, Tucson and other customers in the state’s populous midsection.
“The risk to the CAP of there not being water in the canal is that the CAP doesn’t deliver water to its contractors and subcontractors,” she said. In other words, a contractual failure.
But for the cities who hold those contracts? A failure to deliver water would hasten a public health and economic crisis. “The risk to a city is there’s no tap water,” Sorensen said. “And that’s just a totally different level of risk. So you see these types of innovations happen at the level where the risk exists.”
Collective action
Partnerships do not happen spontaneously. They are the product of months and years of discussion, negotiation, and relationship building.
“The biggest challenge is communication, understanding the needs of your partners and clearly their sensitivities,” said Bill Schneider, the Santa Fe water resources manager.
Schneider is part of discussions with four pueblos in the Santa Fe area on joint water infrastructure projects, including water recycling and underground storage.
One clear possibility is that Santa Fe could connect its water system to the Pojoaque Regional Water System, which will serve Pojoaque, Nambé, San Ildefonso, and Tesuque pueblos with Rio Grande water.
Connecting neighboring systems is a form of insurance, Schneider explained. Wildfires are a perpetual risk in the watersheds of northern New Mexico. If a severe wildfire sends ash and debris into the Rio Grande, the polluted water could force water systems to shut off their river intakes. It has happened before on the Rio Grande. The Albuquerque Bernalillo County Water Utility Authority had to close its intake for two months in 2011 after the Las Conchas fire. With an interconnected system, water could be delivered to the pueblos from Santa Fe’s other sources, which include the Santa Fe River and groundwater.
Due to the high cost of building infrastructure, system interties and similar partnerships make financial sense, Schneider said. “It means you don’t have to go out and build an entirely new system.”
These infrastructure arrangements already exist in many places, but especially in Arizona. Nevada, for instance, has banked part of its Colorado River allocation underground in Arizona for more than two decades.
A decade ago, when Sorensen was the director of Phoenix Water Services, Phoenix and Tucson signed a trailblazing water deal. It allowed Phoenix to bank some of its Colorado River water underground in Tucson. When the water is needed, Tucson will be able to pump the groundwater and, in exchange, Phoenix will take some of Tucson’s share of Colorado River water. The deal, which has not yet had to be exercised, makes the most efficient use of the water treatment capabilities and infrastructure in the two cities.
That agreement, Sorensen said, paved the way for other exchange partnerships in central Arizona. Mesa, in a project completed this year, provides treated wastewater to the Gila River Indian Community in exchange for 8,000 acre-feet of Colorado River water. (An acre-foot —326,000 gallons — can supply about 3.5 households in urban Arizona for a year.)
In Sorensen’s view, dealmaking is fundamental for utility leaders.
“They’re good horse traders, right?” she said. “That’s part of the job. ‘How can we make a win-win exchange or trade here that makes everyone happy and maximizes the resource?’ The water managers are really good at that.”
The latest iteration is the Secure Water Arizona Program, or SWAP, that Phoenix and Tucson are developing with other central Arizona cities.
Details are still being finalized, but the program will have three components. One is an emergency reserve of water that cities can tap as a last resort. A second piece is facilitating water exchanges between willing sellers and willing buyers. The third element is what Wilson calls “the sandbox” — a forum for collaboration on the next generation of central Arizona water projects.
The idea, said Max Wilson, the Phoenix water adviser, is a form of mutual aid. “At its core, the assumption of the SWAP is that water users shouldn’t be letting other water users go dry.”
Even with the benefits, Wilson acknowledged that collaboration needs to be carefully calibrated.
“People don’t want to see water being forcibly reallocated, for sure,” he said. “People don’t want to see their water going to uses that they necessarily wouldn’t see as beneficial. But when people have legitimate needs, I’ve been really impressed by how the water user community has come together and been willing to say, ‘Let’s talk and let’s figure out what a potentially mutually beneficial solution to those needs could be.’”
A Microsoft data center in Cheyenne’s Business Parkway on June 8, 2026. (Ryan Dorgan/WyoFile)
This story was originally published by WyoFile on July 15, 2026, and has been updated to include Meta’s appeal of the Cheyenne Board of Public Utilities violation notice.
The contamination of a Cheyenne water system by a Meta data center underscores the worries residents have about more than two-dozen data centers that are and could be consuming Wyoming’s energy, water and landscape.
Water officials announced in June that they had traced an unusual and dangerous bacterium called Cupriavidus gilardii, which can sicken people, to an industrial user first identified by the Wyoming Tribune Eagle as a contractor for a Meta data center.
Pinpointing the source of contamination came months after the discovery of the bacterium in late February. The pollution forced the city to stop irrigating sports fields and parks with recycled sanitary sewer system water, drain and disinfect the system and use drinking water for irrigation instead.
Although it took months to find the source, Cheyenne eventually “immediately and permanently terminated” discharge privileges, the city utility office said. U.S. Rep Harriet Hageman demanded answers from Meta Platforms CEO Mark Zuckerberg while the International Business Times howled “Meta’s ‘Good Neighbour’ Image Crumbles.”
On Monday, Meta appealed the city’s violation notice, requesting more information on the testing and data used to identify the source, the Wyoming Tribune Eagle reported.
As Wyoming communities grapple with a surge of rural zoning changes to enable construction of data center computer warehouses and offices, the pollution raises questions about developers’ and tech companies’ assurances.
Thirteen miles east of Wheatland, a proposed data center on 5,344 acres has “taken my family by surprise,” said Kathryn Stevens, who moved from Washington state to her family’s property several years ago seeking a rural lifestyle.
“These companies are taking advantage of rural communities that don’t have regulations in place for these facilities,” she told WyoFile.
Developers in Cheyenne, Casper, Evanston and Wheatland tout water-friendly closed-loop cooling systems, on-site power sources, jobs, money and more. But the pollution that snuck up on a city of roughly 66,000 required “significant remediation,” Cheyenne water officials said, and underscores what can go wrong in semi-arid Wyoming.
Wyoming’s capital, for example, can’t even slake its own thirst. Cheyenne obtains through diversions and a paper swap half its water from the far side of the Continental Divide — 115 miles away — where the Colorado River Basin itself is troubled and oversubscribed.
“Water for irrigation, like that in the reuse system, is a precious resource that cannot be wasted or taken offline,” Hageman wrote Zuckerberg. “I am even more concerned that this contamination seemingly came from your facility’s closed-loop cooling system, a technology that is marketed as being a solution to high data center water consumption rates.”
Info slow in coming
The Cheyenne Board of Public Utilities and the EPA this week declined to comment on the responsibilities each may have for overseeing the sanitary sewer system. The utility said it expects to release more information this week.
Meantime an organization called Data Center Map counts 31 completed or planned data centers in four markets in Wyoming, not counting the one recently proposed east of Wheatland.
About an hour’s drive south, Microsoft plans to purchase more than 3,000 acres of ranch land owned by the family of Wyoming’s U.S. Sen. Cynthia Lummis for its data center expansion plans south of Cheyenne.
On the other side of the state, Prometheus Hyperscale is working with the town of Evanston and Uinta County to build the company’s flagship data center on a 4,100-acre ranch. “Project Torch” would have up to 1.2 gigawatts of power by the end of 2029, enough electricity to power somewhere between 500,000 and a million homes at any given time, according to the Nuclear Regulatory Commission.
The latest proposal to rezone 5,344 acres for the Wheatland project drew more than 400 comments when described on the Wheatland News and Events Facebook page. The Site Layer 4 project there is proposed by a New York firm on the Lazy V Six ranch that seeks a change from the ranching/agricultural/mining zone to an industrial classification. The proposal is scheduled for an Aug. 26 hearing before the Platte County Planning and Zoning Commission.
Comments such as “We don’t want it,” “Look at the current water crisis,” “Put in NY,” typified some of the opposition. New York Gov. Kathy Hochul decreed this week the nation’s first statewide moratorium on new hyperscale data centers. But some commenters on the Wheatland project see promise; “No one wanted the power plant [but] Wheatland grew tremendously instead of dying off,” one poster said.
It would be one thing, Stevens said, if industry was patient, if developers asked a community if it could be ready in a year to accept a zone change application.
But the issue “has been jammed down our throats,” Stevens said, “before we can make regulations [or] know what’s safe or what’s not.”
The proposed Platte County zone change would “enable the highest and best use of land” and result in $26 billion in investments in Platte County, the application states. The development would accelerate innovation, strengthen cybersecurity, support allies “and counter China,” Site Layer 4 states.
Public worries across the state prompted action by Gov. Mark Gordon. In early June he signed the executive order “Data Centers the Wyoming Way” to establish a framework for development.
“The order sends a clear message,” the governor said in a statement. “We welcome technological innovation, but it will be done on Wyoming terms.”
Candidates weigh in
Gubernatorial candidates are weighing in. Republican candidate Brent Bien called for repeal of a 2010 bill he said gave “significant tax cuts” to AI data centers.
“Large corporations should not receive tax cuts that are unavailable to small businesses,” he said in WyoFile’s Election Guide 2026.
He would oppose new development of AI data centers “particularly on state and agricultural lands through the [State Loan and Investment Board],” he wrote.
GOP candidate Eric Barlow said proposals should be decided locally. “The state’s role is to protect water resources from misuse, prevent higher electricity rates, and help communities get truthful information if needed to make decisions,” he wrote.
Megan Degenfelder, another Republican candidate for governor, said developers should not build if their projects would increase rates for residents. She called for closed-loop cooling systems, Wyoming workers, workforce education and accommodation by the local community.
A data center worker checks operations in Casper. (Dustin Bleizeffer/WyoFile)
Democrat Kenneth R. Casner and Republican Curt Blake did not answer the survey.
Developers liken data centers to contemporary fast-access libraries where somebody can ask a question and readily get an answer. They do much more, however, housing complex computer programs and networks that would be difficult to replicate at a home or even business.
Contemporary computer needs — things like word processing, spreadsheets, cellphone videos, photography albums and digital image editing programs — are housed and supported in data centers. Warehouses of networked computers, whose functions are backed up and always available, are the foundation of these modern communication and lifestyle tools available from virtually anywhere.
Data centers are where your streaming movies are kept, waiting for you to click “play.” They are “the cloud” that is home to webpages from which you order your new puffy jacket and niece’s birthday gift, where you store the photograph of your granddaughter that you show off at work.
This field in the Uncompahgre Valley Water Users Association district has been fallowed this season due to a lack of water. Colorado officials say the amount of water the state can contribute to a conservation program will depend on hydrology. (Heather Sackett/Aspen Journalism)
In the culmination of a process that has been years in the making, Colorado officials Wednesday announced the creation of a state-run water conservation program.
In what officials are calling a “near-term contribution program,” the Upper Basin states (Colorado, New Mexico, Utah and Wyoming) will pay water users to voluntarily cut back in 2027 and 2028, using $100 million in promised funding from the U.S. Bureau of Reclamation. Colorado will now join Utah and Wyoming in setting up a conservation program within their respective states.
The noteworthy, long-expected announcement came at the regular July meeting of the Colorado Water Conservation Board, where board members considered the criteria for the program. A draft list says the program must, among other criteria, avoid negative community impacts; encourage contributions from across the state and water-use sectors; incentivize environmental benefits; encourage tribal participation; and build local drought resiliency. The board is scheduled to finalize the program criteria at its September meeting.
These types of conservation programs have traditionally targeted agricultural water users, often seen as the low-hanging fruit for water savings because they use the majority of Colorado River water. But officials are hoping this program will have participation across all water-use sectors, including municipal and industrial.
“I love that it is called a contribution program because that kind of imagines broader participation and engagement,” said board member Taylor Hawes. “So I think that is good. I think the more flexibility we can have, the better in a program like this.”
But details were scant on exactly how much water Colorado will contribute to the program and how the saved water would be used. And although some experts have begun calling for permanent reductions in water use, it remains — for now — a temporary, short-term program.
“We cannot guarantee a certain amount of water will be conserved in a given year because we don’t know how much water our water users are going to get,” said Amy Ostdiek, interstate section chief at the CWCB. “We have been clear that we just can’t do that.”
This field in the Uncompahgre Valley Water Users Association district has been fallowed this season due to a lack of water. The state of Colorado announced Wednesday that it will set up a conservation program using federal dollars, which means more fields on the Western Slope could soon look like this. (Heather Sackett/Aspen Journalism)
In a May letter to federal officials, the Upper Colorado River Commission said it has a goal of saving 100,000 acre-feet by the end of September 2028, which marks the end of water year 2028, but only if sufficient federal funding is available and hydrologic conditions allow. Colorado’s share of the Upper Basin’s allocation is 51.75%, meaning Colorado could be on the hook for 51,750 acre-feet over the next two years.
But Ostdiek said they are not at this time discussing a specific target that Colorado or the Upper Basin would have to contribute in exchange for the $100 million from the Bureau of Reclamation.
“We have felt confident that we can generate up to 100,000 acre-feet by 2028,” Ostdiek said in a Q&A session with the media after her presentation to the CWCB. “But really, what we’re going to be focused on is getting robust participation.”
It’s also unclear exactly how the saved water will be used. Officials said it’s not meant for use by the Lower Basin (California, Arizona and Nevada); it will be for the benefit of the Upper Basin. The water will need to have a home in Upper Basin storage buckets — Lake Powell, Navajo, Blue Mesa or Flaming Gorge reservoirs — but how it will fit into broader reservoir operations is unknown.
“I think that is going to be the subject of ongoing discussion, exactly how this water is used and characterized,” Ostdiek said. “I think what we know is that it needs to be credited to or subject to the discretion of the Upper Division states in some way.”
Conservation concept is not new
These types of programs that pay water users to cut back are not new to Colorado, and officials said they are incorporating the lessons learned from previous demand-management studies beginning in 2019, stakeholder input and pilot programs. The state participated in the 2023 and 2024 System Conservation Pilot Program, as well as an earlier version that ran from 2015 to 2018.
But conservation programs remain controversial. The Grand Valley Water Users Association, one of the largest irrigation districts on the mainstem of the Colorado River, did not allow its members to participate in SCPP for fear of negative impacts to other water users in the district.
All of the projects enrolled in SCPP involved agricultural water users on the Western Slope, a potentially risky situation, according to the Colorado River Water Conservation District. The Glenwood Springs-based agency, which represents 15 counties across the Western Slope, had tried to influence the creation of criteria for participation in SCPP to avoid negative impacts to rural agricultural communities.
Ultimately, only the Upper Colorado River Commission determined who got to participate in SCPP. Now, it seems state officials are taking to heart the River District’s recommendations. River District General Counsel Peter Fleming thanked Ostdiek for including some of the criteria that the district had set forth in its principles about how to create a conservation program.
Fleming encouraged the board members to adopt variable pricing to account for the difference in the value of relatively cheap water on the Western Slope versus more-expensive water on the Front Range. Pueblo Water had wanted to participate in SCPP, but the $509 per acre-foot offered in 2024 to Colorado participants was too far below market value.
“You can see the variable economic values of the water assigned there and the need to have variable pricing in order to encourage widespread participation,” Fleming said.
The River District’s position is that the entire burden of a conservation program shouldn’t be borne by the Western Slope, but must also be shouldered by Front Range water providers, who collectively deplete the Colorado River basin by about 500,000 acre-feet a year.
He added that a program should also have a strong element of local control.
“The River District obviously would like to stay involved in this process,” he said.
The Colorado River flows into the upper reaches of Lake Powell, one of the Southwest’s largest reservoirs. Storage in Powell is set to reach record lows, prompting some state leaders to seek out new conservation programs. (Alexander Heilner/The Water Desk)
The creation of a conservation program for Colorado comes at a critical time for the basin, which remains locked in the grip of a historic drought, with combined storage in Lake Powell and Lake Mead at an all-time low since the reservoirs began filling. Although the Upper Basin has argued that it has never used its entire allocation granted by the 1922 Colorado River Compact (and therefore shouldn’t have to cut back), in the face of dwindling flows and calls for conservation from its downstream neighbors, the four states can no longer avoid reducing their water demand.
The Colorado River basin is also in the midst of a management crisis, with the seven states that share the river still unable to find agreement on a new framework after more than two years of failed negotiations. The current guidelines for how shortages are shared and how reservoirs are operated expire this year, and the feds are poised to step in with their own management plan, expected later this month.
The Upper Basin would need separate parallel agreements with Reclamation alongside the federal management plan to account for and get credit for water saved through the contribution program.
In her presentation, Ostdiek gave a preview of Reclamation’s expected plan, which could allow for a pool in Lake Powell to store up to 3 million acre-feet conserved by Upper Basin states. But board chair Barbara Vasquez worried about overestimating the amount of water that could be contributed given the recent historically dry conditions. Farmers and ranchers across Colorado are now experiencing the fallout from the worst snowpack on record in the form of shortages and fallowed fields.
“So prior programs, we spent a lot of money for very little water conserved. I worry that next year may be even worse than this year, and it’s not willingness, but ability,” Vasquez said. Given the water that’s available, she said, “that might disappoint expectations on the part of the negotiators at the table for the Colorado River.
Aspen Journalism is a nonprofit, investigative news organization covering water, environment, social justice and more. Visit aspenjournalism.org.
Last year, the town of Estancia, N.M., asked residents to conserve water because its wells were not producing adequately. Credit: Town of Estancia
This article originally appeared on July 1 on Inside Climate News, a nonprofit, non-partisan news organization that covers climate, energy and the environment. Sign up for their newsletter here.
Following years of drought, the wells in Estancia, N.M., are running dry.
After declaring a water emergency last week, the small town in Torrance County is hauling in water to fill its pipes. Estancia has also reduced water sales to the Torrance County Detention Facility, a federal immigration detention center run by the private contractor CoreCivic. The detention facility, Estancia’s largest commercial water customer, has resorted to trucking in water.
In the midst of the crisis, Estancia Mayor Runnel Riley has taken a leave of absence. During a Board of Trustees meeting Tuesday evening, Estancia’s elected leaders passed a vote of “no confidence” in the mayor. The state has provided funding to drill a new well, and Estancia will be opening the 30-day bidding process this month.
Dozens of residents attended Tuesday’s meeting in person or virtually to voice their frustration about the water problems and delays in drilling a new well. When asked by a reporter for the Mountainair Dispatch, board trustees said they did not have data available on what proportion of the city’s water goes to the detention facility. Estancia is home to 1,400 people, and up to 800 people can be detained at the facility.
Ryan Gustin, senior public affairs director at CoreCivic, said the company implemented contingency plans once it learned of the water emergency. He said that the Torrance County Detention Facility has brought in additional water supplies, and the water emergency has not impacted its operations.
“Drinking water is always available within our housing units and bottled water has been provided in addition to the readily available drinking water containers,” Gustin said.
Roy Hubbard, Estancia’s deputy clerk, told Inside Climate News that the town is meeting with CoreCivic on Wednesday to discuss next steps. The detention facility has been the subject of complaints about sewer and water problems in the past.
A detention center, a drought and years of delay
The current water shortage is not Estancia’s first.
Last year, Estancia asked residents to conserve water because its wells were not producing adequately. In 2024, the town issued a similar call.
Overpumping has caused significant declines to the groundwater level in the Estancia Basin aquifer, which the town relies on, according to the New Mexico Groundwater Alliance. The Office of the State Engineer, which regulates water rights in New Mexico, closed the Estancia Basin to new water rights. However, the office predicted that if existing water rights remain in use, the groundwater level will continue to decline.
New Mexico, including Torrance County, is experiencing severe drought. State officials expect groundwater supplies to further diminish because of higher temperatures and changes in precipitation patterns due to climate change.
Estancia elected Runnel Riley to replace the incumbent mayor in November 2025 by a mere five votes. However, Riley stopped attending trustee meetings as the town’s water problems became more severe.
State Rep. Stefani Lord, a Republican who represents Torrance and Bernalillo counties, said at Tuesday’s meeting: “I called the mayor in January. He has never returned my phone calls.”
“Just get the well finished. That is the short-term problem,” she said. “There are all kinds of things we can do in the future. But for this moment, we just have to focus on getting this done.”
State Rep. Stefani Lord addresses the Estancia Board of Trustees during a June 30 public meeting. Screenshot: Torrance County webstream
During the meeting, the trustees also voted to prohibit fireworks over the 4th of July weekend. The town still plans to hold a fireworks display, but private citizens will not be allowed to set off fireworks because of the ongoing drought and the risk of fires during the water emergency.
Hubbard, the deputy clerk, said that as of Saturday, trucks had delivered 116,700 gallons of water to the town. He said that water supply to CoreCivic will “gradually be turned back on” when there is more water available. According to reporting in the Mountainair Dispatch, more than 80 percent of the town’s water goes to commercial customers. However, town officials have not clarified how much of that share goes to CoreCivic.
During Tuesday’s meeting, in response to questions from a Mountainair Dispatch reporter, Mayor Pro Tem Albert Lovato said that providing up-to-date information on the town’s water supply is difficult because of the fluctuating population at the detention center. “Our population goes up and it goes down because of CoreCivic,” he said.
The detention center has been a source of controversy for years.
The Department of Homeland Security’s Office of the Inspector General documented unsanitary conditions at TCDF in 2022, including “clogged toilets, broken sinks, inoperable toilets, water leaks, and mold.” The Innovation Law Lab, an immigrant and refugee rights organization, has also documented complaints from detainees at TCDF about sewage overflows and restricted access to water.
“There have been no sewage issues at TCDF because of this situation, nor were there any sewage issues in 2025 related to any water supply issues,” said Gustin, the CoreCivic spokesperson. “At no point have those in our care been without drinking water.”
The New Mexico Environment Department (NMED) enforces health and safety regulations at TCDF. Agency spokesperson Drew Goretzka said that, following a 2025 inspection, TCDF has addressed potential deficiencies with the sewer system.
“NMED is supporting the Town of Estancia through emergency response coordination, including requesting assistance from other state agencies to provide alternate water sources,” Goretzka said. “The Department is in communication with the Town and its contractors to resolve the immediate water shortage issues.”
Immigration and Customs Enforcement deferred questions about the facility to CoreCivic.
The federal agency has expanded its detention capacity under the Trump administration. ICE purchased numerous warehouses around the country to open new detention facilities this year for immigrants who are in deportation proceedings. ICE has been detaining an increasing number of people with active immigration cases seeking to stay in the country. Many residents in these communities, from Texas to Pennsylvania, have raised concerns whether local infrastructure could support the increased water demand from detention centers.
The main boat ramp at Wahweap Marina was unusable due to low water levels in Lake Powell in December 2021. Water levels are projected to soon fall even lower than this at the nation’s second-largest reservoir. Credit: Heather Sackett/Aspen Journalism
This story was originally published by Aspen Journalism on June 30, 2026.
Western Slope lawmakers had harsh words for water managers at a state committee hearing last week, questioning whether Colorado has done enough to avoid a lawsuit with its downstream neighbors.
Colorado Sen. Dylan Roberts, a District 8 Democrat who represents several Western Slope counties, including Eagle, Grand, Garfield, Routt and Summit, asked Colorado’s lead negotiator, Becky Mitchell, whether the people of Colorado should have confidence that negotiations among the seven states that share the Colorado River have put the state in the best possible position. The states have been at an impasse for more than two years without a deal for future management as reservoirs continue to decline to record-low levels.
“My constituents just see fighting and intransigence,” Roberts said. “And it’s concerning to me, especially as a Western Slope lawmaker … that the strategy is just ‘Let’s hire more lawyers; we’re going to court no matter what.’ That doesn’t give me confidence, because I don’t think Colorado fares well when we go to court against Arizona and California and Nevada, throwing our fate to the nine justices on the U.S. Supreme Court.”
The remarks came at Thursday’s meeting of the state Water Resources and Agriculture Review Committee in Denver. Along with Mitchell, in the hot seat were state engineer Jason Ullmann and Amy Ostdiek, interstate section chief at the Colorado Water Conservation Board. The three are employees of the state Department of Natural Resources and have the backing of the Attorney General’s office in negotiations.
Roberts’ line of questioning seemed prompted by recent projections that show river flows dipping below a threshold that could trigger litigation. The Lower Basin states (Arizona, California and Nevada) believe that the Upper Basin states (Colorado, New Mexico, Utah and Wyoming) are bound by the 1922 Colorado River Compact to deliver 82.5 million acre-feet of water over a 10-year rolling average. According to the Upper Colorado River Commission, the 10-year average will dip later this year to about 81.3 million acre-feet because of persistent drought.
Some experts believe that this amounts to a “tripwire” that could trigger a lawsuit from the Lower Basin states (Arizona, in particular, has been openly preparing for litigation) that could result in mandatory cuts in water use for the Upper Basin. Upper Basin water managers don’t subscribe to this interpretation, saying their states are only required not to deplete the river’s flows by more than 75 million acre-feet over 10 years.
Mitchell was reluctant to share details of Colorado’s legal strategy in a public forum, but she answered “absolutely” that her team’s work was putting Colorado in the best position. She said cutting back prematurely just to satisfy the Lower Basin’s interpretation of the century-old agreement would be bad for the state.
“If we initiate curtailment now, that is worse for Coloradans,” Mitchell said. “I think that is an important thing to remember.”
Wracked by drought, climate change and a management crisis, the situation on the river has never been more dire. The current management guidelines expire this year, and in the absence of a seven-state deal to share shortages and operate the nation’s two largest reservoirs, Lake Powell and Lake Mead, the feds are poised to step in. The U.S. Bureau of Reclamation plans to release a more detailed, short-term plan to manage the river for the next two years by mid-to-late summer.
State Rep. Julie McCluskie, a District 13 Democrat, said communities in her district have been living with the incredible angst, anxiety and pain of no snow and low reservoirs.
“The frustration I hear in my community is that we have missed multiple deadlines; they are becoming a funny joke,” McCluskie said. “There is such a fear about the lengthy litigation process, the fear of an outcome that is far worse for Colorado than a compromise that we have some control over.”
Conservation conversation is the ‘bare minimum’
Lawmakers also had strong words for state officials regarding conservation, saying legislators must be involved in the creation of any program.
Colorado has dabbled with pilot conservation programs in the past, but traditional programs that pay farmers and ranchers to temporarily cut back on water use remain controversial. This is especially true on the Western Slope, which has long been the target for these types of programs, and where some worry that they could harm rural communities if not done carefully. After two years of exploring how the state could set up a temporary, voluntary and compensated conservation program, officials shelved the idea in favor of focusing on drought-resilience initiatives.
“Other states out of the seven have very clear and actionable roles for their general assemblies, their legislatures,” McCluskie said. “We have less so, and yet the stakes are so high. So I beg of you, decision-makers, that it is essential that we be a part of those next steps.”
Ostdiek said that any program would need to start slow and make sure it incorporates input from people throughout the state.
“I think that we can continue to assess as we go what we might need from you all, and what a program like that might look like,” Ostdiek said. “I think what we can certainly commit to is continuing this dialogue and continuing the discussion about what we might need to make this a success.”
In 2023, Colorado lawmakers tried to force stakeholders to come up with recommendations on conservation programs by creating a statewide task force, which met 10 times over six months. But the group failed to find a consensus, with some saying it was “premature” to create a conservation program.
As part of a post-2026 framework, the Upper Basin states plan to create a “contribution” pool in Lake Powell, which could be used to help stabilize the system, keeping water levels above critical thresholds to protect hydropower at Glen Canyon Dam and acting as an insurance pool against forced cutbacks. In a May 22 letter to federal officials, the Upper Basin states said they have a goal of saving 100,000 acre-feet by the end of water year 2028, but only if sufficient federal funding is available and hydrologic conditions allow.
Three Upper Basin states have different methods for contributing to this pool: Utah has its own demand management program; Wyoming lawmakers passed a law this year allowing for a conservation program; and New Mexico plans to release water from Navajo Reservoir.
But precisely how — and how much — Colorado would contribute to this pool is unclear. The state’s share of the Upper Basin’s allocation is 51.75%, meaning Colorado could be on the hook for 51,750 acre-feet.
And ensuring that saved water actually gets into a pool in Lake Powell remains part of the problem. Currently, conserved water that stays in the river can just be picked up by a downstream user, with no net gain to Lake Powell. Colorado officials say they do not have the authority to “shepherd” water past other water users to the state line unless it is specifically for compact compliance.
Last year, some Delta County ranchers asked lawmakers to take up the issue and pass a law that would address this issue, allowing water users to conserve and get credit for contributing water to a Lake Powell pool. But legislators did not take up a bill in the 2026 session.
Colorado officials told lawmakers they were continuing to explore what a program might look like and whether legislation would be needed.
Roberts said conversations with the legislature should be the bare minimum if Colorado is going to have a conservation program.
“If the department or any agency of the state were to pursue a conserved consumptive use program or demand management program that used state tax dollars to pay for it and did not go through the legislature in a formal process, I imagine that all of us on this panel and many of our colleagues would raise holy hell about the unilateral decision-making coming from Denver about programs impacting all parts of the state,” Roberts said. “So, please, let’s just cut that off at my recommendation. Let’s work together on this.”
Officials opened the hearing by highlighting the impacts of this year’s severe drought on Colorado’s farmers and ranchers, noting how even some of the most senior water users will experience shortages as streamflows dwindle. Orchards in the North Fork Valley and row crops in the Uncompahgre River Valley already have unprecedented shortages.
In response to Roberts’ concerns about the failure to find a compromise among the seven states, Mitchell posed a high-stakes rhetorical question: “I would ask, ‘What else do you think we can give?’”
Glen Canyon Dam and Lake Powell, one of the nation’s largest-capacity reservoirs whose operation has been a point of contention between the Upper and Lower Basins of the Colorado River. (Alexander Heilner, The Water Desk)
This story was originally published by Western Water on June 25, 2026.
For the past 20 years, the Colorado River has been operated under a set of guidelines negotiated between the seven states that depend on the river. Those guidelines expire this year, and after five years of grinding negotiations over a new agreement, the upstream states of Colorado, Wyoming, Utah and New Mexico remain deadlocked against the downstream states of California, Arizona and Nevada.
Some 40 million people and 5.5 million acres of farmland depend on the river’s water. But after the states failed to meet two federal deadlines in three months, the river is in a moment of unprecedented crisis. A dire snowpack has left flows just 15 percent of normal, many farms without water and several cities scrambling to secure water supplies as they gird themselves for shortages.
That has set up a showdown over a legal time bomb that’s been ticking away at the heart of the Colorado River Compact since the river’s guiding document was signed more than 100 years ago. The Lower Basin states believe the Compact promised them a minimum delivery of water sent down the river from the Upper Basin. The Upper Basin states believe the Compact promised them a fixed amount of water that they could rely on to meet future growth. As the river’s flows have dwindled, those two supposed guarantees are proving to be irreconcilable.
Experts have seen the showdown coming for a long time, but climate change has accelerated the day of reckoning. In 2000, a drought sunk its teeth into the river and hasn’t let up. Dubbed the Millennium Drought, it is now recognized as one of the worst droughts on the river in more than 1,200 years — and may actually be the beginning of a long-term shift to a drier reality.
Despite near-endless negotiations to find a way to keep the river’s massive reservoir system from crashing — an effort that began over two decades ago — the drought may have finally pushed the Colorado River Compact to its limit. Now, the system is nearly empty and runoff from this winter’s snowpack, the source of any water that might offer even a small hope of relief, will be among the lowest since Glen Canyon Dam was built near the Arizona-Utah border, creating Lake Powell, more than 60 years ago. Flows in the river are perilously close to hitting the primary legal “tripwire” in the Compact. Once that’s crossed, the Lower Basin states would likely try to force the Upper Basin to deliver their water apportionment downstream — a prospect long considered unthinkable.
“All those negotiations helped push the day of reckoning back further, and helped delay the inevitable,” says Doug Kenney, who heads the University of Colorado’s Western Water Policy Program. “But at some point, you just have to acknowledge the fact that the numbers don’t add up and you’re going to have to deal with it. We’re at that point.”
Two obvious paths now lie ahead. One is a courtroom fight, either against the U.S. Secretary of the Interior or a challenge between two states under the terms of the Colorado River Compact, which would go directly before the Supreme Court. A high court case would be a doomsday scenario, a messy and protracted legal battle that, until now, the seven states desperately sought to avoid. The other potential path is a stopgap fix, a short-term interim plan negotiated between the states or imposed by the Interior secretary. That could, at least temporarily, forestall a trip to court, but it wouldn’t resolve the fundamental conflict.
For more than two decades, however, the possibility of a third path has stubbornly persisted in the background: A “grand bargain,” an idea first proposed in 2005 by Colorado’s negotiating team early in the effort to grapple with the worsening drought. The concept was an unorthodox bid to defuse the ticking time bomb — but it would require each basin to trade away its most cherished claim on the river.
‘A wild idea’
Roughly 90 percent of the Colorado River’s flow originates as snowpack in the Rocky Mountains. One of the principal goals of the 1922 Compact, which is essentially a seven-state treaty, was to avoid future legal battles by creating an “equitable division and apportionment” of water between the Upper Basin states in the river’s headwaters and the faster-growing Lower Basin. The Compact apportioned 7.5 million acre-feet a year from the mainstem of the river to each basin. (An acre-foot is 325,851 gallons, enough to supply the average annual needs of roughly 3 households, depending on their location and climate.)
The Colorado River Basin spans seven U.S. states and is divided into Upper and Lower Basins. Lake Powell, upstream from the Grand Canyon, and Lake Mead, near Las Vegas, are the two principal reservoirs in the Colorado River water-supply system. (Bureau of Reclamation)
The Compact also contains a requirement that the headwaters states not deplete the flow of the river below 75 million acre-feet, plus another roughly 7.5 million acre-feet (half of the apportionment earmarked for Mexico), on a 10-year running average. Those provisions were intended to provide surety to the downstream Lower Basin states that they would receive their 7.5 million-acre-foot annual apportionment and that the basins would share equally in the Mexican obligation. If the 10-year running average requirement is violated, the Lower Basin states could — at least in theory — initiate a Compact “call” against the Upper Basin in an attempt to force the headwaters states to deliver more water downstream.
For roughly 80 years after the Compact was signed, the prospect of a Compact call was purely theoretical. Then the Millennium Drought set in. By 2005, the two flagship reservoirs on the Colorado River — Lakes Mead and Powell — were half empty.
The drought was pushing the river’s flows closer to a Compact violation trigger, making the risk of a call by the Lower Basin a growing probability. The Lower Basin, particularly Arizona, was insisting on guaranteed releases of water from Lake Powell. And because Colorado has the biggest share of the river within the Upper Basin and uses a greater portion of its apportionment than the other upstream states, it is most at risk. It began searching for a way to slip out of the legal noose of a Compact call.
In September 2005, the seven states’ top negotiators met in Albuquerque, New Mexico. During a lunch break, Colorado’s team made its pitch. The state’s negotiators proposed that the Lower Basin waive its right to force a downstream delivery through a Compact call. In exchange, the Upper Basin states would limit their water use to less than what’s strictly apportioned in the Compact, thereby reducing potential demand in the headwaters of Colorado and Wyoming that supply nearly the entirety of the river’s flow.
The offer was essentially a simplification and reframing of a dizzying array of technical disagreements over various provisions of the Compact — an attempt to throw spaghetti at the wall to see if it would stick.
“My recollection was that it was a pretty spontaneous proposal,” says Jim Lochhead, who had previously been Colorado’s top negotiator and in 2005 was continuing to serve as a legal advisor on the state’s team. “We weren’t making any progress, and it was pitched as, ‘If you really want to cut through all of this and get to the bottom, here’s a wild idea.’”
Jim Lochhead, who had previously been Colorado’s top negotiator and in 2005 was serving as a legal advisor on the state’s team.
The proposal sparked discussion among all the parties at the negotiating table but also raised difficult issues.
“It was a great concept on paper,” says Pat Mulroy, who was the head of the Southern Nevada Water Authority and Nevada’s principal negotiator at the time. “Whether it was politically doable or not is a whole other ball game.”
In large part, that’s because a grand bargain would have forced both basins to give up assurances in the Compact that they consider sacrosanct.
“I’m not sure the Upper Basin would ever have agreed to limiting their ability to fully develop their 7.5. It’s like giving up your birthright — I’m not sure they could have sold that at home,” says Mulroy. Conversely, she says, “giving up that call provision is really the only weapon the Lower Basin has.”
And, indeed, following its spontaneous birth in Albuquerque, the proposal ran into stiff political headwinds back home in Colorado, where it failed to get then-governor Bill Owens’ blessing.
“I wasn’t directly representing the state of Colorado at that time; I was representing Colorado water users,” Lochhead says. “And when I brought the idea back to the state, it pretty quickly got shot down: ‘No, we can’t agree to anything that would not keep the dream alive of 7.5 million acre-feet being developed in the Upper Basin.’”
The prospect of a grand bargain itself faded from discussion. And yet, in ways that aren’t often acknowledged, it continued to shape the broad contours of the negotiations that unfolded over the next two decades.
The quest to escape the noose of a Compact call has remained central to Colorado’s bargaining position.
“The concept of a waiver of a Compact call is alive and well,” says Anne Castle, a former assistant Interior secretary who is now a senior fellow at the University of Colorado. “The quid pro quo for that waiver has taken different forms.”
To a large extent, the details of the various offers the Lower Basin has made in exchange for a possible waiver — which have sometimes been characterized within the negotiations as “mini grand bargains” — have never become public. What is clear is that the two basins have consistently failed to cut a deal.
Instead, the seven states adopted a more incremental approach, negotiating a series of drought-protection agreements based on smaller, more politically palatable deals. While that’s been a safer path for everyone politically, it has brought other kinds of risk.
“It just added layer upon layer of Gorilla Glue and Band-Aids that’s made it much more complicated to try to unwind or develop new agreements,” Lochhead says, “and has obviously proven to be inadequate in protecting the system.”
A second life
While the concept of a grand bargain led a short life at the negotiating table, it has gone on to live a remarkable second life. The idea was picked up and revived by a loose-knit group of seasoned observers of Colorado River issues who, for years, have called for more durable alternatives to the patchwork of ideas in play among negotiators.
Eric Kuhn was a member of Colorado’s negotiating team when the grand bargain was proposed in 2005. At the time, he was the general manager of the Colorado River Water Conservation District based in Glenwood Springs and he has written thoughtfully and voluminously about the river’s problems. After his retirement in 2018, he partnered with John Fleck, a former journalist who is now author-in-residence at the University of New Mexico’s Utton Center, to write Science Be Dammed: How Ignoring Inconvenient Science Drained the Colorado River.
Kuhn and Fleck concluded the book by observing that “there is not enough water in the Colorado River for all the lawyers to be right,” and suggested the grand bargain as a way to avoid the courtroom.
“The basic idea of a grand bargain is, in lieu of litigation, we’re going to agree to something that both sides want,” says Kuhn.
He and Fleck weren’t the only ones who pushed for more serious consideration of the idea. Doug Kenney at the University of Colorado also has championed the concept. In 2012, he enlisted Kevin Wheeler, a widely respected engineer and fellow at Oxford University, to undertake modeling analysis of the kinds of trade-offs a grand bargain might require.
Persistent drought has lowered Lake Powell’s water level and exposed land that was once submerged at Wahweap Marina, as seen in this 2022 photo. (Bureau of Reclamation)
In 2021, Wheeler — together with a group of collaborators including Kuhn, climate scientist Brad Udall and Jack Schmidt, the director of Utah State’s Center for Colorado River Studies — published a white paper called “Alternative Management Paradigms for the Future of the Colorado and Green Rivers.” It was a comprehensive assessment of more ambitious strategies for weathering the drought and climate change than had emerged from now-perpetual negotiations between the states.
“New approaches that are responsive to significantly drier climate conditions and changing patterns of consumptive uses may require bolder policy initiatives that exceed the incremental approach of modern management,” the group wrote. “It is critical to explore alternative water management strategies that may extend beyond the framework of the Law of the River as presently interpreted.”
The following year, the team published a paper in the journal Science titled “What Will it Take to Stabilize the Colorado River?” And, it turned out, stabilizing the system would take something that looked a lot like a grand bargain.
Assuming the drought persists as it has since 2000, Wheeler and his partners identified two scenarios that would stabilize the river, both of which assumed the Lower Basin had waived its ability to make a Compact call. In one, the Lower Basin would need to decrease its water use by about 2 million acre-feet a year when Lake Mead and Lake Powell reach low levels. That would assure it of about 78 percent of its apportionment — an amount roughly in line with cuts it has already committed to taking. In exchange, the Upper Basin would have to cap its water use at 4 million acre-feet. But that’s only slightly more than half of its 7.5 million-acre-foot Compact apportionment, and roughly 300,000 acre-feet less than what it currently uses.
The second scenario — call it the “near-parity scenario” for simplicity — more equally distributed the Upper and Lower Basins’ relative cuts in apportionment. In it, the Upper Basin would cap its use at 4.5 million acre-feet, leaving it with 60 percent of its Compact apportionment. The Lower Basin would be able to use about 67 percent of its Compact apportionment when reservoirs are low, just slightly more percentage-wise than the Upper Basin. But it would have to cut its uses by 3 million acre-feet below its apportionment.
That would stabilize the system — or at least go a long way toward doing so — while largely meeting existing water demands in both basins. The Upper Basin currently uses about 4.3 million acre-feet per year. The Lower Basin, after ramping up an aggressive water conservation effort since 2007, has driven its annual use down to about 6 million acre-feet per year, and has signaled that it could likely reduce demand further.
But it would leave practically no leeway for future growth, at least without reshaping the socioeconomic landscape across the entire Basin. In particular, any future urban growth could come only by shifting significant amounts of water from farms to cities.
Hard math
Today, there is a simple, hard reality on the Colorado River: The available water supply is already maxed out. Water use throughout the basin needs to be reduced by roughly 25 percent just to make the numbers work now — to say nothing of the future, which is likely to be significantly drier.
In Colorado, that has raised hard questions about fairness, the “equitable division and apportionment” provision of the Compact, and the assurance the state thought it had that its water would be there to develop when it’s finally ready.
“Everyone agrees that there should be an equitable division of water, and the word ‘equity’ is one that everyone will rally around,” says Kenney. “But does equitable mean equal? That’s the crux of the issue.”
Over the past several years, Colorado’s attorney general, Phil Weiser, has been building his office’s staff of water lawyers. This January, Weiser, who is currently running for governor, appeared before a joint hearing of the state legislature’s judiciary committees.
“If we can’t get a deal — and I’m committed to not getting a bad deal just to get a deal — we’ll be in litigation. We’re ready for it,” he said. “If and when we can get a reasonable deal based in reality, I’m for it. But if we can’t, then we will be falling back on our rights under (the) 1922 Compact.”
Because of the peculiarities of the water-rights hierarchy in the Lower Basin, Arizona is arguably most at risk there. In March, that state — whose governor, Katie Hobbs, is running for re-election — retained the high-powered law firm Sullivan & Cromwell to represent it in potential Colorado River litigation. At the time, a spokesman for the governor said, “it’s critical that Arizona be prepared to defend ourselves in court if an agreement cannot be reached or the Law of the River is violated.”
Anne Castle, former assistant secretary at the Department of the Interior.
“It is very difficult for a political figure — and they’re all political figures, even if they’re not elected — to agree to reduce the water use of their constituents and keep their career alive,” says Anne Castle. “They have to be able to tell their constituents, ‘I’m fighting for your water. I’m doing everything I can to keep your water secure, and it’s the other guy’s fault.’ The political incentives are directly at odds with the kind of compromise that’s needed in this type of hydrologic situation.”
Following the breakdown in negotiations between the Colorado River states, the federal government has announced its intention to step in. In May, the Bureau of Reclamation, on behalf of the Department of the Interior, revealed that it is preparing the first of what could be a series of five two-year interim plans for the river.
The final details are expected to be released this summer. But the federal government has indicated that the Interior secretary could cut water deliveries to the Lower Basin states by up to 3 million acre-feet — 40 percent of their Compact apportionment. During a briefing for Arizona water users in May, Brenda Burman, the head of the Central Arizona Project, presented modeling analysis of the proposed reductions and noted that, given the diminished releases from Lake Powell, the Upper Basin is “in a definite breach of the Compact by Sept. 30 of 2026.”
Owing to some quirks of river history, the secretary debatably has less authority in the Upper Basin, and so Reclamation has proposed no cuts there. But as climate change continues to eat away at snowpack and river flows, the Upper Basin states will likely be forced to cut back their uses anyway. Regardless of what the Compact says the Upper Basin gets, the water simply won’t be there.
And so now the seven states are facing a situation eerily similar to those in the near-parity scenario Wheeler and his colleagues laid out in their Science paper four years ago — but without a bargain.
Coming full circle?
In many ways, the prospects have never been worse for something like a grand bargain. Yet the fundamental problems the grand bargain was intended to solve have only grown sharper in the 20 years since it was first proposed.
“The grand bargain has gotten a bad name,” Kuhn says. “But if these issues aren’t resolved through a grand bargain, they’re going to be resolved through litigation.” In 2007, he says, the river’s reservoirs still had ample water to work with. “With empty reservoirs, you cannot finesse these issues.”
Water level in Lake Mead, impounded behind Hoover Dam, barely reaches the bottom of the two intake towers in 2022, showing the effects of more than two decades of drought. (Bureau of Reclamation)
Litigation could come as soon as August, when Reclamation will likely release a record of decision for its proposed new operating plan. Legal action could take one of several paths. The one with the highest stakes would be direct enforcement of the Compact, likely in the form of a Compact call brought by Arizona and the other Lower Basin states against the Upper Basin states. Because the Compact is essentially a treaty between multiple states, that would go directly before the Supreme Court. But such cases are often grindingly long: Arizona’s 1952 lawsuit against California over Colorado River rights took a dozen years to resolve. A case in the Supreme Court could put the river in protracted litigation during a time of profound crisis.
Other, more limited challenges are possible, most likely against the Bureau of Reclamation or the secretary of the Interior for failure to comply with the Compact or violating environmental laws. But they, too, are not without risk.
“I have a hard time believing you could keep litigation contained, once that genie’s out of the bottle,” says Kenney. “I just have to believe that inevitably blows up into a full-fledged interstate litigation and it bumping right up to the Supreme Court.”
As the odds rise of a legal challenge to the Compact that could ultimately wind up before the highest court in the land, the fundamental tension the grand bargain was intended to resolve will likely be front and center before the justices. And, paradoxically, that could force the states themselves to finally make the really tough sacrifices they’ve been trying to avoid.
“I think that a road to a grand bargain runs through litigation,” says Kuhn.
That’s because in past interstate fights over shared rivers, the Supreme Court has typically appointed a water-law expert known as a special master to referee such cases. The most recent example is the dispute between Texas, New Mexico and Colorado over the Rio Grande. In that case, Kuhn notes, “the special master said, ‘You don’t want me or the court to decide this; get in a room and negotiate it.’ The special master kept the pressure on the states to negotiate.”
This May, the Supreme Court approved a settlement between those three states. Still, even that resolution only came a full 13 years after the case was initially filed, and it involves relatively small reductions in overall water use.
On the Colorado River, both water and time are in far shorter supply.
This field of alfalfa near Carbondale is grown with water from the Crystal River. Some Colorado River experts are advocating for a permanent reduction in the use of water by agriculture. Credit: Heather Sackett/Aspen Journalism
This story was originally published by Aspen Journalism on June 22, 2026.
Some Colorado River experts are floating a concept to address the basin’s water woes that is both radical and mundane: permanently reducing the amount of water used by agriculture.
Many cities have already reduced their water use in recent decades while adding residents, proving that population growth doesn’t have to be tied to an increase in water use. A 2024 study by Colorado River scientists found that agriculture is responsible for about 74% of water used by people in the basin, meaning urban conservation alone cannot solve the crisis.
“I think we need to have permanent reductions in use on the table and agriculture will have to be part of that,” said Anne Castle, a Colorado River expert and a former federal representative to the Upper Colorado River Commission.
Castle was the lead author on a June 1 paper that urgently called on the entire basin to permanently decrease consumptive uses to avoid the worst impacts to reservoirs and water users. Castle and the paper’s other authors are Colorado River experts and academics, and are the brain trust of the basin sometimes referred to as the Traveling Wilburys, a joking reference to the rock music supergroup. But their message is anything but humorous.
The latest paper says another dry winter would deplete remaining storage and result in devastating consequences like run-of-the-river operations where the nation’s two largest reservoirs can only release downstream the same amount of water that flows into them. It’s the last stop before deadpool, when levels are too low to release water. The authors urge water managers to act immediately to reduce use and avoid a system crash.
But permanently cutting the amount of water that goes to agriculture remains a controversial topic, and water managers from both the Upper and Lower basins say drying up land is not a solution for their basin. Most conservation programs up until now either have been temporary or have allowed the saved water to be used elsewhere. Castle said the problem is especially difficult when people’s livelihoods are on the line.
“The folks who are vulnerable to those kinds of permanent reductions are understandably resistant,” Castle said. “But there’s not enough water. The river won’t allow us to use the same amount of water that we’ve been accustomed to using in the past.”
The seven states that share the Colorado River are under increasing pressure to cut water use as one of the worst droughts on record threatens the water supply for millions of people. On the heels of one of the hottest and driest winters since measuring began, spring flows into Lake Powell this year are projected to be the lowest on record.
Much of the $4 billion from the Inflation Reduction Act earmarked for drought mitigation has gone toward short-term conservation. Water users in the Lower Basin states (California, Arizona and Nevada) were paid to temporarily leave water in Lake Mead. And in the Upper Basin (Colorado, New Mexico, Utah and Wyoming), the feds paid irrigators $45 million to leave fields dry during a two-year reboot of a pilot conservation program.
But in the midst of a climate change-fueled megadrought that has already robbed the river of at least 20% of its flows, experts say temporary measures no longer cut it. Water managers are reckoning with the reality that the river will probably never again deliver what was promised a century ago by the Colorado River Compact. The demand for water now far outstrips the dwindling supply.
“Are we going to continue to spend hundreds of millions of dollars a year and not have a permanent solution?” said author and Colorado River expert Eric Kuhn. “I think, at some point, it just makes economic sense to go ahead and say, ‘Let’s buy out the existing demand.’”
Hay bales stacked on a ranch just south of Carbondale. Much of the water in the Colorado River basin is used to grow forage crops for livestock. Credit: Heather Sackett/Aspen Journalism
Buying out demand
Against this backdrop, some in the academic community are advocating for the federal government to either set up a voluntary program to buy and retire lands that use a lot of water or pay landowners who agree to permanent restrictions on water use.
A paper released last year and authored by Kathryn Sorensen and Sarah Porter, who are Colorado River experts at the Kyl Center for Water Policy at Arizona State, lays out how this could be done. Eligible land would have to meet certain characteristics, including being in an area where the economic impacts of not using water are least painful and where impacted crops could be feasibly grown outside of the Colorado River basin, among others.
According to Porter, the federal government should be the entity that buys down demand. The large infrastructure projects funded by the feds in the 20th century are what created booming irrigated agriculture in the West to begin with. And the other entities in the basin that have the ability to buy agricultural water want to use it themselves, not keep it in the system.
“A reset in the Colorado River basin really is needed,” Porter said. “We have a lot of agriculture that’s really a legacy of how the United States was settled… . And now we’re grappling with overallocation and shortage and struggling to figure out a way to manage the Colorado River.”
The proposal is different from the much-derided “buy-and-dry” which usually involves an opportunistic transferring of water from agriculture to cities, not an overall reduction in water use. Still, the potential negative impacts to rural communities have to be considered.
“You have to have a provision for what happens to the land when you remove agriculture and what happens to the local economy when you remove agriculture,” Porter said.
And experts say there is a precedent for the type of federal buyouts that could help the drought-stricken river: the Bankhead-Jones Tenant Farm Act from 1937. This New Deal piece of legislation was a response to the Dust Bowl and allowed the federal government to buy and retire badly eroded or economically unproductive farmland.
The paper says a Colorado River program could start not with those that grow valuable vegetables in winter but, rather, with lands that use a lot of water but have low economic output. The paper says retired agricultural lands could be used for alternative purposes that support local economies such as recreational opportunities or low water-use industries.
Figuring out how to implement conservation programs without harming rural agricultural communities has been a main focus in recent years of the Colorado River Water Conservation District, which works to keep water on the Western Slope. River District General Manager Andy Mueller said that agriculture has a role to play in reducing water consumption, but that permanently retiring agricultural land is a misguided approach that will put the country in danger of not being able to feed itself. Programs should remain temporary, and focus on efficiency improvements and growing less-thirsty crops, he said.
“If it’s temporary, if it’s well-designed in a way that respects local communities, traditions and practices, is custom-built for each community in a way that really tries to do as little economic damage as possible — potentially even bringing some benefits to those farming families that participate — there are ways to do it,” Mueller said.
A tractor on a farm in California’s Imperial Irrigation District, the largest user of agricultural water in the Colorado River basin. A California representative says there is no interest in drying up ag land because it’s so extremely productive. Credit: Heather Sackett/Aspen Journalism
On the fringe
Although certain academics and experts are talking about permanently drying up agricultural lands as a means of saving water, the concept remains on the fringe of Colorado River politics. It’s both the third rail and the elephant in the room.
“It’s going to pull away from the fringe really quickly when you’ve got to really justify continuing to pay on an annual basis forever,” Kuhn said. “We’re just trying to get the discussion out there, make it acceptable to have the discussion.”
On top of the abysmal hydrologic conditions, the basin is also in the midst of a management crisis. After two years of negotiating, the Upper Basin and Lower Basin states have failed to reach a consensus on how they will share future cuts and have blown past deadlines to come up with a plan. The responsibility for river management now falls to the federal government, which is scheduled to release this summer a short-term operating plan for Lake Powell and Lake Mead.
Part of what makes the problem so tricky is that water managers are still guided by the Colorado River Compact, a century-old agreement that splits the river’s flows evenly between the two basins. Upper Basin water managers still cling to the notion that because their states are already living within the 7.5 million acre-feet of water allotted to them annually, cutbacks are the responsibility of the Lower Basin, which they say uses more than its fair share.
Becky Mitchell, Colorado’s lead negotiator in talks among the seven states, said that permanent dry-up of agriculture in the Upper Basin isn’t necessary because the Upper Basin states already send more than 8 million acre-feet — more than legally required — of water downstream per year. Dry-up may be part of the overall solution, she said, but each state should take its own individual approach to making cuts.
“Those durable reductions are going to be required (for the Lower Basin) to first get in line with their apportionment, but then getting in line with the available supplies is a whole ’nother conversation,” Mitchell said.
California’s representative, JB Hamby, said permanent fallowing doesn’t have a place in reducing the state’s demand either. California is home to the biggest urban and agricultural water districts, as well as the largest allocation of Colorado River water of any of the seven states that share the river.
“In the case of California, there’s no real discussion or interest whatsoever in the retirement of ag lands,” Hamby said. “Land in Southern California that receives Colorado River water is so extremely productive. There is a year-round growing season where every single day of the year there are things being grown.”
Past water savings in Southern California have mostly come from efficiency improvements on farms and in delivery systems, and from deficit irrigation programs in which water is temporarily taken off fields for part of a season. In the absence of a seven-state deal, the Lower Basin states have offered up 700,000 acre-feet of cuts per year through 2028, which is on top of an initial 1.5 million acre-feet in cuts. Most estimates say the basin needs to cut water use by 2 million to 4 million acre-feet.
“There’s full agreement that water should be reduced,” he said. “There’s not agreement in how or where it should be reduced. So the Lower Basin is moving forward, doing our thing, making reductions.”
Cowgirls wrangle a calf at a Delta County ranch. Farming and ranching are an important part of the heritage of the American West, which makes permanently reducing water for agriculture a tricky issue. Credit: Heather Sackett/Aspen Journalism
Ultimately, discussions about permanently reducing the amount of water that goes to farmlands in the basin remain difficult, in part because agricultural water rights are some of the biggest, oldest and most politically powerful in the basin. But there is also an attachment to the American West’s farming and ranching heritage.
“We love agriculture; it’s part of our roots,” Porter said. “We don’t like to think about losing agricultural production. I think we are generally hesitant to have that conversation, and we really haven’t had it as a basin.”
About90% of the University of Colorado Boulder’s campus is irrigated by water from Boulder Creek that runs through ditches. (Annie MacKeigan / The Water Desk)
In early June, water experts gathered at the University of Colorado Boulder to talk about the future of the Colorado River.
The lifeline for 40 million people in the Southwest is in dire shape. Too much demand and not enough supply has sapped its largest reservoirs. And in discussions of western water the finger-pointing on who is the best steward of the region’s scarce water can ramp up quickly.
So when a panel of state-level water negotiators took the stage, one finger pointed directly at the expansive green lawns outside the university’s law school building.
“There is a metric shit ton of turf grass on this campus,” said John Entsminger, Nevada’s top Colorado River negotiator, to the room of western water policy experts.
Entsminger used a less than precise measure, but CU-Boulder is blanketed in rolling quads, athletic fields, and decorative grass. Entsminger runs the Southern Nevada Water Authority, an agency that has prided itself on city-scale turf removal, and has said Las Vegas’s water conservation effort is the reason behind its ability to grow in population and stay within their Colorado River allocation.
College campuses across the nation play host to oasis-like landscapes. Some qualify as designated arboretums, others give shaded and grassy sanctuary to students, staff, faculty and community members. A beautiful campus is also a selling point for prospective students, which is why grounds and maintenance crews work year-round to upkeep the trees, shrubs and lawns.
But universities in the West are beginning to contend with water-intensive landscapes as water availability decreases. The approaches in finding the balance between a green, inviting campus and responsible water stewardship are a mixed bag. Some universities continue to irrigate away, while touting their sustainability goals, while others aim to set a new standard for university landscaping in the West.
In Boulder, ditch water rules the day
The University of Colorado Boulder irrigates most of their campus through the Anderson Ditch system — a senior water right that has been held since 1860 and pulls raw water directly from Boulder Creek. The senior rights allow the university to irrigate quads and landscaping features freely even though the city of Boulder has been under voluntary watering restrictions since April 1.
Following the city’s restrictions announcement in early April, CU Boulder addressed the issue in a statement, stating that, “the Outdoor Services team at CU Boulder uses all of these tools to make informed decisions about when to irrigate areas of campus, and for how long.” The statement broadly suggested students, staff and faculty conserve water by limiting watering to essential plants and trees, being efficient with water use, fixing known leaks, and being mindful of everyday use.
The University of Colorado Boulder’s irrigation ditches are visible from Norlin Quad, a central grassy area where students and community members gather. (Annie MacKeigan / The Water Desk)
CU did not respond to an interview request, but in an email response, the university said that only 10% of the campus uses potable city water for irrigation. The other 90% is irrigated with water via ditch systems: the Smith and Goss Ditch and the Anderson Ditch which pull from Boulder Creek.
“We prioritize efficient and responsible water use across campus and continuously adjust operations based on weather, soil conditions and overall system performance,” the university said in the same email. CU uses an automated monitoring system to assess levels in ponds used for water storage, pulling from the ditch only for replenishment.
Because of the senior water rights used to irrigate the campus, CU can justify continued irrigation. “To our knowledge, neither [Smith and Goss Ditch or Anderson Ditch] has ever been called out of priority or required to cease operations due to insufficient water flow in Boulder Creek,” CU’s Strategic Relations and Communications Team said in an email response.
But deferring to separate water rights does not solve the problem of a shrinking supply. Although CU’s irrigation water is not part of the city’s potable water supply, it still has to come from somewhere; Boulder Creek is fueled by snowmelt high in the Rocky Mountains, which continues to be threatened by warming temperatures.
The university claims its approach to water use is flexible. In the case that water restrictions tighten, the university says it will reevaluate, “working to conserve water while maintaining a safe, sustainable and vibrant campus environment.”
But for other universities across the West, the current amount of water going to irrigation is not sustainable. Some are looking for creative ways to both maintain their campus and reduce water use at the same time.
In Albuquerque, a university with a golf course
In 2024, the University of New Mexico used 182 million gallons per year to irrigate its nearly 800 acre campus. On top of that, it used 43 million gallons per year to irrigate its 9-hole North Golf Course, and 234 million gallons a year to irrigate its 18-hole Championship Golf Course. Most of the 459 million gallons of irrigation water comes from a groundwater well system that was established on the campus in 1904.
“Western water law doesn’t do any favors to conservation,” said Anne Jakle, director of the office of sustainability at the University of New Mexico. “The ‘use it or lose it’ philosophy is not helpful.”
Trees and green spaces on UNM’s campus serve as a community sanctuary from heat and sun in the high desert climate. (Photo courtesy of The University of New Mexico)
Of the North Golf Course’s 43 million gallons, around 7 million are reclaimed water. The university is using blowdown from a utility chiller tower to help water the golf course, an effort that comes on the heels of a project that cooled and reused water to help the university conserve 2.8 million gallons of water each year.
UNM’s campus, located in Albuquerque’s high desert climate, is decorated with more landscaping than occurs naturally. “We’re an open campus too, so people from the community are here all the time, utilizing it, recreating,” said Jakle.
According to Jakle, members of the community seek refuge on the campus from the urban heat island effect, which can artificially raise the temperature in an area due to surrounding materials absorbing heat from the sun. This can be curbed by the cooling shade of a tree canopy.
The university is planning a 20% reduction in water use by 2030, outlined by the UNM Sustainability Strategic Plan released in 2025. “Our goal is not to maintain a lush campus indefinitely as it exists today,” UNM Facility Services said in a statement response, “but to thoughtfully transition to a landscape that remains beautiful and functional while using less water.”
One of the strategies UNM is using to eliminate excess water use is to target non-functional turf, or grass that serves no purpose beyond aesthetics. The goal is to replace those plots with native species through xeric landscaping, which will not only use less water, but promote ecological health by attracting pollinator species.
But eliminating decorative grass is not without its challenges, and those challenges are not unique to UNM.
A Mojave desert university struggles to keep its trees
The University of Nevada Las Vegas spearheaded efforts to remove excessive grass from their campus located in the Mojave Desert starting in the late 1980s. But since removing over 1 million square feet of turf, conserving what the university estimates to be 77 million gallons of water a year, tree die-out has become a major problem.
“We removed so much grass that we’re noticing the effect on the trees,” UNLV grounds superintendent James Kearney said. “The trees are all dying or suffering.”
Tree die-out extends beyond the campus. In early 2026, some Las Vegas residents filed a lawsuit against the Southern Nevada Water Authority, claiming their grass removal incentives and mandates have killed tens of thousands of trees.
The university is focused on utilizing native species for landscaping design. Those native species should, in theory, be resilient enough to survive the conditions of the Mojave Desert without irrigation. However, UNLV irrigates those plants, too.
“We found that even if it’s a native species, it’s beneficial to still irrigate it,” Kearney said. “[They] should survive without any irrigation, and it’s possible, but it’s not going to look great.”
On UNLV’s campus, trees require more water than native plants. Both trees and native plants are irrigated by the same drip systems; the system can’t differentiate between a water-intensive tree and a native plant.
Targeted irrigation could help the plants and reduce water waste by giving different plants and trees their own valves. But that transition would be costly. And according to Kearney, it is an intensive process. “You’re either tunneling under a sidewalk or ripping out and repouring concrete, so you don’t really have a choice,” he said.
Cost and labor are not the only prohibitive measures a university faces when battling irrigation challenges. For some, the source of their water is just as prohibitive.
In Golden, Colo., city water restrictions force change
Because of the source of its water, Golden’s Colorado School of Mines is faced with a problem of not knowing exactly how much is used for irrigation. The city supplies the school with all of its water. According to grounds manager Roger Jensen, this water is not metered by use, which means the university can’t measure how much is used for irrigation on campus versus how much water is used in buildings.
Despite not knowing how much water is being used for irrigation, conservation efforts persist. Over the course of the summer, Mines’ baseball field will be converted from natural turf to synthetic turf. It will be the last of the five full-size fields in their athletic complex to be converted to synthetic turf.
The Colorado School of Mines has worked to change each of their five athletic fields to artificial turf, but the recreational fields remain grass. (Annie MacKeigan / The Water Desk)
“That cuts a lot of water out,” Jensen said. By his estimate, around 1.5 million gallons of water were used to irrigate just that one baseball field over the course of two academic years.
Regardless of the change on the baseball field, the university still manages club sports fields and quads that are natural grass and require watering through an underground drip system.
“We know that having this lush green campus, this oasis, is not a natural thing,” Jensen said. “It’s a balance between maintaining what we’ve inherited from generations past, providing insight and advocating towards more ecosystem-appropriate plantings while still honoring that oasis-feel.”
The Colorado School of Mines’ Kafadar Commons is one of the only central grassy areas where people are able to gather. (Annie MacKeigan / The Water Desk)
This is the first year that School of Mines has been put under mandatory watering restrictions by the city of Golden.
“Back in 2012, it was rough, but there were no water restrictions,” Jensen said. The city is not so particular about the underground drip systems, so long as they are optimized and in good repair. “This time, they’re saying two irrigation days a week,” he said.
The thought to remove non-functional turf to reduce water use is common among universities in the West; some have to take it a step further in order to grapple with a changing climate and dwindling water supply.
Turf removal ramps up at ASU
Contending with a shrinking supply of Colorado River water, the senior administration at Arizona State University employed grounds teams and landscaping architects to look at ways to remove turf grass from the campus within the last few years. “That took everyone by surprise,” said Norman Yatabe, senior project manager of the office of the university architect and landscape architect at ASU.
Yatabe says that eliminating turf grass is “low hanging fruit,” and that it is the easiest and most effective way to reduce water usage on campus. At ASU, ground cover, shrubs and native plants mimic the green, verdant landscape expected of universities, and do so with less water.
Arizona State University is experimenting with rainwater gardens and bioswales as a way to conserve water and keep the campus beautiful. (Photo courtesy of Arizona State University)
ASU uses potable city water on its East Valley, Polytechnic, Downtown and Tempe campuses, and groundwater from wells on the West Valley campus. Because it uses city water, the university must work within municipal water restrictions as they come.
Looking to other solutions, ASU has begun to passively collect rainwater from summer monsoons that do little to recharge groundwater supply due to evaporation and rapid runoff. The university does not store the rainwater, but instead uses it in bioswales and rain gardens. “The rainwater flushes out a lot of the salts that are in the ground,” Yatabe said. Because of a lower salt content in these rainwater gardens, Yatabe says they are observing better plant growth in these areas.
In addition to rainwater collection, ASU is capturing condensate from air conditioning systems in new buildings to use in landscaping planters.
According to Yatabe, one of the most important initiatives for limiting water use is changing the perception of what campus greenery is. The plants may look different as the climate warms, he said. “We’re constantly being forced to adapt and change to these varying conditions, ever-changing conditions.”
This story was produced and distributed by The Water Desk, an independent reporting initiative at the University of Colorado Boulder’s Center for Environmental Journalism.
Anna Vargas, of Manassa, Colorado, is a sixth-generation resident of the San Luis Valley who is deeply embedded in local water management initiatives. She hasn’t drunk her own tap water in years out of fear of contamination. Credit: Jacob Spetzler/Inside Climate News
This article originally appeared on Inside Climate News, a nonprofit, non-partisan news organization that covers climate, energy and the environment. Sign up for their newsletter here.
Julie Zahringer hears a common refrain at her environmental laboratory in Alamosa, Colorado: A customer has been drinking well water on family land where they’ve lived for years, but recently noticed it has changed. They want to know why.
“All of a sudden it looks different, tastes different, there’s odor, there’s color,” said Zahringer.
Zahringer’s SDC Laboratory is one of the few testing water in the San Luis Valley, an 8,000-square-mile, high-altitude desert in south-central Colorado. She has tested thousands of wells during more than 30 years in the field.
Residents of the valley, which has large Hispanic populations and a high poverty rate, have been concerned about naturally occurring heavy metals in their water for decades, she said. But in the past five years, the rate of change has accelerated.
“Every year it just seems like this is the climax of it, and the next year, it gets worse,” said Zahringer. “This year, we’re looking at probably the worst as far as water quality.”
The San Luis Valley relies on surface water from the Rio Grande and a massive aquifer system, one of the largest in North America, to drive its agricultural economy. But the aquifer is severely overallocated, losing an estimated 1.2 million acre-feet of water between 1976, when tracking began, and 2013—equivalent to more than five times what the city of Denver consumes each year. This year, the aquifer could hit another record low, as Colorado’s snowpack, which recharges the state’s aquifers, is at the lowest level since record-keeping began in 1941.
The sun sets over agriculture fields in San Luis, Colorado on Tuesday, May 5, 2026. The Rio Grande recharges the aquifer, which is the source of water for the entire San Luis Valley, including its agriculture, which is the industry which economically sustains the area. The amount of water necessary for large scale agriculture is also the primary reason for the aquifer’s depletion. Credit: Jacob Spetzler/Inside Climate NewsA water control gate controls flow in an irrigation ditch in Manassa, Colorado. Credit: Jacob Spetzler/Inside Climate News
Researchers are finding that as groundwater levels drop, the remaining water can contain higher concentrations of carcinogenic heavy metals.
The valley’s well water users, many of them in historically underserved communities, are increasingly concerned about what’s in their drinking water. But with little governmental oversight of private wells or resources to help track and manage quality, they have few options to make it safe.
Shifting chemistry
Anna Vargas, a sixth-generation resident of the San Luis Valley, remembers making snowmen often as a child, and her mother talking about the daily rains during the summer monsoon season. Now, monsoon season barely exists here, Vargas said.
“As the years have gone by, there’s less rain, less snowfall. I’ve lived in the valley long enough to see the changes in weather patterns,” says Vargas, project manager with the SLV Ecosystem Council. “We depend a lot on snowpack, and we have hardly any this year. It’s concerning for all of us in the Rio Grande basin…The heavy metals will just become more concentrated.”
Heavy metals like arsenic, tungsten, uranium, manganese and selenium occur naturally in rocks and soils and come up with groundwater that is pumped to the surface. With drought, Zahringer said, they can become a problem.
“We’re not seeing a dilution of any of the contaminants…so anything that’s in the geologic makeup is just really concentrating,” said Zahringer, whose tests have documented contaminant levels rising in the wells during dry periods.
Julie Zahringer, owner and laboratory director of the Sangre de Cristo (SDC) Laboratory, in her office in Alamosa, Colorado. The SDC Laboratory, the only lab testing water in the San Luis Valley, serves private well owners, municipalities and agricultural water users. (Photo by Jacob Spetzler/Special to Inside Climate News)
In addition, as aquifer levels drop during droughts—and due to overpumping—its geochemistry shifts, says Kathy James, Ph.D., associate professor with the Colorado School of Public Health. Users reaching deeper into the ground to access the remaining water can draw small amounts of water connected to geothermal sources or underground reservoirs of hot water, which can have high arsenic concentrations, into the drinking supply. Even in small amounts, this can increase arsenic concentrations to dangerous levels. James notes that these relationships are complex and non-linear, however, and additional research is needed.
Zahringer’s estimates mirror these results: Of all the well waters her lab tests in southern Colorado, about 25 percent exceed the U.S. Environmental Protection Agency’s maximum contaminant level for arsenic in drinking water.
Zahringer said that some customers come to her lab on referrals from their primary care physicians trying to determine the root cause of elevated levels of heavy metals in their bloodstream. Her own well water is high in arsenic, but her filtration system thoroughly treats it before it enters her house.
“I’m in a unique situation where I’m educated and vigilant, and I have the resources to test and make sure it’s OK,” said Zahringer. “A lot of my neighbors, I know they’re just drinking it right out of the ground.”
Half of the U.S. population relies on groundwater for drinking, irrigation, industry and livestock. Much of it is pumped through public water systems, which must limit contaminants to comply with the federal Safe Drinking Water Act, in addition to state requirements that may be more stringent. But private wells, which are the main source of drinking water for 15 percent of Americans and about a third of San Luis Valley residents, are not regulated or monitored. In effect, about 51 million Americans are responsible for monitoring the safety of their own drinking water.
In the San Luis Valley, residents are asking more questions about how their water is impacting their health, crops and cattle, Vargas said, making it easy for her to recruit some of the more than 800 private well owners involved in James’s study.
“We filled it up so fast that that just shows how much the community members wanted their wells tested,” says Vargas.
After a few months of recruiting, the study group was nearly at capacity.
Later, neighbors would stop her at the grocery store to tell her about their results: manganese, arsenic, uranium or other contaminants were often above the EPA thresholds.
Today, many residents in Vargas’s community have turned to bottled water. “They just don’t know if they can drink the water,” she said.
“As those contaminants are increasing, we are going to start to see these rural areas really can’t afford these treatment plants and mitigation for it,” said Zahringer. “We’re dealing with a lot of really small communities that are really struggling to pay for their water testing, let alone to build these new plants.”
San Luis Valley is one of the poorest rural areas of Colorado, with an estimated 21.4 percent poverty rate. Even if well users can access a water test, consistent filtration remains an economic burden.
Water from a natural spring pours out of a pipe in the town of San Luis in the San Luis Valley of Colorado. Credit: Jacob Spetzler/Inside Climate News The town of San Luis in the San Luis Valley, Colorado on Tuesday, May 5, 2026. Credit: Jacob Spetzler/Inside Climate News
Household reverse osmosis systems can remove up to 99 percent of contaminants, including arsenic. But they are expensive—often costing thousands of dollars to install and hundreds more annually to maintain—and can waste up to 80 percent of the water that passes through them. And because the San Luis Valley has moderately to extremely hard water, compounds and metals accumulate much faster on filtration systems, requiring replacement more than twice as frequently as in areas with soft water.
“I come from a rural and impoverished community, and my community members can’t always be changing out these filters for this reverse osmosis filtration system,” Vargas said.
Researchers at Arizona State University are planning to field test a new type of filter that removes a range of heavy metals from hard water systems without losing water in hopes of providing more accessible water quality mitigation for residents. Alireza Farsad, a postdoctoral research scholar at ASU who founded AmorPH2O, the company developing the filter, expects it to be commercially available next year.
Meanwhile, Vargas and James have presented the water quality study results to local county commissioners and talked with state lawmakers about the increasing concentrations of heavy metals.
But, for now, the issue has seen little action beyond testing.
Shirley Romero Otero, an educator and activist in San Luis, Colorado, has spent decades organizing for land and water rights in the San Luis Valley. Credit: Jacob Spetzler/Inside Climate News
For Shirley Romero Otero, a local educator and activist who helped implement James’s study, water quality in the San Luis Valley is an issue of environmental justice. She says the valley, home to the state’s largest native Hispanic population, is often left out of policymaking conversations.
“Those folks in Denver that make those decisions for testing and resources need to pay attention…We are part of Colorado. We should have equality when it comes to testing and finding out what the hell is really going on,” says Otero, who lives in San Luis, the state’s oldest continuously occupied town, which has fewer than 600 residents.
“Regardless of socioeconomic status, political affiliation or racial geographic areas, water is the most precious resource that we have. It is the lifeblood of every community. You don’t have water, you die. It’s that simple.”
An acequia, a traditional community-managed irrigation ditch that channels water from rivers and streams to farms and towns, flows into San Luis, Colorado. Credit: Jacob Spetzler/Inside Climate News
Correction: A previous version of this story misstated how arsenic concentrations increase as groundwater declines in aquifers.