Employees of the California Department of Water Resources measure the snowpack in the Sierra Nevada on April 3, 2023. Photo: Kenneth James, California Department of Water Resources.
If you’re looking to gauge the depth and extent of the West’s snowpack, there are tons of helpful resources online that offer data, maps and graphics on both current and historical conditions.
This page offers a tip sheet to help navigate a variety of sites and briefly explains some of the technologies used to generate the data behind the visuals.
I’ve focused on websites that make it relatively easy for the general public to explore the data, especially with interactive maps, rather than pointing to more technical tools geared toward scientists and water managers.
The most popular source for data on the West’s snowpack is the federal Natural Resources Conservation Service (NRCS), which provides a wealth of information from automated SNOTEL sensors and manually measured snow courses.
SNOTEL (as in SNOw TELemetry) is a network of around 900 sites that automatically measure the depth and water content of the snowpack while also providing data on temperature, precipitation and other climatic conditions. The stations use a “snow pillow” filled with liquid antifreeze to measure the weight of the snow above and calculate snow water equivalent (SWE), the key measure of the snow’s water content.
While some stations use cellular and satellite communications, most use “meteor burst” technology to transmit their data by bouncing a radio signal off a band of ionized meteorites located 50 to 80 miles above the Earth.
The photo below from NRCS shows what a typical SNOTEL station looks like.
SNOTEL remains the backbone of snowpack monitoring in the West, but it does have limitations. The sites are typically located in high-elevation clearings where snow persists, so this sample of locations doesn’t capture the full gamut of conditions across the vast landscapes where snow accumulates. The SNOTEL station only collects data for a single point, but conditions may vary dramatically just a short distance away due to trees, wind, shade and other factors.
In addition to using SNOTEL stations, the NRCS collects data manually in snow courses. Using skis, snowmobiles or even helicopters, surveyors periodically travel to the sites and use a metal tube known as a snow sampler to collect data at a series of points along the snow course, which is typically 1,000 feet long. By pushing the aluminum tube into the snowpack until it touches the ground, surveyors can extract a snow core that is weighed to calculate the SWE (see this page from the California Department of Water Resources for lots of photos and info about how these surveys are done).
Aerial markers are also used to measure the snowpack in remote locations that are tough to access. These tall metal pipes have horizontal cross members that can be seen from an aircraft, allowing surveyors to measure the snow depth. With an estimate of the snow’s density, surveyors can calculate the SWE. In recent years, NRCS has outfitted some aerial markers with sensors, as shown in the photo below.
Several sites discussed below also use satellite data to monitor the snowpack, particularly images from the Moderate Resolution Imaging Spectroradiometer (MODIS). Although current satellite technology is unable to gauge SWE, the MODIS data does show whether snow is covering the ground while also providing information on melting, the size of snow grains and other variables.
See this page from NRCS for more information on snowpack monitoring. This page provides an overview of the NRCS snow surveys and its water supply forecasting.
Visualizing NRCS snowpack data
The best place to start is the National Water and Climate Center iMap, which allows you to create maps showing conditions at individual sites and basins (see this page for help on using the tool and this page for generating detailed reports).
The image below shows just one of the many views you can generate with the iMap tool. In this case, the map is displaying conditions for April 1, 2024, with the West’s many river basins shaded according to the percent of the median for 1991-2020. The circles show individual SNOTEL stations.
In addition to visualizing SWE, the iMap tool includes a ton of other data, including snow depth/density, soil moisture/temperature, streamflows and reservoir storage.
This page from NRCS offers some pre-defined maps and reports on the West’s snowpack.
NRCS state-level data
Another way to track the snowpack is by visualizing NRCS data for individual states. This page includes links to maps for 12 Western states and an overview of the region, as shown in the example below.
On the NRCS state-level webpages, which I list below, you can view/download charts that show the coming and going of the snowpack over the season.
The chart below shows how the snowpack was stacking up in Colorado last season. The black line plots the current winter’s snowpack and the green line shows the 1991-2020 median. The dark blue and dark red lines chart the maximum and minimum readings during the 30-year period of record.
As a bonus, you can also plot projections for snowpack for the remainder of the season. In the April 4, 2024, chart below, the dashed lines show a variety of possible trajectories for the snowpack in the months ahead.
Below are links to the state-level sites. The first link is the overview page, followed by “site plots,” where you can view/download charts for individual SNOTEL stations, and then “basin plots,” where you can do the same for specific river basins.
California is included in the SNOTEL data discussed above, but the state also has its own monitoring system for the snowpack.
The California Cooperative Snow Surveys (CCSS) program, which was created by the state legislature in 1929, collects and analyzes data from more than 265 snow courses and 130 snow sensors located in the Sierra Nevada and Shasta-Trinity Mountains.
The graphic below from the California Department of Water Resources is from this page. A printable version of today’s conditions is on this page.
SnowTrax also offers more sophisticated data visualizations here, here and here.
Another page from the California Department of Water Resources offers additional data and graphics. For example, this page charts how the current year’s snowpack compares to recent years and the best/worst seasons in recent history.
Detailed Sierra Nevada reports
If you’d like to see very detailed maps of the Sierra snowpack, check out this page from researchers at the Institute of Arctic and Alpine Research at the University of Colorado Boulder. These experimental products provide “near-real-time estimates” of SWE at a resolution of 500 meters (1,650 feet, or about 0.3 miles). They’re based on recent cloud-free satellite imagery and on-the-ground data from snow pillows and other sources.
National Operational Hydrologic Remote Sensing Center
It’s a mouthful, but NOAA’s National Operational Hydrologic Remote Sensing Center is an essential source for snow data. NOHRSC’s interactive map offers a variety of snow-related data, including depth, temperature, density and melting. You can also select data for any day since 2002. Below is an example of the snowfall during 72 hours in southern Colorado and northern New Mexico.
Colorado’s snowpack supplies water to 19 other states downstream. If you’re looking for a detailed view of snow conditions in the state, check out SNODAS, which uses data from NOHRSC, satellites, planes and other sources to calculate daily SWE estimates for individual river basins. The project was funded by the Colorado Water Conservation Board and developed by the Open Water Foundation.
In the graphic below, I’ve highlighted the Animas River in southwest Colorado, which brings up a chart showing how the current year compares to past seasons and provides a snapshot of conditions in the basin.
The University of Arizona’s Snow Water Artificial Neural Network Modeling System (SWANN) uses a variety of data and machine learning to generate near real-time estimates for SWE and snow cover across the entire nation. SWANN estimates are also available back to the early 1980s. The SnowView dashboard lets you explore data on the snowpack, snow cover and precipitation while also providing satellite imagery and streamflow forecasts (more on the tool in this presentation). The April 1 map below shows the SWE estimates for the Intermountain West that were generated using SWANN.
Community Collaborative Rain, Hail and Snow Network (CoCoRaHS)
CoCoRaHS is a citizen-science effort that describes itself as “a unique, non-profit, community-based network of volunteers of all ages and backgrounds working together to measure and map precipitation (rain, hail and snow).”
Measurements from volunteers are plotted on an interactive map that has data available back to 1998. The image below shows 24-hour snowfall around Durango and Pagosa Springs.
As you’d expect, big cities have a lot more observations than rural areas. See this page for more about the project and how to sign up as a volunteer.
Data from CoCoRaHS is one of the inputs to this map from the National Centers for Environmental Information that tracks daily U.S. snowfall and snow depth.
Snow-related dashboards
Finally, several helpful websites aggregate data, maps and graphics from various sources, offering a quick overview of what’s happening with snowfall and the snowpack.
The Intermountain West Ski Dashboard, created by the Colorado Climate Center at Colorado State University, pulls together data on recent snowfall, short-term forecasts, weather hazards, snow depth, drought and more. Below is an example of a graphic showing that the vast majority of SNOTEL sites in Colorado were below the 50th percentile on January 1, 2024, with the vertical axis showing elevation and the different colors corresponding to different river basins:
The Intermountain West Climate Dashboard, created by the Western Water Assessment at the University of Colorado Boulder, is another useful round-up that focuses on Colorado, Utah and Wyoming. For example, the graphics below from the dashboard show SWE and projected streamflows in the Intermountain region.
Am I missing anything? Please feel free to suggest additions to this tip sheet by emailing me.
The Water Desk’s mission is to increase the volume, depth and power of journalism connected to Western water issues. We’re an initiative of the Center for Environmental Journalism at the University of Colorado Boulder.
Below-average snowpack at Park City ski area in Utah on March 23, 2022. Photo by Mitch Tobin, The Water Desk.
How is climate change affecting the West’s snowpack? What are the projections for the future?
Numerous scientific reports and studies in recent years have tried to answer these questions and others.
Below is an annotated bibliography of key scientific works related to climate change and the snowpack, focusing on the American West. At the bottom of the post is a list of recent journalism covering the issue.
Have a suggestion for a new study or story to add? Please contact me by email.
Publications from the IPCC, the United Nations body that assesses climate science, are a great place to start for a global overview of climate change. If you’re looking for insights into the cryosphere, check out this special report from the IPCC, which also covers the oceans.
Below are some of the (verbatim) conclusions from the summary for policymakers (see footnote 4 of this report for an explanation of the confidence-related terms).
“Over the last decades, global warming has led to widespread shrinking of the cryosphere, with mass loss from ice sheets and glaciers (very high confidence), reductions in snow cover (high confidence) and Arctic sea ice extent and thickness (very high confidence), and increased permafrost temperature (very high confidence).”
“Cryospheric and associated hydrological changes have impacted terrestrial and freshwater species and ecosystems in high mountain and polar regions through the appearance of land previously covered by ice, changes in snow cover, and thawing permafrost. These changes have contributed to changing the seasonal activities, abundance and distribution of ecologically, culturally, and economically important plant and animal species, ecological disturbances, and ecosystem functioning. (high confidence)”
“Since the mid-20th century, the shrinking cryosphere in the Arctic and high-mountain areas has led to predominantly negative impacts on food security, water resources, water quality, livelihoods, health and well-being, infrastructure, transportation, tourism and recreation, as well as culture of human societies, particularly for Indigenous peoples (high confidence).”
“Global-scale glacier mass loss, permafrost thaw, and decline in snow cover and Arctic sea ice extent are projected to continue in the near-term (2031–2050) due to surface air temperature increases (high confidence), with unavoidable consequences for river runoff and local hazards (high confidence).”
“Future land cryosphere changes will continue to alter terrestrial and freshwater ecosystems in high mountain and polar regions with major shifts in species distributions resulting in changes in ecosystem structure and functioning, and eventual loss of globally unique biodiversity (medium confidence).”
“Future cryosphere changes on land are projected to affect water resources and their uses, such as hydropower (high confidence) and irrigated agriculture in and downstream of high mountain areas (medium confidence), as well as livelihoods in the Arctic (medium confidence). Changes in floods, avalanches, landslides, and ground destabilization are projected to increase risk for infrastructure, cultural, tourism, and recreational assets (medium confidence).”
The special report has a chapter on high mountain areas, which includes the graphic below that summarizes the changes in regions around the world.
This congressionally mandated synthesis of research, known as NCA5, concludes there is “widespread consensus” that warming will “decrease the proportion of US precipitation that falls as snow, decrease snow extents, advance the timing of snowmelt rates and pulses, increase the prevalence of rain-on-snow events,” and transform the runoff that is vital for farms, cities and ecosystems.
The report concludes that climate change has already diminished the West’s snowpack, with warming global temperatures leading to earlier peaks and shorter seasons, especially at lower elevations and in areas closer to the coast. In areas where snow is the dominant source of runoff, the volume of water stored in the snowpack may decrease by more than 24% by 2050 under some emissions scenarios, with “persistent low-snow conditions emerging within the next 60 years,” according to the report.
NCA5 stresses that climate change’s reshaping of the water cycle and other impacts will exacerbate inequalities in U.S. society and pose a special threat to some marginalized communities.
Map “a” shows changes in the volume of the snowpack on April 1, a key date for water managers as they plan for the runoff season. About 93% of sites have experienced a decrease in April 1 snowpack since the 1950s, with the decline averaging about 23%. Map “b” concerns the timing of the snowpack’s peak, which has come nearly eight days earlier on average since 1982. Map “c” presents data on the length of the snow season, which has decreased by 18 days on average over the last four decades.
Researchers analyzed nearly 800 peer-reviewed studies, agency reports and other sources to assess the state of the science related to climate change and the hydrology of the Colorado River. Some of the key (verbatim) findings include:
“The period since 2000 has been unusually drought-prone, but even more severe and sustained droughts occurred before 1900.”
“There has been a substantial warming trend over the past 40 years; the period since 2000 has been about 2°F warmer than the 20th-century average, and likely warmer than at any time in the past 2000 years.”
“Decreases in spring snowpack and shifts to earlier runoff timing in many parts of the Upper Basin, as well as decreases in annual Colorado River flows at Lees Ferry, Arizona, have occurred in recent decades. These changes in hydrology can be linked, at least in part, to the warming trend.”
“There is still considerable uncertainty in the quantification of the relative roles of temperature, precipitation, antecedent soil moisture, dust-on-snow, and vegetation change in recent and ongoing variability and change in Upper Basin snowpack and streamflow.”
“Mainly due to the pervasive effects of warming temperatures on the water cycle, nearly all of the many datasets of climate change-informed hydrology and related studies show a strong tendency toward lower annual runoff volumes in the Upper Basin and the Lower Basin, as well as reduced spring snowpack and earlier runoff.”
Peer-reviewed scientific papers
Barnhart, T.B., N.P. Molotch, B. Livneh, A.A. Harpold, J.F. Knowles, and D. Schneider, 2016: Snowmelt rate dictates streamflow.Geophysical Research Letters, 43 (15).
Researchers examined how the speed at which snow melts affects streamflow and found that faster snowmelt causes higher and quicker peaks. “Earlier, slower snowmelt usually produces less streamflow than more rapid melt,” according to the paper. Ecoregions in the American West have varying sensitives to the change in snowmelt rate.
This paper uses tree-ring data to examine the Sierra Nevada snowpack over the past five centuries and concludes that “the 2015 low is unprecedented in the context of the past 500 years.” The scientists found the record-low snowpack corresponded with record-high temperatures in California from January to March 2015, noting that “the exacerbating effect of warm winter temperatures is stronger at low than at high Sierra Nevada elevations.”
In the bottom panel, the red line indicates the instrumental record, and the black line charts the reconstruction of Sierra Nevada snow water equivalent (SWE) on April 1. The horizontal dashed line shows the 2015 SWE value. The top panel zooms in on the 1930 to 2015 period.
This study finds that as more precipitation falls as rain rather than snow, flood sizes increase in a nonlinear fashion. Researchers found that the largest streamflow peaks driven by rainfall are more than 2.5 times the size of peaks driven by snowmelt. “Overall, as a higher percentage of precipitation falls as rain, increases in the size of rainfall-driven and ‘rain-on-snow’-driven floods have the potential to more than offset decreases in the size of snowmelt-driven floods,” according to the paper, which also notes there is a “large potential for continued regional warming to increase flood risk, even without changes in precipitation frequency, magnitude, or timing.”
Scientists found “widespread trends toward earlier snowmelt runoff related to warmer air temperatures,” with the timing significantly correlated with February to May air temperatures. In high-elevation basins in the West, streamflow timing was related to both temperature and precipitation.
The timing of snowpack melting varies greatly across the West, and this study seeks to understand why there are significant regional differences. “For 1 °C of warming, snowpack disappears 30 days earlier in some regions, whereas there is almost no change in others,” according to the study. Elevation, geographic location, precipitation patterns and the annual temperature cycle of a location impact the timing. Looking around the world, the researchers conclude that “the timing of snowpack disappearance will change most rapidly in coastal regions, the Arctic, the western United States, Central Europe and South America, with much smaller changes in the northern interiors of North America and Eurasia.”
This study examines 10 climate scenarios for the 21st century for snow, soil moisture and fuel moisture in the West. “A decline in mountain snowpack, an advance in the timing of spring melt, and a reduction in snow season are projected for five mountain ranges in the region,” according to the paper, which found “April 1 SWE losses by the 2080s of up to 81% for the Cascades and 76% for the Sierra Nevada mountains.” The diminished snowpack, combined with drier soils and fuels, is projected to increase wildfire potential across much of the region.
Researchers concluded that the snowpack shrunk in the U.S. and other places around the Northern Hemisphere from 1981 to 2020, but not everywhere on the planet. The researchers say warming is causing many watersheds to approach a tipping point they call a “snow-loss cliff,” where relatively small temperature rises could accelerate the shrinking of the snowpack in a “highly nonlinear” fashion.
This paper introduces a new measure—the Snow Storage Index—to analyze the changes to the hydrologic cycle. In Western North America, the annual snow storage index has decreased from 1950 to 2013 in 25% of mountainous areas due to “substantially earlier snowmelt and rainfall in spring months, with additional declines in winter precipitation.” The study projects further decreases in the index as warming causes earlier snowmelt and a shift from snowfall to rainfall.
Scientists found that atmospheric humidity plays a big role in controlling how the snowpack responds to warming temperatures, with the frequency and magnitude of winter melt events rising under higher-humidity conditions. “Increased winter melt in humid areas will require enhanced storage capabilities (reservoir, groundwater, etc.) to compensate for the decrease in snow storage and safeguard against increased winter flooding events,” the authors write. “Conversely, earlier and slower snowmelt in less humid areas could lower annual water yields due to sublimation losses and increased evapotranspiration, requiring updated water management strategies to conserve water in dry years.”
This paper identifies hotspots for “snow droughts” and shows that “eastern Russia, Europe, and the western United States experienced longer, more intense snow droughts in the second half of the period 1980 to 2018.” “Natural and human-driven factors (e.g., atmospheric circulation patterns, polar vortex movement, and Arctic warming) likely contribute to snow droughts,” according to the study.
The top panel shows the relative change in snow drought characteristics from 1980 through 2018. The bottom map shows the seven regions and an index of SWE used in the study.
In this study of the Sierra Nevada, the authors show that “even a 1.0 or 2.0 °C increase in average temperature leads to approximately a 20 to 40% increase in the likelihood of below average SWE.” The paper also found that the snowpack in the northern Sierra Nevada is more vulnerable to warming than in the southern part of the range.
Scientists examined both historical data and future projections for rain-on-snow events, which can cause severe flooding. The researchers conclude that rain-on-snow events will generally increase during November to March for most regions of Canada and the northwestern U.S., but southern regions may see a decrease due to reduced snow cover. The results also show a general increase in rain-on-snow events at higher elevations and a decrease at lower elevations.
This study investigates the rain-snow transition zone across the American West for both the late 20th-century climate and the projected climate in the middle of the 21st century. “At broad scales, these projections indicate an average 30% decrease in areal extent of winter wet-day temperatures conducive to snowfall over the western United States,” according to the study. The findings suggest that “many mountainous areas will be characterized by a mixed rain-snow regime in November, in contrast to the historic strongly snow-dominated precipitation regime.” The researchers also project that the likelihood of rain falling instead of snow will increase in March, April and May.
These maps show rain-dominated (blue), strongly snow-dominated (white), and rain-snow mix (pink to red) areas in the American West in the past (1979-2012) and future (2035-2065).
This analysis of long-term precipitation patterns in the American West finds an overall decrease in snowfall and an increase in rainfall from 1949 to 2004. The trend, which is due to rising temperatures, affects the volume of water stored in the snowpack, alters the timing of snowmelt and increases the risk of flooding in winter and spring. The trend was most pronounced across the region in March and in January near the West Coast. “Temperatures have warmed during winter and early spring storms, and, consequently, the fraction of precipitation that fell as snow declined while the fraction that fell as rain increased,” according to the paper.
This map depicts the change from water year 1949 to 2004 in winter SWE after removing the effects of precipitation trends. Three-quarters of stations experienced reductions due to warming.
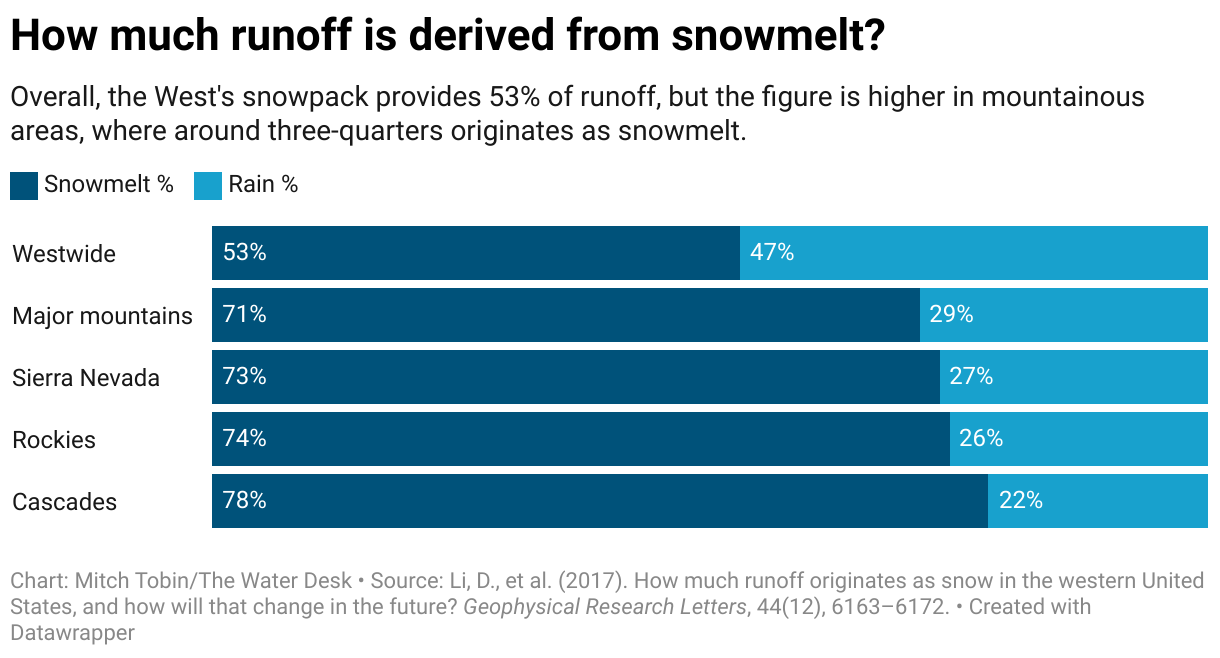
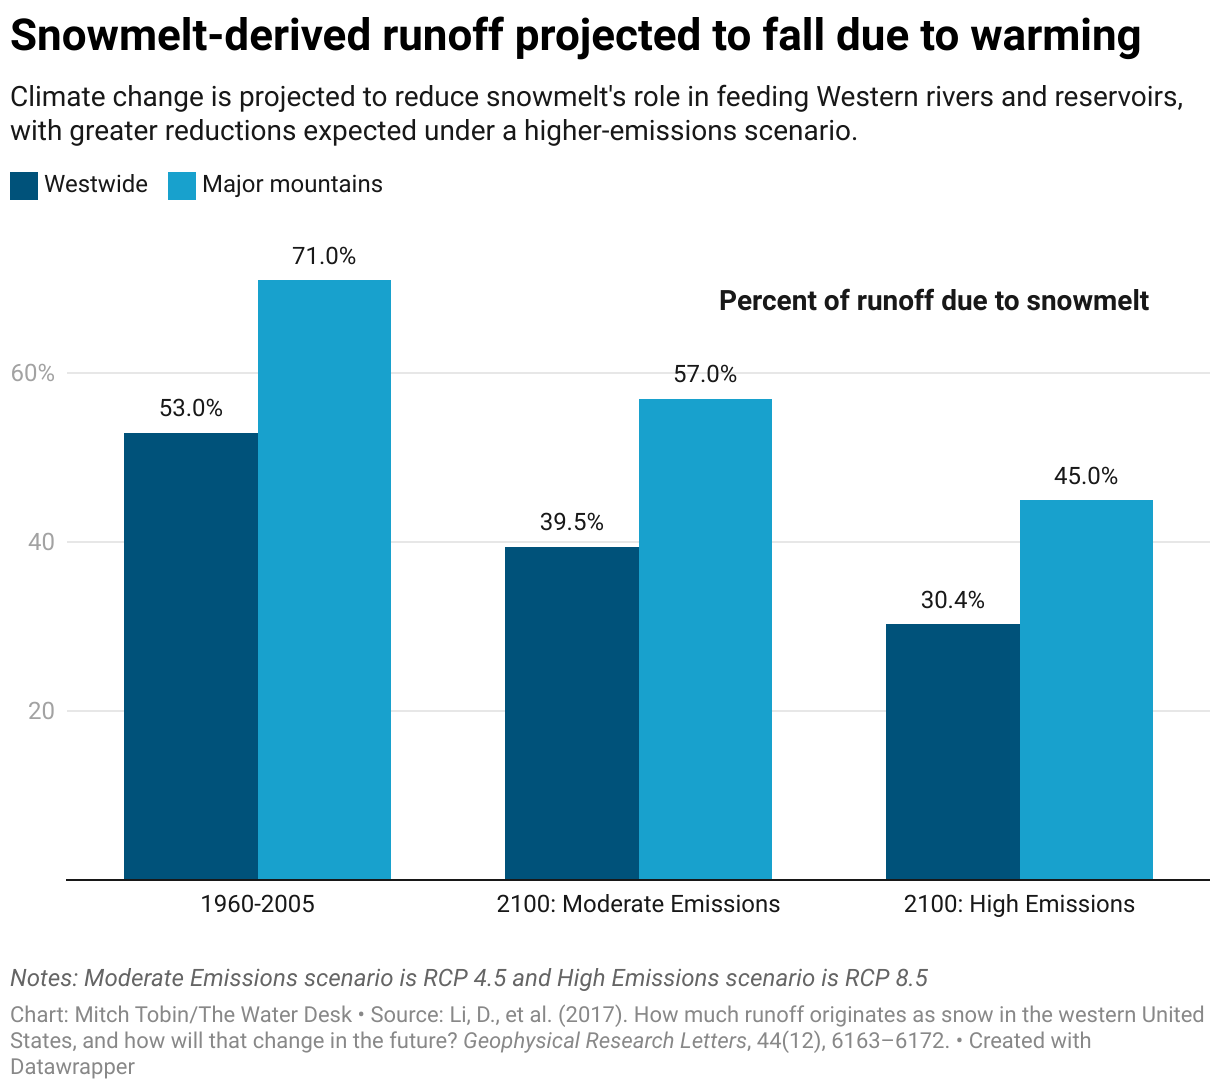
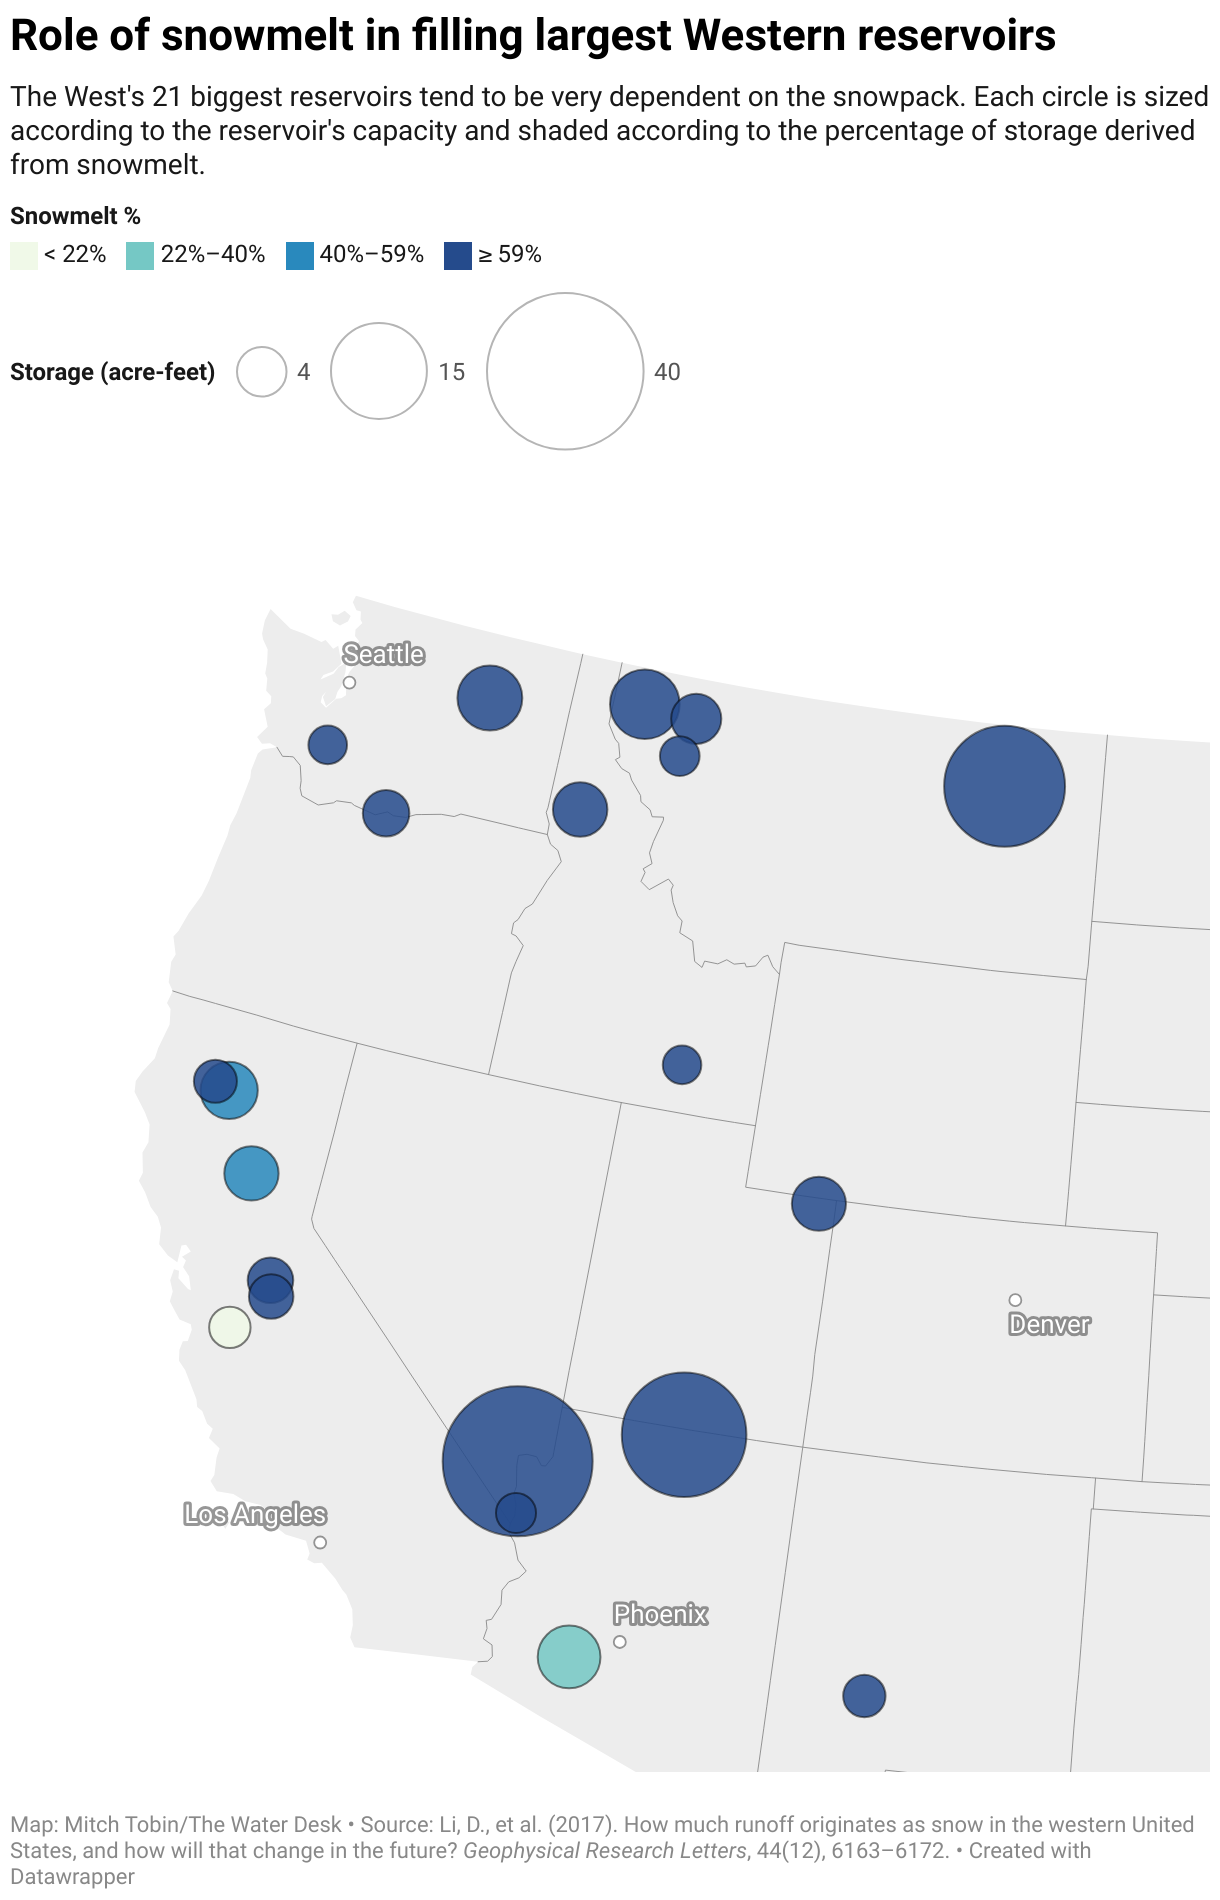
This study (covered in a prior post) quantifies the contribution of snowmelt to runoff and projects how that will be altered by climate change. About 53% of runoff in the West originates as snowmelt, but warming will cause a shift from snow to rain, so the contribution of snowmelt to runoff is projected to decline to between 30.4% and 39.5%, under intermediate and high emissions scenarios. “Future runoff will be driven more by rainfall than snowmelt,” according to the study. “Since the western U.S. heavily relies on snowmelt stored in reservoirs to meet demands for water in the low flow season, reduced spring snowpack and earlier melt onset will likely put significant pressure on water supply in the late summer and fall.”
Researchers found that the shift from snow to rain will make it harder to predict droughts in the West. “By mid-century (2036–2065), 69% of historically snowmelt-dominated areas of the western United States see a decline in the ability of snow to predict seasonal drought, increasing to 83% by late century (2070–2099),” according to the study. Lower-elevation coastal areas will be most impacted by warming and generate more uncertainty in drought forecasts.
This graphic shows current conditions on the left, in which areas of abundant snowfall provide consistent observations that have high predictive power for subsequent streamflows. On the right, future conditions lead to less predictive power because some stations are no longer where snow is abundant, and snowmelt faces longer travel times, leading to more evaporative losses.
This study concludes that annual mean discharge for the Colorado River has been falling by 9.3% per degree Celsius of warming. The researchers say the decline is primarily driven by increasing evapotranspiration as the loss of snow cover increases the absorption of solar radiation. The snow cover acts like a “protective shield” that limits evaporative losses, but continued warming is projected to shrink the snowpack.
The 2018 paper updates the 2005 study, which found substantial declines in the West’s snowpack due to warmer temperatures. The more recent paper found that “over 90% of snow monitoring sites with long records across the western US now show declines, of which 33% are significant (vs. 5% expected by chance).” The researchers also report that “declining trends are observed across all months, states, and climates, but are largest in spring, in the Pacific states, and in locations with mild winter climate.” Average April 1 readings for SWE have declined 15% to 30% since the middle of the 20th century, which is comparable to the volume of Lake Mead, the West’s biggest reservoir.
Researchers found that 34% of monitoring stations in Western North America exhibited increasing winter snowmelt trends, a rate three times as large as the 11% of stations showing declines in SWE. Snowmelt trends are very sensitive to temperature and ongoing warming, while SWE trends are more sensitive to precipitation variability. The scientists also found that “the percentage of annual melt that occurs before 1 April is increasing by 3.5% per decade at 42% of the available stations” and argue that “this substantial and widespread rate of change implies a loss of seasonal storage of snow water resources in North American mountain water towers.”
These maps show stations with significant long-term changes to melting and the date of peak SWE. Map “a” shows the fraction of cumulative annual melt that has occurred by the date of annual maximum SWE, and map “b” shows the date of annual maximum SWE.
In this paper, scientists look at how climate change will impact rain-on-snow events and associated flood risks in Western North America. In a warming climate, rain-on-snow events are projected to become less frequent at lower elevations because of snowpack declines, especially in warmer areas like the Pacific maritime region. At higher elevations, however, these events are expected to become more common due to the shift from snow to rain. The greatest increase in flooding risk is projected in the Sierra Nevada, the Colorado River headwaters and the Canadian Rocky Mountains.
These maps show the average annual rain-on-snow events meeting the “flood potential” thresholds during the 2000 to 2013 period. Map “a” indicates historical conditions, map “b” depicts future conditions, and map “c” shows the difference between the two.
Researchers conclude that a “shallower snowpack melts earlier, and at lower rates, than deeper, later-lying snow-cover” and find that “the fraction of meltwater volume produced at high snowmelt rates is greatly reduced in a warmer climate.” The findings have implications for “soil moisture deficits, vegetation stress, and streamflow declines,” according to the study.
This study examines the decline in the West’s snowpack from 1950 to 1999 and finds that about half of the reduction is “the result of climate changes forced by anthropogenic greenhouse gases, ozone, and aerosols.” The study used 1,600 years of simulations to account for natural variability in the climate and also ruled out solar or volcanic activity causing changes to the snowpack.
Qin, Y., J.T. Abatzoglou, S. Siebert, L.S. Huning, A. AghaKouchak, J.S. Mankin, C. Hong, D. Tong, S.J. Davis, and N.D. Mueller, 2020: Agricultural risks from changing snowmelt. Nature Climate Change, 10 (5).
This global study identifies the regions and crops that are most dependent on snowmelt for irrigation and finds that the American West is one of the hotspots, along with the Tibetan Plateau, Central Asia, Western Russia and the Southern Andes. Under a 4°C warming scenario, reduced snowmelt will require some basins to find up to 40% of their irrigation demand in alternative sources.
This map shows which basins are most reliant on snowmelt runoff to supply irrigation for agriculture. The colors show the average share of irrigation surface water consumption met by snowmelt runoff, while the shading shows the average volume of surface water used for irrigation, normalized by basin area. “The darkest blue (most snow dependent) basins in high-mountain Asia (the Tibetan Plateau), Central Asia, western Russia, western US and the southern Andes are thus places where both irrigation and the share of irrigation demand met by snowmelt runoff are large,” according to the study.
This study projects future changes in the timing of snowmelt-driven runoff in the Western United States. Rising greenhouse gas emissions could lead to 3°C to 5°C increases in seasonal temperatures that cause snowmelt-driven runoff to occur as much as two months earlier. “These large changes result from an amplified snow-albedo feedback associated with the topographic complexity of the region,” the authors write.
This review paper discusses how climate change is decreasing snowpacks around the world and warns of “potentially catastrophic consequences on water resources, given the long-held reliance on snowpack in water management.” Across the West, SWE declines of about 25% are expected by 2050, and it may be “~35–60 years before low-to-no snow becomes persistent if greenhouse gas emissions continue unabated.”
The Water Desk’s mission is to increase the volume, depth and power of journalism connected to Western water issues. We’re an editorially independent initiative of the Center for Environmental Journalism at the University of Colorado Boulder.
A directional boring machine sits outside a home in Edgewater, Colo., on Sept. 25, 2024. Crews are working on replacing lead pipes in homes built before the 1950s with copper pipes by drilling a new hole and abandoning the lead in place. (Emma VandenEinde / KUNC)
On an early morning, a quiet Denver neighborhood was temporarily transformed into a construction zone. A boring machine on the road outside someone’s home pointed a long, thin drill bit at a sharp angle toward a hole in the ground. It’s going to make a path for a new water service line.
All the commotion is for a singular purpose: to reduce the amount of lead flowing into Denver homes.
“Previously, the technology was pulling (the old line) or open trench excavation, which is not customer friendly,” said Denver Water’s Alexis Woodrow. “People do not like their entire yard dug up.”
A man grabbed a big coil of copper line and brought it into the home. Another contractor took out an electronic locator to help guide the boring machine operator.
Wesley Fischer with Five Star Energy Services brings a large coil of copper line from the truck into the nearby home. He will wait until the new hole is drilled and then connect the copper line to the drill bit, which will pull the new line through. (Emma VandenEinde / KUNC)
“They are essentially boring in a new line and then pulling out a copper (line) so they leave the lead abandoned in place,” said Woodrow, who manages the program. “That’s often because we can’t pull it out, or it’s just more efficient to put in a new line.”
This is just one of many work sites for the utility’s Lead Reduction Program – a nearly $670 million project designed to replace lead service lines with copper ones in the Denver area at no cost to the customer.
Lead is toxic. It can cause brain damage in children, as well as increase the risk of a miscarriage, according to the World Health Organization. Denver Water isn’t delivering lead-laden water to customers, Woodrow said, but old household plumbing and service lines can leech lead into that water and cause problems.
“There were homes in the Denver Water service area where lead levels were elevated and the corrosion treatment that we were doing was not sufficient enough to create that protection that they needed,” she said.
In 2012, Denver Water exceeded the lead action level of 15 parts per billion set by the Environmental Protection Agency, coming in at 17 parts per billion. Service lines are owned by the customer, but the utility felt the need to do something. The city researched effective treatment solutions and found that changing the pipe as well as increasing the pH of the water was their best bet.
Lead pipes contaminate the drinking and cooking water inside tens of thousands of Denver homes. They can impact peoples’ teeth, kidneys, blood, liver and more. (Emma VandenEinde / KUNC)
Denver Water has found nearly 65,000 lead lines in the city, primarily in homes built before the 1950s. That’s roughly 220 miles of pipe, according to Denver Water officials. The condition of about 17,000 lines is still unknown.
Since starting the Lead Reduction Program in 2020, the utility has replaced around half of the lines. They also sent Brita pitchers and filter replacements to homes that are still waiting to get their lines replaced.
“What we were giving to them through this program was a chance at health and safety,” Woodrow said. “(We’re saying), ‘You are likely to have a lead service line, so here’s what Denver Water is going to do to protect you.’”
These replacements come in the wake of the Flint Water Crisis in Michigan in 2014, when the city changed their water source from Lake Huron to the Flint River. Pipes corroded and there were no treatment methods in place. Lead levels were nearly double the lead action level set by the EPA in most of the homes, while others were in the hundreds or thousands for parts per billion.
It put the dangers of lead in drinking water in the national spotlight. So why weren’t Denver’s lines, and others, replaced sooner?
Siddhartha Roy is a professor at Rutgers University and has done research on the Flint Water Crisis. He said one reason could be that lead was the plumbing standard in the turn of the 20th century when many cities were growing rapidly.
“Cities had mandates that, ‘Hey, if you want public water, you have to use a lead pipe,’” he said. “There was an industry push. There was a lead lobby as hard as it is to believe that…it will poison you, but lead will last thousands of years.”
Woodrow with Denver Water said even as the dangers came to light, everything was still evolving and utilities were not sure what the best solution was at the time.
“I think there were a lot of questions within the industry, and also in public health, about how lead in drinking water kind of fits in the whole scale of lead exposure, and how serious it is,” she said.
Jason Stern grabs the extra part of the copper line that was pulled through the new hole in the ground. Even after the line is replaced, homeowners still are asked to use a water pitcher with a filter for a few months as the lead cycles out of the piping. (Emma VandenEinde / KUNC)
“You had steps like, ‘Oh, flush (the water) for a few minutes the night before you took a sample in the morning,’ and that lowers lead levels,” he said. “That made it appear that the problem was not as worse as we thought.”
This fall, the Biden Administration introduced a stricter policy, where cities have to remove all of their lead pipes by 2037. Cities will also have to comply with the new lead action level of 10 parts per billion.
Some local utilities have already gotten financial help from the EPA and the Biden administration to get started on this work. Denver Water received $76 million in funds from the Bipartisan Infrastructure Law to speed up this process. The utility was originally paying for its Lead Reduction program on its own with its water rates, bonds and hydropower sales.
Claire Thomas sits with her cat in her historic home that was built in 1890 in the Curtis Park Historic District in Denver, Colo., on Oct. 1, 2024. She got her lead pipe replaced at the end of August. (Emma VandenEinde / KUNC)
Roy said he’s cautiously optimistic.
“The question is financing,” he said. “The question is organizing this at grand levels, coordinating. There’s so much to be done…This is the single biggest policy jump on improving lead in water in more than 30 years.”
When lines do get replaced, it can be revolutionary. Claire Thomas lives in a historic home built in 1890 in the Curtis Park Historic District near the Five Points area of Denver. She got a water filter from the utility and never expected any sort of replacement.
“It was just, this is our way of life,” she said. “We drink from the Brita, and just kind of accepted that.”
Thomas and her partner cook a lot and have friends over often. They’d end up using more water than their small filter could handle.
“In reality, we’ve probably been drinking water that has lead in it because we’ve been overusing our filters,” Thomas said.
Thomas’ new copper pipe sits in her unfinished basement of her home. Contractors did a quick site visit of her home and told her what to expect before they scheduled a day for the replacement. Thomas was pleased by how quick the replacement was and the kindness of the contractors to sweep up the dust and be careful inside her home. (Emma VandenEinde / KUNC)
When she first heard from the utility that her lines were going to be replaced, she was elated.
“I’ve been in a lead water house for so long, I was so excited,” she said. “That same day we returned to the post office with our water samples.”
She got her line replaced at the end of August. She was shocked at how quick the process was and how kind the workers were, cleaning up the street within a week and being very careful within her home.
“(I) feel really lucky moving into this house and a year later being able to have normal water,” she said. “And as I say that, I realize that that’s a weird thing to have to be thankful for, but here we are.”
Denver Water has about 1,000 more replacements to finish before the end of the year. It plans to work in East Denver in 2025 to stay on track with the goal of finishing the whole project within 15 years.
To find out if you have a lead service line, you can enter your address on Denver Water’s Lead Service Line dashboard. Homeowners with questions can call the utility call center at 303-893-2444.
This story was produced by KUNC, in partnership with The Water Desk at the University of Colorado’s Center for Environmental Journalism.
The Rio Grande cuts through a mountain range on the border of the United States and Mexico. In the Forgotten Reach, upstream impoundments reduced water flow by more than 70 percent. (Omar Ornelas for Inside Climate News)
Reporting supported with a grant from The Water Desk at the University of Colorado Boulder’s Center for Environmental Journalism. Aerial photography support provided by LightHawk.
FAR WEST TEXAS—The year was 1897. Flood waters from the Rio Grande submerged entire blocks of downtown El Paso.
The New York Times described the crash of crumbling houses and the “cries of frightened women and children” on its May 26 front page. The raging river displaced hundreds of people and destroyed scores of adobe homes.
In Mexico, the Rio Grande is known as the Rio Bravo—the rough, or wild, river—signifying the force that caused several devastating floods in El Paso and neighboring Ciudad Juárez.
Today these historic floods are hard to imagine. The river channel in El Paso-Juárez now only fills during the irrigation season. Further downstream, the river is frequently dry in a 200-mile section known as the Forgotten Reach.
Inside Climate News documented this remote stretch of the river in July on a flight with the non-profit Light Hawk. Other than limited flows from springs and creeks, known locally as arroyos, this section of the Rio Grande barely has water.
That’s because reservoirs now harness the flows of snowmelt and monsoon rains that once defined the river and deliver that water to thirsty cities and sprawling farms. Making matters worse, climate change is increasing temperatures and aridification in the desert Southwest.
Competition over dwindling water is growing. All that leaves little water to support fish, birds and wetland ecosystems that once thrived along the Rio Grande.
But environmental scientists and local conservation advocates say there are opportunities to restore environmental flows—the currents of water needed to maintain a healthy river ecology—on the Rio Grande and its West Texas tributaries. Proponents of environmental flows are restoring tributaries and documenting little-known springs that feed the river. They are working with counterparts in Mexico to overcome institutional barriers.
Samuel Sandoval Solis, a professor of water resource management at the University of California Davis and an expert on the Rio Grande, compared this restoration model to a “string of pearls.”
“Ultimately, we start connecting these pearls,” he said. “And we start putting it back together.”
But to replicate and expand these local initiatives will require more funding and political support on the embattled binational waterway.
Water for Agriculture, but Not for Nature
For millions of years, the flow of the Rio Grande in present-day New Mexico and West Texas was dictated by two natural cycles. Spring snowmelt in Colorado sent water rushing downstream, triggering floods throughout the watershed. In the summer, the monsoon dumped rain on the desert and swelled the river.
These annual “pulses” of water sustained biodiverse ecosystems in the arid Chihuahuan Desert.
Karen Chapman, coordinator of the Rio Grande Joint Venture, a public-private migratory bird conservation partnership, said the Big Bend segment of the Rio Grande in West Texas is an “emblematic, important wetland for migratory birds in the middle of a big desert region.”
Floods spread the seeds of cottonwoods and tornillos, a native mesquite shrub. Thriving wetlands attracted the southwestern willow flycatcher. Floodplains provided spawning habitat for the Rio Grande cutthroat trout and silvery minnow. Indigenous people harnessed the water for subsistence agriculture.
These cycles came to an end in the early twentieth century. In 1916, the Bureau of Reclamation completed Elephant Butte Dam outside Truth or Consequences, New Mexico. Its 301-foot retaining wall captured the crush of water coming out of the mountains. The dam released water on a precise schedule for farmers farther down the river. The three cities immediately downstream—El Paso, Las Cruces and Ciudad Juárez—continued to grow.
Agricultural fields line both sides of the Rio Grande between El Paso and Ciudad Juárez photographed in July 2024. The Rio Grande Compact determines how much water reaches Texas from the Rio Grande. (Omar Ornelas for Inside Climate News)
The Rio Grande Compact—signed in 1938 between Colorado, New Mexico and Texas—sealed the river’s fate. The compact ensured that farmers in all three states would get their share of water. But there was no obligation to guarantee water flowed beyond the last irrigation district south-east of El Paso, at a point called Fort Quitman. The once-mighty Rio Grande began to dry up downstream of that now abandoned ghost town.
When seasonal flooding ceased in the Forgotten Reach, salt cedars and arundo river cane invaded the floodplain and crowded out native cottonwoods and tornillos. With meager volumes of water in the river, sediment has built up and further hampered the flow. Wetlands shriveled and migratory birds lost stop-over points.
“The river transforms from a natural flashy system to a straight ditch,” explains Kevin Urbanczyk, director of the Rio Grande Research Center at Sul Ross State University in Alpine, Texas. “You lose the aquatic habitat when that happens.”
The Forgotten Reach ends where the Rio Conchos flows from Chihuahua into the Rio Grande at Presidio, Texas. Before the construction of Elephant Butte, over 500,000 acre feet of water reached Presidio each year. After the construction of the dam, the flow fell by 77 percent, according to the Army Corps of Engineers.
In West Texas, the Rio Grande Joint Venture works with landowners to restore grassland and riparian habitats near Rio Grande tributaries like the Terlingua Creek and Alamito Creek. These projects reduce the amount of sediment reaching the Rio Grande, a key intervention to improve flow on the river.
In recent years, flows have also declined downstream of Presidio. Mexico is obligated under the 1944 water treaty to send water from tributaries, including the Conchos, to the United States on a five-year cycle. But since the 1990s Mexico has consistently fallen behind, diminishing water levels in the Rio Grande downstream of Presidio.
The river ran dry through the iconic Santa Elena Canyon in Big Bend National Park in 2022. Rafting expeditions, a bedrock of the Big Bend tourism economy, rely on a river that is less and less dependable.
What water Mexico does deliver is stored at the Amistad and Falcon Reservoirs in South Texas. The Texas Commission on Environmental Quality (TCEQ) then distributes water from the reservoirs to irrigation districts and cities in South Texas and the Rio Grande Valley.
This section of the Rio Grande is considered “over appropriated,” which means there are more assigned water rights than there is water normally available. In other words, every drop of water already has an assigned end-user. There is no water left over for dedicated environmental flows in South Texas.
The problem was abundantly clear in 2001, when for the first time in decades the Rio Grande failed to reach the Gulf of Mexico.
Advocating for Environmental Flows Across Borders
Conservation advocates and scientists working on the Rio Grande face formidable challenges: a binational treaty dispute, climate change, an over-appropriated river. But UC Davis’ Sandoval Solis is convinced environmental flows are possible if water is managed differently.
Sandoval Solis would like to see Mexico release water from its Rio Conchos reservoirs to the Rio Grande to mimic the cycles of spring floods and the summer monsoon. He said better timing of releases can help native species without infringing on farmers’ water rights.
He acknowledged that environmental flows are not a priority in ongoing diplomatic talks as the U.S. works to compel Mexico to release any water. But he said “pulses” of water at opportune times could go a long way.
The idea has already been implemented on the Colorado River, another binational river governed by the 1944 water treaty. In 2014, water was released from the Morelos Dam to create a pulse flow that connected the Colorado River to the Gulf of California for the first time in 16 years. In 2017, the U.S. and Mexican governments agreed to ongoing water deliveries for restoration of the Colorado River delta in Mexico.
The Rio Grande winds through the Chihuahuan Desert in far west Texas. Diversions for agriculture and cities have reduced the flow by at least 70 percent compared to historical flow levels. (Omar Ornelas for Inside Climate News)
U.S. International Boundary and Water Commission spokesperson Frank Fisher said “nature-based solutions” have been part of the agency’s discussions with Mexican counterparts, but did not indicate whether there is interest in a pulse flow on the Rio Grande/Rio Conchos.
In February, the U.S. IBWC and its Mexican counterpart, known as CILA, created the Rio Grande Environment Work Group. The group has met several times this year to identify and implement binational environmental projects on the Rio Grande.
Karen Chapman of the Rio Grande Joint Venture advocated for the creation of the working group and is now a member. “There are folks on both sides of the river in both countries that are concerned about the health of the river and want to work towards some solutions,” she said.
There have been some successes in restoring flows to the Rio Grande. In a 2022 paper in Ecology & Society, Sandoval Solis and colleagues at UC Davis and the University of Oklahoma compiled examples of environmental flows throughout the Rio Grande/Rio Bravo watershed. They point to in-stream flows on Rio Grande tributaries in New Mexico and the first environmental water right in Mexico at the Cuatro Ciénegas wetlands as models to replicate.
A 2023 paper published in the Journal of Water Resources Planning and Management, by lead author Brian Richter of Sustainable Waters, with Sandoval Solis as a co-author, expanded on these ideas. The authors model how converting farmland to less water-intensive crops and leaving some acreage fallow could decrease consumption in agriculture, which currently uses 83 percent of the water rights in the watershed. This would make more water available for environmental flows, without reducing agricultural revenue.
Sandoval Solis said politics is getting in the way of expanding on these models to restore flows to the river.
“The problem of environmental flows on the Rio Grande is not about science,” he said. “We know that the river is drying and we know that it’s about willingness, political willingness.”
Protecting Groundwater that Feeds the Rio
Sul Ross’ Kevin Urbanczyk studies the Lower Canyons on the Rio Grande, downstream of Big Bend. At least once a year he loads up a canoe to reach the canyons, which are not accessible by road, where he measures the flow from aquifer-fed springs into the river.
Urbanczyk said that when Mexico does not send water from the Rio Conchos, all the water in this section of the Rio Grande comes from the springs. He said more research is needed to understand how groundwater contributes to the Rio Grande.
Texas has two separate systems to regulate surface water in a river and groundwater in aquifers. But Urbanczyk said regulations need to account for how these sources are interconnected. He worries that an increase in groundwater pumping near the river could deplete the springs’ contributions to the Rio Grande.
“We’re talking… as if they’re two different things,” he said. “But they’re not. It’s the same water, so the connection needs to be understood.”
The IBWC spokesperson said that historic water gauge data and field studies indicate that groundwater amounts to a discharge of approximately 200 cubic feet per second in the Big Bend region to the Amistad Reservoir.
“[IBWC] understands the importance of these groundwater contributions to providing reliable and predictable water supply to downstream users as well as sustaining environmental processes in the region,” said the spokesperson.
Environmental Flows Legislation in Texas
Largely absent from the discussion of environmental flows on the Rio Grande is the Texas legislation meant to achieve that very objective. In 2007, the Texas Legislature passed Senate Bill 3, which provides protections for environmental flows in Texas rivers and into bays and estuaries.
However, TCEQ excluded the Forgotten Reach from the environmental flows program for the Rio Grande from the outset. The Forgotten Reach would stay forgotten—there would be no environmental flow protections in this 200-mile long stretch of the river.
But in a 2008 study with the Army Corps of Engineers, TCEQ expressed interest in restoring the Forgotten Reach. The study explored restoration options and stated that “The ‘Forgotten’ Rio Grande might have great value as a laboratory for the art and science of rehabilitating perturbed rivers.”
The Rio Grande rises out of the agricultural valley and into the mountains of West Texas. This is the beginning of the Forgotten Reach, a 200-mile stretch of the river with little water flow. (Omar Ornelas for Inside Climate News)
The TCEQ declined a request for an interview about the environmental flows program. In an emailed statement, TCEQ spokesperson Victoria Cann did not respond to questions about why the agency excluded the Forgotten Reach from the program.
The TCEQ formed a scientific working group, including academics and civil society representatives, that recommended environmental flow regimes for the Rio Grande basin. TCEQ then formalized flow standards for the Rio Grande which were adopted into the state administrative code. However, a brief from the Texas Living Water Project points out that the standards TCEQ adopted were a far cry from what the scientific working group recommended.
Myron Hess, a water lawyer and consultant with the Texas Living Waters Project, authored a 2021 report on the “unrealized potential” of Senate Bill 3. The report states that efforts to revive environmental flows have “stalled” in most river basins. Hess said that the models to calculate environmental flow standards do not account for climate change, which is expected to diminish water resources in central and west Texas.
“As droughts get more severe there is going to be less and less water available to protect the environment,” he said. “It’s going to be a world of hurt.”
The TCEQ spokesperson did not respond to multiple requests for comment about the exclusion of climate change from the models. She said that the adopted standards can be revised if new information and data becomes available.
UC Davis’s Sandoval Solis characterized the Texas legislation as “a check box” for regulators to complete. He said the studies commissioned by the legislature have not been acted on.
“In the end you use those studies to do nothing,” he said. “You don’t have any teeth to enforce and to put some water in [the river].”
Despite the setbacks, Sandoval Solis still believes that flows can be restored to the drying Rio Grande. Human intervention over the past 130 years has dramatically transformed the river and stymied its natural flow. But even in the face of climate change he maintains that it’s not too late to reverse some of these changes.
“The river is very forgiving,” he said. “When we have seen the full river coming back to life… in a monsoon, in a hurricane… to me that’s been a very happy experience.”
Researcher Wyatt Reis digs a snow pit as part of a study of the Cameron Peak Fire’s burned area. Photo courtesy of Wyatt Reis.
As the American West warms, there’s a growing intersection between wildfires and the mountain snowpack that supplies the bulk of the water in many rivers and reservoirs.
Fire is a natural and beneficial component of many Western ecosystems, but blazes are now reaching higher elevations, raising questions about how the snowpack behaves in burned areas—and how downstream users and species will be affected.
If a fire torches a forest’s canopy, that change can actually let snow accumulate faster in winter since falling flakes aren’t intercepted by branches and pine needles.
But without that canopy, the snowpack also loses shading from the sun and is subject to more wind, both of which can accelerate the snow’s disappearance. Moreover, soot and ash from charred tree trunks can hasten melting by coating the normally reflective snow with darker, heat-absorbing material.
To tease out the effects, researchers have been monitoring the site of a record-breaking wildfire in the mountains west of Fort Collins. The latest study to emerge from their research on the 2020 Cameron Peak Fire concludes that burned areas can lose their snowpack more rapidly, especially on south-facing slopes exposed to more sun.
The Cameron Peak Fire, which burned 208,913 acres, or about 326 square miles, is the largest wildfire in Colorado’s recorded history. The blaze, thought to be human-caused, burned nearly 500 structures and took nearly four months to be contained.
“The fire area that we studied was completely burned, so I like to describe it as a bunch of burnt toothpicks,” said Wyatt Reis, a co-author of the September study in Water Resources Research and a former graduate student at Colorado State University. “The trunks of the trees are still there, there’s really no branches on most of them anymore, and there’s definitely no canopy at all. So you just have these pillars of charred trunk.”
How the snowpack responds after a fire
The scientists found that a slope’s aspect—its orientation toward the sun—is a crucial determinant of the snowpack’s fate. In the burned area, the snowpack reached its maximum water content on the sunny, south-facing aspect “22 days earlier than all other sites, which peaked simultaneously,” according to the study. Overall, the snow disappeared from burned areas seven to 11 days earlier than in unburned sites.
“We found that the greatest differences were based on aspect regardless of the burn condition,” said Reis. “We get a lot of sun here in Colorado, so that south-facing aspect just starts getting baked earlier in the season than those north-facing aspects, and losing your canopy, you just get all of that shortwave radiation straight into the snowpack and that just starts melting it sooner and earlier.”
The researchers also noted a surprising pattern related to temperature.
“During the winter, the snowpacks on the burned areas were actually colder than they were in the unburned sites. That was something that kind of shocked us at first,” Reis said. “But it makes a lot of physical sense where the trees in the unburned area are kind of acting as a blanket and insulating that snowpack from emitting all of its energy to the cold atmosphere at night or just throughout the day.”
Although the burned areas were colder in winter, that didn’t last.
“In the spring, as our sun angle comes up, as our days get longer, you’re just getting more sunlight and more solar radiation or solar energy into the snowpack,” Reis said. “Losing that canopy then has the opposite effect. Where that canopy is shading the snowpack, keeping it colder, it’s just open to the elements in the burned area.”
At the study site, an automated weather station with a net radiometer measures air temperature, relative humidity, wind speed/direction and soil moisture, plus solar and thermal energy. Photo by Wyatt Reis.
Extrapolating to other burns
Generalizing the results from Colorado’s Front Range to other parts of the American West poses challenges because forests, snowpacks and fire regimes vary so greatly in the expansive region, with different conditions in the wetter maritime locations compared to drier, inland mountains.
But two researchers not involved in the Cameron Peak Fire study praised the paper and said it offered important insights that are relevant in many other parts of the West.
“I think they took a really thoughtful approach to this study and I think it’s applicable to more than just that particular location,” said Anne Nolin, professor in the Geography Department at the University of Nevada, Reno.
The Cameron Peak Fire study took place in “the most common forest type across the western U.S. in the mountains,” Nolin said, so “in a lot of ways, it’s pretty similar to a lot of places around the West.”
But the site is higher and colder than the Sierra Nevada, “where we have a lot of fires and a lot of forests that are really moisture-stressed,” Nolin said. “I wouldn’t necessarily expect to see the same results in places that are a lot more humid, like in the Cascades in the Pacific Northwest, especially on the west side of the Cascades. It’s just a lot more humid and the forests are different. They’re more dense there than they are in Colorado.”
Aerial view of Cameron Peak in October 2019, less than a year before the 2020 wildfire. Photo by Mitch Tobin with aerial support from LightHawk.
Gabrielle Boisramé, assistant research professor at the Desert Research Institute, a Nevada nonprofit, said the findings are “relevant to a lot of places, but you can’t just blanket say, ‘this will apply to everywhere,’ because everything depends on your elevation, your local climate, your fire history.”
“A lot of the work out there is finding basically what they found where you have earlier melt after a fire and faster melt, though a lot of my work that I’ve done in the Sierra Nevada in California actually found the opposite,” Boisramé said.
The locations that Boisramé has studied in the Sierra Nevada differ in significant ways from where the Cameron Peak Fire burned: they’re lower-elevation, warmer forests in which the snow naturally melts earlier. Moreover, they’re subject to more frequent wildfires, so the individual blazes aren’t as severe.
“There’s a lot of different things that affect how the snow’s going to behave, and it’s really hard to disentangle all of them,” Boisramé said.
Another complication is that snow conditions can vary dramatically over short distances.
“If you look at just the scale of one weather station, that might be different than if you looked at the entire hillside because things might be very different right under trees versus in the gaps, or in different size gaps even,” Boisramé said.
Ash speeds melting
A powerful way that wildfires can affect the snowpack is by depositing burned material that accelerates melting. Fresh snow is naturally extremely reflective and has what scientists call a high albedo, but whether it’s ash or airborne dust, darkening the snow surface causes the snow to absorb more energy and disappear sooner.
In the first few years after the fire, “we would really see a lot of that ash deposited on the snow surface, especially during the winter,” Reis said. “However, now in kind of year four, we didn’t see that as much. A lot of that ash has already been blown off the trees since then.”
One interesting finding from the paper, Nolin said, was that the unburned forest also had plenty of material on the snow that lowered the albedo.
“A lot of times we neglect or deemphasize the fact that forests just drop stuff all over the snow, and it makes the snow a lot darker, but what’s different about after a fire is the forest litter, instead of just being like bits of lichen and bark dust and cones and little twigs, it’s black carbon stuff—really, really dark,” Nolin said. “It’s about maybe 10 times more light-absorbing than just regular forest litter.”
In a dense forest, very little sunlight makes it to the ground, so “it almost doesn’t matter what the snow albedo is because there’s so little light coming in,” Nolin said. “But the more light you let in, the more that albedo matters, and so it’s really about that canopy opening up after the fire that matters a lot.”
A wildfire and the subsequent runoff of ash can trigger an immediate crisis for streams and their aquatic wildlife. But scientists have been studying burned areas long enough to know that post-fire impacts to the snowpack and local hydrology can persist for many years beyond that.
“The answer is more than a decade—in some places, over 15 years—we can see this charred black carbon shedding on the snow and causing the snow to melt earlier, year after year after year,” Nolin said.
Scorched trees in the Cameron Peak Fire’s burned area have been dropping charred material onto the snowpack that absorbs solar energy and hastens melting. This photo also shows that trees can melt snow at their bases by absorbing and emitting thermal energy. Photo by Wyatt Reis.
More wildfires intersecting with snowpack
Wildfires have been integral to many Western ecosystems since time immemorial and are critical to ecosystem health. But today’s blazes are a different beast. Climate change, generations of fire suppression and an ample supply of human-caused ignitions have conspired to create infernos that may burn more intensely, extensively and destructively than under historical conditions.
Previous research has shown that the fire season is lengthening and the acreage burned is rising. Yet another troubling trend is the increasing prevalence of fires in places where they used to be much less common, if not absent.
“The geographical overlap between fire and snow is accelerating,” according to a 2022 review article co-authored by Nolin. “As fires burn larger, more frequently, and higher in elevation, snowpacks are increasingly vulnerable.”
A 2019 study found the acreage burned in the West’s seasonal snow zone increased “at an average rate of up to 9% per year in recent decades as a result of climate warming and a legacy of fire suppression.” A 2021 paper concluded that the biggest increase in burned areas was above 2,500 meters (8,202 feet), where snow tends to persist in winter.
“Forest fires of the western United States have advanced upslope over the past few decades, scorching territories previously too wet to burn,” according to the 2021 paper in the Proceedings of the National Academy of Sciences.
Nolin noted that “the longer the dry season, the bigger the fire season, and the snow season’s getting shorter at both ends.”
In addition to earlier melting in spring, “we also see a significant decrease in snowstorms in November,” Nolin said.
“When I think about climate change, I think about the temperature increasing in both the winter and the summer,” Nolin said. “Overall, to me, that means trees are having to work a lot harder to get the water that they need in order to stay healthy, and so they’re moisture-stressed.”
Many Western forests are also plagued by insect infestations and overgrown due to fire suppression. One troubling result of the increasing intersection between wildfires and the snowpack is the potential for a vicious circle.
“You get this feedback,” Boisramé said, “where you can have more fires because there’s less snow and then, in some places, less snow because there’s more fires and so on and so forth.”
Implications for water managers, ecosystems
In many Western watersheds, snow accounts for the majority of the runoff that feeds streams and rivers (see this previous post for more precise figures), so the scientists’ findings have major implications for water managers as they try to navigate between droughts and floods.
One implication for water managers is that “if you’ve got a fire that has burned a south-facing slope in the seasonal snow zone, the hydrologic response in that watershed will be very different than if that fire burned on the north-facing slope,” Nolin said. “Fires on south-facing slopes in the seasonal snow zone will have far more impact on streamflow, seasonal runoff, groundwater recharge, compared with fires on north-facing slopes where you have that topographic shading effect.”
In the Sierra Nevada, forests naturally may go for months in summer with little to no rain, so the snowpack plays an important role in sustaining plants and the forest ecosystem.
“Keeping snow on the ground longer is extremely important for that because if you’re a tree, you want the soil moisture to stay high as long as possible because that’s all the water you’re getting in the summertime,” Boisramé said. “The sooner the snow melts, then the sooner the soil starts to dry up.”
Already, climate change is shifting the timing of snowmelt earlier in the season.
“Pretty much all the models agree that, on average, snow is going to be melting a lot earlier,” Boisramé said.
While some post-fire effects are concentrated in the first years after the fire, the loss of the canopy is protracted, if not permanent. For the Cameron Peak Fire and many other blazes in the West, it remains an open question whether the forests will ever recover as the region’s climate changes.
“There really hasn’t been a ton of recovery, especially in the first three years,” Reis said of his study site. “You’re starting to see some saplings come up, particularly on the north-facing slopes now. The south-facing slopes aren’t seeing as much recovery, and that might be due to the earlier snowmelt on those areas. They just don’t have the water resources that they need to start growing.”
Four years after the fire, the saplings are just 12 to 18 inches tall, and they now have to contend with a novel climate that may be inhospitable.
“We don’t know when that canopy might come back and when that shading might come back,” Reis said. “So you might have decades of changed snowpack characteristics.”
Wyatt Reis measures snow density on an unburned north-facing slope near Cameron Pass. Photo courtesy of Wyatt Reis.
The Water Desk’s mission is to increase the volume, depth and power of journalism connected to Western water issues. We’re an editorially independent initiative of the Center for Environmental Journalism at the University of Colorado Boulder.
The Rio Grande Gorge near Taos, New Mexico, on June 24, 2024. (Mitch Tobin /The Water Desk)
The Water Desk is excited to announce an in-person training and workshop for journalists interested in covering the Rio Grande watershed.
The Rio Grande faces significant challenges: climate change, aridification, pollution, development, population growth, invasive species and more. The river forms part of the U.S.-Mexico border and is a critical water supply for three U.S. states—Colorado, New Mexico and Texas. As supplies shrink and tensions ramp up, litigation among the river’s users continue to make headlines. Diplomatic relations between the U.S. and Mexico have the potential to affect the Rio Grande as well.
To equip journalists to better understand the river’s history, its current legal cases and future challenges, The Water Desk is hosting a training program for journalists in Albuquerque, New Mexico, on January 29-31, 2025. Participating journalists will hear from legal experts, tribal leaders, environmental advocates and other speakers who can shed light on the Rio Grande.
We will select up to 15 participants who represent diversity in geography, race, gender and journalistic medium. Travel, lodging, meals and other expenses will be covered for all attendees. Additional funding for story coverage after the training will be made available. The program will begin the evening of January 29 and conclude in the afternoon on January 31.
The Thornburg Foundation, a Santa Fe-based family foundation, is providing the financial support to make this training possible, while the program is the sole responsibility of The Water Desk.
Santiago Maestas, president of the South Valley Regional Association of Acequias, stands next to the Pajarito acequia in Albuquerque, New Mexico. Visual: Lourdes Medrano for Undark
This story was originally published by Undark on October 9, 2024
Santiago Maestas has grown apples, peaches, and apricots on his New Mexico property for more than five decades. He still cherishes the network of ancient gravity-fed irrigation ditches that deliver the water that keeps his orchard thriving.
Those irrigation ditches, scattered across the state and known as acequias (pronounced ah-SEH-kee-ahs), have endured for hundreds of years. For Maestas and other residents in Albuquerque’s South Valley, the communal irrigation system is an integral part of life in one of the country’s most arid regions.
Water Desk Grantee Publication
This story was supported by the Water Desk’s grants program.
“It’s what makes the valley green,” said Maestas, walking along a narrow, meandering acequia near his house on a summer morning. “It provides us with a canopy. It provides us with the ability to continue to grow crops in our backyards.”
The water that day flowed through the canal, flirting with the roots of lush, towering trees lining the dirt banks that Maestas strolled. In a small ditch, the gravel bed was dry and covered in weeds, a sight emblematic of dwindling water. Scientists say a lingering drought, warmer springs, and reduced water flow in the Rio Grande will intensify and further test the ancient irrigation systems.
Acequia users like Maestas are part of a collaboratively managed irrigation system that delivers water from ditches to crops and gardens. To cope with an increasingly dry environment, irrigators are already making some adjustments to the waterflow. “We’re now on a three-week rotation,” he said. “One day every three weeks, we can deliver water. Earlier in the spring, when the river was full, we could deliver water every two weeks.”
Acequia users say the treatment of water as a commodity that can be sold and traded, like gold and silver, goes against the traditional system, which emphasizes shared resources.
As water becomes increasingly scarce in the drought-stricken Southwest, so does competition for the resource. This worries users of New Mexico’s acequias, which research shows could help offset some effects of climate change as water seeps into the soil, replenishing groundwater that helps balance the water supply during scant rainfall. To safeguard their unique system, irrigators like Maestas are working on adapting to volatile weather, boosting acequias as a sustainable resource, and strengthening legal protections around water rights in a changing environment.
Acequia users say the ever-increasing treatment of water as a commodity that can be sold and traded, like gold and silver, goes against the traditional system, which emphasizes shared resources. The canals that have long sustained people still exist because of their communal bonds and deep connection to land and water, said Jorge Garcia, a South Valley resident. Acequias are a “system that carries not only our history, but also our spiritual values.”
In a water-stressed place like New Mexico, Garcia said, preserving acequias can ensure a continued supply of clean water for those who depend on it to grow food for their families and for the local community: “We have to protect the water that we have for future generations.”
The use of shared canals and ditches to irrigate New Mexico date to before the arrival of Spanish explorers in late 1500s. When Spanish explorers arrived and expanded their occupation from Mexico into what is now the American Southwest, they built the system of acequias that could deliver water to their established settlements.
“There’s a distinction between an acequia and a canal and a ditch,” said José Rivera, a research scholar who has long studied acequia culture. “Acequia has a connotation about it that it’s both a physical system, just like a canal or just like a ditch. But acequia also means it’s a social organization of irrigators. It’s a community of irrigators.”
In other words, acequias refer both to the physical structure and the social institution that governs its use. The irrigation system relies on a network of canals that deliver water from rivers, streams, and springs. Gates open and close so the water can flow into smaller ditches that allow irrigators, also known as parciantes, to flood their land during the growing season. Each acequia functions as a democratic institution that shares water fairly during shortages. A mayordomo, or ditch boss, handles various tasks, including organizing the people, to keep the acequia running smoothly. Three commissioners, or comisionados, provide oversight.
Acequias are a “system that carries not only our history, but also our spiritual values.”
Rivera calls acequias in New Mexico “an amalgamation of all of these practices and all of these traditions and they came together here.” ( Spaniards inherited the practice, which has Middle Eastern roots, during the Moorish rule in Spain.) According to the New Mexico Acequia Association, today the state has about 700 acequias considered political subdivisions subject to state laws. Meanwhile, neighboring Colorado has around 70 along its southernmost region. Acequias built in other Southwest regions, such as Arizona, before the United States became a nation have long disappeared.
Acequias in New Mexico for the most part still adhere to traditions stemming from old Spanish and Mexican legal systems that emphasize shared benefits and responsibilities, as well as unique Spanish terminology, said Rivera, professor emeritus of community and regional planning at the University of New Mexico.
The historic waterways crisscross urban and rural land, distributing water to thirsty orchards, gardens, and small fields. “Ultimately, the way that we use these resources is what has allowed our communities to survive for all these generations,” said Patrick Jaramillo, co-director of the New Mexico Program of the American Friends Service Committee in Albuquerque.
His nonprofit collaborates with those working to protect acequia traditions. “The acequieros, or the stewards here know that if we keep these practices, our communities will continue,” said Jaramillo, who grew up on an acequia property.
Gates control the flow of water into smaller ditches, providing irrigators with water to flood their land during the growing season. Visual: Lourdes Medrano for Undark
Although the antiquity of acequias affords them certain legal protections, their endurance has not been without struggle. The growth of water users and changing laws that champion water rights as individual property have meant frequent clashes with the communal concept of acequias.
In the early days of modern southwestern settlement, acequia water could not be legally diverted from ditches. Now, parciantes can sell their rights to their share of water even if they keep their land.
“In the past, water rights could not be transferred outside of the community,” Rivera said. “Now they can. They’re bought and sold, like any kind of property. So that’s a major threat.”
Acequias increasingly defend their way of life through political activism. They’ve adopted bylaws as acequia associations to restore governance abilities as owners of some of the state’s oldest water rights. Although parciantes have individual water rights, the irrigation system itself is owned and managed collectively as a common property, Rivera said.
Acequia communities have the right to protest proposed water transfers they deem could be detrimental to the function of their system. According to the Acequia Governance Handbook, acequia associations that have not adopted transfer bylaws that give them rights can express concerns in public hearings, but the New Mexico Office of the State Engineer, which regulates water rights, has the final word.
“We have to protect the water that we have for future generations.”
A water transfer diverts water destined for an acequia to a new location, for example. The practice sometimes pits parciantes against parciantes. In the South Valley, people seek water transfers for economic reasons, because they’re moving, or simply because they have no need to irrigate, Garcia said.
One of the South Valley acequias is now protesting a parciante’s plan to sell and transfer water rights to a cannabis farm. Protesters argue that the sell-off of too many water rights from an acequia could eventually lead to its collapse. Parciantes also have opposed proposed high-density development they say would impair water resources, including acequias.
Garcia adamantly opposes any development that could jeopardize water rights in acequias. He feels the same about water transfers from parciantes that could deplete water flows in acequias and hurt other irrigators. “The individual right is conditioned and dependent on the collective right,” he said. “Why? Because the system is designed to function with gravity. So the more water you take, the less pressure there is, the more difficult it gets to distribute water.”
Maestas put it this way: “There’s not enough water for the city of Albuquerque and the acequias and the farmers.”
The surface water that keeps acequias flowing in the South Valley and other traditional irrigation systems across the state originates as winter snowpacks in the Rocky Mountains of southern Colorado. During spring, the snowmelt runoff from the mountainous headwaters of the Rio Grande travels south through New Mexico and then becomes the international boundary between Texas and Mexico.
The water channeled from the river into acequias has kept sustenance farming alive for generations and, over the years, allowed some growers to expand food production in their communities. But decreases in snowpacks causing diminished and variable stream flows are projected to worsen with the higher temperatures of global warming.
“The acequia communities, they’re right on the frontline of these changes,” said Caitriana Steele, an associate professor in the department of plant and environmental sciences at New Mexico State University. “They’ve got no way to store water, really. The snowpack is their storage.”
“There’s not enough water for the city of Albuquerque and the acequias and the farmers.”
There’s already evidence that the changes in temperatures are causing the snowmelt that fills acequias to happen earlier in the spring, which complicates irrigation, said Alexander “Sam” Fernald, director of the New Mexico State University’s New Mexico Water Resources Research Institute. This means depleted flows in the summer, when the demand for water soars.
“We’re already seeing reduced runoff, and we’re expecting in the near future to have up to 25 percent less runoff,” Fernald said. “We’re not there yet, but we’re already seeing less runoff for a given snowpack.”
Severe weather, including drought and wildfires, and how it could affect the ability of acequias to continue providing water for communities worries many. In 2022, flash flooding damaged several acequias in various parts of the state.
“The current drought affecting the Southwest United States is probably the worst drought in 1,200 years,” said Tom Swetnam, professor emeritus of dendrochronology at the University of Arizona in Tucson. Tree ring data shows that acequias have withstood similar dry conditions for up to 150 years.
The scientist, who now lives in the New Mexico mountains, said he’s seen firsthand the damage that wildfires can do to the traditional irrigation systems. “The acequias and the places where they’re catching the water from the rivers get filled up with sediment from post-fire erosion,” he said.
Fernald, who has long studied acequias, said their collaborative nature has factored into their survival during tough weather events over the years. Their water-sharing principles, he said, could continue to help them withstand precarious times to keep irrigating their crops.
Tree ring data shows that acequias have withstood dry conditions similar to today’s drought for up to 150 years.
Although acequias lose a good amount of water to evaporation when they soak crops and gardens through flood irrigation, studies show that their hydrology provides benefits to the environment that may actually help counter the loss. For example, Fernald’s research found that seepage — which can range from about 7 to more than 50 percent of the flow — recharges the aquifer and eventually returns to the river. “Acequias also provide many benefits for riparian habitats,” he said.
He likened acequias to beaver dams that keep the water in the upper watershed, by spreading it out over fields, and soaking it back into the groundwater. “It delays its flow downstream, so that’s actually really good for the downstream because there’s water in the river later in the summer,” Fernald said.
For Santiago Maestas, keeping the water flowing to all acequias in the South Valley and across New Mexico is paramount. He cannot fathom a day when the water won’t run down a ditch to quell the thirst of his orchard, or a neighbor’s garden, or a farmer in the northernmost reaches of the state, he said: “The acequias are the lifeblood of this area.”
The 29 square miles that make up the unincorporated South Valley community are home to about 37,600 residents, 82 percent of them Hispanic. Families who have lived on land-grant acequia properties for generations mingle with neighbors who have moved in throughout the years and adopted their communal irrigation traditions that emphasize sharing water when it’s plentiful and rationing it when it’s meager.
In 1973, Maestas moved into his South Valley half-acre property, which included an acequia that carried water to the alfalfa he grew. But the death of the mayordomo left the ditch unattended. It later fell into disrepair, which left Maestas without access to water. Looking for a way to irrigate again, Maestas went on a mission to unlock the time-honored intricacies of the acequia system.
After attending workshops and poring over books on water laws and policy, Maestas discovered that his property came with pre-1907 water rights. That year produced the water code that gives the state the power to control water use and protects water rights established before the date. Such rights are the only ones that can be used without state approval.
Lush greenery surrounds an acequia in the South Valley. Research has shown that acequias can help recharge aquifers, and they also provide many benefits for riparian habitats. “The acequias are the lifeblood of this area,” said Santiago Maestas. Visual: Lourdes Medrano for Undark
Maestas set out to regain water access and inform longstanding acequia users that claiming pre-1907 water rights leaves no doubt of legal standing as competition for water intensifies. Many South Valley residents were, and still are, unfamiliar with a benefit they may have, he said. That’s something Maestas, now as president of the South Valley Regional Association of Acequias, works to change.
Acequias in the South Valley dealt with significant disruption when the Middle Rio Grande Conservancy District created in the 1920s eventually took charge of surface water in the region. Unable to pay the quasi-public agency’s required taxes for new drains, canals, and other infrastructure, acequia associations faltered amid the changes.
Nonetheless, they never ceased to function as a group of parciantes working for the common good, said Garcia, who also is the executive director of the nonprofit Center for Social Sustainable Systems. He and Maestas have worked for years to revitalize acequias and promote understanding in the values and practices of the longstanding institutions.
The two men and other acequia advocates gather once a month at a local waterway with area residents interested in learning about the agricultural tradition and ongoing efforts to preserve them. In July, a group listened to Maestas talk about the history of the five ancient acequias that run through the South Valley.
“The whole irrigation system in the South Valley starts here,” Maestas told a circle of people standing in the shade of two imposing cottonwoods on a late morning. In the distance, a thicket of trees tinted the landscape yellow green.
In the past, Maestas said, the spring runoff that feeds the Rio Grande would wash out the earthen ditches and irrigators had to rebuild them every year. “In many parts of the valley here, the river is actually higher than the valley.”
These days, levees built by the conservancy district keep the river from overflowing into the valley. “So they’re critical and they require federal money because it takes millions of dollars to construct these — more than whatever we could pay with our property tax fees and our water service fees,” Maestas said.
“Without water, we’re not going to be here. And that is something that we’re going to have to reckon with very, very soon.”
Among those listening were about a dozen kids who arrived on bikes. They were part of Story Riders, a bicycling program that offers cultural and environmental education for youth. The group was riding along the acequias daily, documenting the status of South Valley ditches in a report they planned to share with the conservancy district, said program manager Marco Sandoval.
The program works to connect youths with New Mexican culture and acequias are a significant part of it, Sandoval said. “Water is an important issue here,” he added. “Without water, we’re not going to be here. And that is something that we’re going to have to reckon with very, very soon.” Today’s youths could one day help preserve acequias as a sustainable system that can still grow crops and help improve food security in a harsher environment, Garcia said, and with the effects of climate change expected to worsen, “the right thing to do is to get closer to natural systems and acequias give us that opportunity.”
In the meantime, Maestas expects to keep doing his part to protect acequias. “Basically, this is our legacy,” he said. “It’s our role now to be the stewards of the acequias.”
This story was supported in part by The Water Desk at the University of Colorado Boulder’s Center for Environmental Journalism.
Aerial view of Paonia Reservoir on Colorado’s Western Slope on December 24, 2020. Photo by Mitch Tobin, The Water Desk.
Snow is a cornerstone of the American West’s water supply, but just how important is it to the region’s streams, rivers and reservoirs?
In the popular press and academic papers, the sizable share of runoff that originates as snowmelt is often cited as a reason why the West’s snowpack is so crucial to both cities and farms, not to mention the region’s wildlife and very way of life.
But when a team of researchers set out to study the question, they found a wide range of estimates cited in 27 scientific papers. They concluded that “a detailed study of the contribution of snow to the runoff over the western U.S. has not been conducted.”
To clarify the connection between the snowpack and streamflow—and project how climate change is altering the relationship—the scientists used computer simulations and hydrological modeling in a 2017 paper in Geophysical Research Letters to estimate snow’s significance for runoff across the West. Here’s what they found:
53% of total runoff in the West originated as snowmelt, even though only 37% of the precipitation fell as snow.
In mountainous parts of the region, snowmelt was responsible for 70% of runoff. Specifically, it was 74% for the Rockies, 73% for the Sierra Nevada and 78% for the Cascades (see graphic below).
A quarter of the West’s land area, primarily in the high country, produced 90% of total runoff on average.
Climate change will reduce the snowpack’s contribution to runoff, according to the study, as warmer temperatures make it more likely that precipitation will fall as raindrops, rather than snowflakes, leaving downstream water users vulnerable.
“The snowpack is more efficient at producing runoff and streamflow than liquid precipitation,” said co-author Jennifer Adam, a Professor of Civil and Environmental Engineering at Washington State University. “When it’s cold, you have less evaporative demand.”
Climate change threatens snowpack
A diminished snowpack and less snowmelt in rivers “would likely exacerbate the dry-season water scarcity in the future,” according to the study. “In addition, the earlier snowmelt will strain storage capacity of the hydrologic infrastructure and further reduce the water availability in the prolonged dry season.”
Future runoff in the West will be affected by many other factors, including land-use changes, water policies and water efficiency trends. But the researchers caution that “due to the profound reliance on snow as water resources, future declines in snow accumulations in the West will pose a first-order threat directly on the regional water supply, especially in the late summer and fall” when water demand peaks.
Looking ahead, the study used two climate change scenarios—known as Representative Concentration Pathway (RCP) 4.5 and 8.5—to project how the snowpack’s contribution to streamflow will respond to warming temperatures and altered precipitation.
As I noted in a previous post, RCP 8.5’s business-as-usual projections for the carbon output of the global economy now appear too pessimistic, so the more moderate emissions scenario in RCP 4.5 may be more plausible.
Using RCP 4.5, the study projects that by 2100, the fraction of runoff coming from the snowpack will decline from 53% to 39.5%. For streams and rivers draining the region’s major mountain ranges, the figure will drop from 71% to 57%.
The declines are even greater when using the higher-emissions RCP 8.5 scenario: snow-derived runoff in the West falls to 30.4%, and in mountainous areas, it’s down to 45%.
In other words, with enough warming and time, the West’s snowpack will no longer be responsible for the majority of runoff in the region. The change in character and timing of runoff will pose serious challenges, not only for humans who have built elaborate water infrastructure based on snowmelt but also for other species that have come to depend on snow-dominant systems.
Snowmelt’s contribution to reservoirs
The 2017 study also examined the snowpack’s importance to each of the region’s largest 21 reservoirs, which collectively have more capacity than the 2,300+ other reservoirs in the West combined.
Overall, snowmelt accounts for 67% of storage in these reservoirs. For the largest three in the West—Mead, Powell, and Fort Peck—the figure is 70%. In the map below, the circles are sized according to each reservoir’s storage capacity and shaded by the percentage derived from snowpack (click on circles for more data).
Reservoirs are collection points for runoff, so to understand why some are more or less dependent on snowmelt, the researchers looked at the watersheds upstream. The map below shows that dependence on snowmelt varies greatly across the vast and topographically diverse region, with the bluest shading representing areas most dependent on snowmelt and the yellow shading showing places least reliant on snow.
“Winter temperature and then also the fraction of annual precipitation that falls in the winter are the two key pieces,” Adam said.
In some parts of the region, it’s cold enough at high elevations for it to snow and most of the yearly precipitation falls in winter. But at lower elevations and in other parts of the West, there’s more precipitation outside of winter, and even during the colder months rain may fall instead of snow.
Aerial view of the San Juan Mountains snowpack, Electra Lake and the Animas River, north of Durango, Colorado, on May 26, 2024. Photo by Mitch Tobin, The Water Desk, with aerial support from LightHawk.
Warming reshapes river flows
Climate change will not only alter the snowpack’s contribution to runoff but also profoundly change the timing of those streamflows and the fundamental character of many waterways.
Adam noted that another study, published in 2010 in Climatic Change, classified tributaries into three categories—rain-dominant, transient rain-snow, and snowmelt-dominant—based on their precipitation patterns. The graphics below show that each of these regimes lead to very different hydrographs, which are visualizations of streamflow over time that essentially tell the story of a river’s discharge through the seasons.
Graph “a” shows a rain-dominant system, represented by the Chehalis River, east of Aberdeen, Washington and near the Pacific Coast. This hydrograph peaks early in the winter because rainfall quickly runs to the river. Graph “b” shows the transient rain-snow system, in this case represented by the Yakima River in south-central Washington, where the streamflow exhibits two peaks: a smaller one due to winter rains and a much larger one due to the spring snowmelt from higher elevations. Finally, graph “c” shows a snowmelt-dominant system, in this case the Columbia River at The Dalles, Oregon, where the streamflow remains low throughout the winter but then ramps up in spring and peaks in summer due to the high-country snow melting out.
These three hydrographs depict very different rivers in terms of the timing and magnitude of their flows. The hydrographs also lead water agencies to pursue varying management strategies to ensure that customers get enough water, while individual species and entire ecosystems have evolved through the ages to cope with the streamflow regimes. In the 21st century, however, warming temperatures will reshape these curves by making these systems more dependent on rain than snow.
“In those places that are snowmelt dominant historically, you’re going to see a lot of vulnerability to warming temperatures,” Adam said, adding that junior water rights holders are most at risk. “More of our modeling is looking at the water rights and trying to understand where the water restriction is going to be felt.”
Ecologists have long warned that reduced streamflows pose a dire threat to cold-water fisheries, such as trout. Adam said a shift from snowmelt to rain could compound the problem. “One of the problems with the loss of snowpack is that snowmelt cools down the system,” she said. “It’s not just about water volume, but it’s also about cooling the rivers.”
Looking ahead, climate models are crystal clear in projecting warmer temperatures, but the story for precipitation is clouded by uncertainty, making it especially hard to predict runoff at lower elevations.
“We don’t really know what’s going to happen to the rain dominant systems: Are they going to get wetter? Are they going to get drier? We just don’t know,” Adam said. “At least we know with confidence that the snowmelt-dominant systems are going to become more and more stressed.”
Aerial view of the Blue River, a popular trout fishery near Silverthorne, Colorado, on December 22, 2019. Photo by Mitch Tobin, The Water Desk.
The Water Desk’s mission is to increase the volume, depth and power of journalism connected to Western water issues. We’re an editorially independent initiative of the Center for Environmental Journalism at the University of Colorado Boulder.
The San Jun River is a major tributary to the Colorado River. Here flowing near Comb Ridge and Mexican Hat. Scientists are looking at the landscape of the arid watershed to learn about the ancient climate of Mars. (Ted Wood/The Water Desk)
New research from the University of Arizona suggests an unlikely connection between the Lower Colorado River Basin and the planet Mars.
It’s a link that spans 140 million miles through the cold, dark vacuum of outer space and billions of years through the eons, allowing scientists to use similarities between the two landscapes to learn about the ancient Martian climate.
Maybe it’s the intriguing red color, or because it’s one of the brightest points of light in the night sky, but the planet Mars has always loomed large in the Earthling imagination. We long to know the Red Planet better, while simultaneously fearing what we might find.
“It’s extremely important because it’s the most Earth-like of other planets,” said Scott Hubbard, a retired Stanford University astronautics professor who was the first director of NASA’s Mars Program director from 2000-2001 and went on to lead the Agency’s Ames Research Center for several years. “Humanity has been fascinated by this little red dot in the sky for thousands of years.
That little red dot has preoccupied hydrologist Lin Ji for years. While the University of Arizona researcher and freshly minted PhD is usually more solidly grounded on Earth – most of her research has focused on the Lower Colorado River Basin – a few years ago, she became fascinated by satellite images of the Red Planet.
The Martian landscape – full of branching, twisting valley networks – was distinctive and stuck in her mind. And that’s why she noticed something interesting looking down at Arizona’s Santa Cruz River from her airplane window.
“I thought, ‘oh, this Santa Cruz River system looks exactly the same to the Martian Valleys,’” she said. “They both have tree-like, branching river systems.”
That observation sparked a big idea that eventually made its way into her dissertation.
“I realized that there could be a connection between the Earth’s river systems and the Mars valley networks,” she said. “They share similar characteristics. Which indicates that they could have a similar climate.”
An aerial view of Arizona’s branching Santa Cruz River, a tributary of the Colorado River, in January, 2023. Views like this led hydrologist Lin Ji to look for similarities between the southwest and the landscape on Mars. (Courtesy Lin Ji)
Where’s the Martian water?
For the canyons of the Lower Colorado River Basin, that would be an arid climate. Rain in the region is rare but when it does come, it’s heavy, leading to flash flooding so powerful it can carve entire landscapes.
If that doesn’t sound anything like the Mars we know and love today, there’s a reason. Despite its fiery color, Mars is a cold planet.
“Mars today has a very thin atmosphere. It’s like Earth at 100,000 feet,” Hubbard said. “It’s mostly carbon dioxide.”
There is no rain, and certainly no flooding rivers, on the Red Planet. As far as scientists currently know, the planet’s surface is mostly devoid of liquid water: all of it is frozen solid at the surface in large polar ice caps.
But the Martian valleys in Lin’s hypothesis were formed several billions of years ago, when the solar system was much younger. Back then, widespread volcanic activity on Mars constantly spewed atmosphere-forming gasses, keeping the planet warm. During Mars’s Noachian and Hesperian Periods, ranging from 3 to 4 billion years ago, liquid water was plentiful. Ji’s research suggests flash flooding was common, just like in the valleys of the Lower Colorado River Basin.
“We inferred that the valley network on Mars was also formed by high intensity rainfall and a very quick flow process,” Ji said.
To prove her hypothesis that the climate of ancient Mars corresponded to that of the Lower Colorado River Basin, Ji used machine learning, a type of artificial intelligence that learns from complex datasets. She trained her model on a very broad sample of earthly landforms from across the globe, enabling it to correlate certain climate zones with specific qualities of valley geomorphology. Then, she turned the model towards Mars.
Satellite imagery of the Warrego Valles, a branching valley network on Mars. VIS instrument. Latitude -42.3, Longitude 267.5 East (92.5 West). Released March 26, 2004. Hydrologist Lin Ji thinks the landscape there was formed under similar conditions to the Lower Colorado River Basin. (NASA/JPL/Arizona State University)
“We used machine learning to connect the Earth’s climates and its landforms,” she said. “Then we switched this to Mars. We compared the Martian valleys to those in different climatic regions on Earth to help inform what the climate might have been on early Mars.”
That process found a close match between the Martian landscapes and the arid climate of the Lower Colorado region, which produced notable geologic wonders such as the Grand Canyon.
Not by flash flooding alone
But river basins aren’t shaped by flash flooding alone.
While the speed and volume of a valley’s central river is the driving force, there are many overlapping forces that are also important, according to University of Colorado Boulder geologist Lon Abbott: the structures of geologic layers, ice age cycles, plate tectonics and earthquakes, not to mention ecosystem processes – animals interacting with the landscape, and the presence or absence of deep-rooted vegetation.
“It’s a really complex interplay of different factors that have different time scales,” Abbot said. “And the morphology that you see is the combination of all of those.”
He says that complexity makes it hard to compare the two planets in a straightforward way.
“It’s really tough to get down to the real nitty gritty of what climate regime on Earth matches the climate regime on Mars,” he said. “I’m not sure that we could argue with confidence that 3. 5 billion years ago Mars was more similar to the climate that we see today in the Lower Colorado River Basin.”
Abbott has not read Ji’s dissertation, but he does see the promise of her approach of using sophisticated computer modeling to cut through some of that complexity.
“Exploring machine learning is allowing you to run through a set of complex feedbacks more efficiently than we’ve been able to do in the past,” he said. “That’s where it can be a real advantage and move our understanding forward beyond what it was before.”
The big question
And if Ji is right about the Martian climate, that information could help resolve one of humanity’s all-time biggest obsessions: is there life on Mars?
“What we would certainly know is: was Mars habitable? Was it an environment that if life emerged, it would be able to live long and prosper?” Hubbard said. “It may be that as Mars cooled and as ice began to form, that some amount of that surface water found its way underneath. And if life formed, it could still be there.”
So, if Mars does still harbor life, it turns out this research connecting the Colorado River to that distant planet just might help scientists anticipate where that life still exists, making it the key to a successful mission, Hubbard said.
“Understanding how the climate evolved over time would tell us a lot about, if life did form, where it might be today.”
This story was produced by KUNC in partnership with The Water Desk at the University of Colorado Boulder’s Center for Environmental Journalism.
A man dives into a mountain lake on August 2, 2020. (Luke Runyon/The Water Desk)
In the arid West, water verbs are often bureaucratic. Rivers, streams and lakes are allocated, decreed, diverted, divided and used. Droplets are distributed to serve human needs. Scarcity drives the narrative in many of the region’s watersheds, where streams are given jobs—to irrigate crops, water lawns and flow through kitchen faucets. Water is a utility.
In her new anthology, Albuquerque-based author and journalist Laura Paskus invites readers to dispense with those concepts, and instead rethink their relationship to their favorite creek or pond. “Water Bodies: Love Letters to the Most Abundant Substance on Earth” is out this month from Torrey House Press.
Mostly featuring writers in the West, the collection includes essays and poems that delve into the personal, intimate connections that local watering holes can provide. It asks readers to think of the mystical and meaningful ways that rivers weave through human lives.
In early 2023, Laura invited me to write an essay for the book. In that message, she said she was looking for “ragged, heartfelt, sexy, raucous, loving, and wild essays and poems about western water.” Who could turn down that kind of invitation? I obliged, and my essay titled “Skinny-Dipping” is a chapter in the book.
To learn more about the book and the process of pulling it together, I sat down with Laura for an interview.
The following has been edited for length and clarity.
Luke Runyon, The Water Desk: So, there are a lot of books about water in the West out there. What makes this one unique or different from the rest of the pack?
Author Laura Paskus (Photo: Adria Malcolm)
Laura Paskus: As a climate reporter, environment reporter, water reporter, I’m often thinking about and writing about water on these big, landscape-level scales, like a watershed, or an entire portion of a river basin within a state. That’s great, and those stories are really important, but I wanted to create something that reminded us that water is extremely local and extremely personal.
So I reached out to and started with some of my favorite journalists, like yourself, who write about water in the West in a journalistic way. I reached out to you all saying, “I like the work that you do, and it’s important, but what I really want you to do is tell me a story about water that maybe you wouldn’t talk to anybody about or really want anybody to know.”
I really feel really lucky that I know personally so many of these writers who I admire, and could ask them to take the time to write these really, really personal essays about the waters that they love.
LR: Tell me about the title, “Water Bodies.”
LP: In the past few years, I’ve become pretty obsessed with this idea or belief that water has her own or their own consciousness and will and desire. As a journalist, I write about water all the time as irrigation water, water rights. Even water for ecosystems—it’s always water for something else.
I’m a little bit smitten with this idea of connecting with water as her own being. In the essay that I ended up writing for this anthology, I wrote about something that I’ve never talked about before, and that is this weird family story. It’s part of my past that I don’t really like, and I don’t really understand. But the more I thought about it and have thought about it over the decades, it’s a story that is a huge part of who I am. It’s probably why I obsess about water, and why I’m a little bit obsessed with this idea of water as having its own consciousness.
LR: Most of the contributors are based in the West. Do you think that Westerners have a unique relationship to water compared to other parts of the country or other places in the world?
LP: I want to say, yes, that we do. But I know people in every other part of the world would be like, whatever. In the arid West, in particular, I think we do have a unique relationship with water, because we’re always craving it, seeking it, hoping for it, praying for it.
As the West has been warming, and we’re seeing these bigger and more catastrophic wildfires, and now in New Mexico and certainly lots of other places in the West, I think our relationship with rain is changing. It used to be in summertime you could wholeheartedly pray for and wish for and hope for rains. Now, with the burn scars and the flooding that comes off of those burned soils, rains are also really scary and terrifying and destructive.
So I think in the arid West, in particular, we do have a really thoughtful relationship with water in ways that maybe other people don’t.
LR: Can you give some examples of the pieces that are in this book?
LP: Christi Bode, who is a documentary filmmaker in Colorado and does a lot of great work around water and community, wrote a really personal essay about watching the dwindling snowpack every year at the same time that she’s dealing with some really hard health issues and related heart issues. So she really opened up her heart, and I feel like she took a really beautiful risk with what she wrote.
Regina Lopez-Whiteskunk, who does incredible work around Bears Ears [National Monument] and all sorts of important issues around Colorado and in the Four Corners area, wrote a piece about learning how to carry water as a young woman, and the responsibility that that holds for her. I really love her essay.
Daniel Rothberg, another Western writer I adore, wrote about his relationship with water in the West. He grew up in Los Angeles, and he lives in Reno and is grappling with his relationship with water and moving water.
Another friend, Desiree Loggins, she’s an academic, and she wrote an essay about living at Zuni Pueblo and learning the history of the Black Rock Dam there. I just am so in love with everybody that contributed.
LR: What are you hoping that readers take away from this?
LP: I hope that everyone who reads it thinks about, “What waters do I love? Do I love the hiss of the water in my sauna at home? Do I love the rain? Do I love my town’s little river?”
I hope that people think about the waters that they love and why they love them and remember that those are worthy. I feel like there is this idea in our culture these days that it has to be big to be good, or it has to be far away to be special. I love connecting with where we are in really small and beautiful and long-lasting ways.
I know that this is a lot to ask people, but it is my hope that people who buy the book write all over it, that they write in the margins about waters that they love. I hope they flip it upside down and write a haiku on the side of it. I hope that these books get dirty and wet and covered in new words.