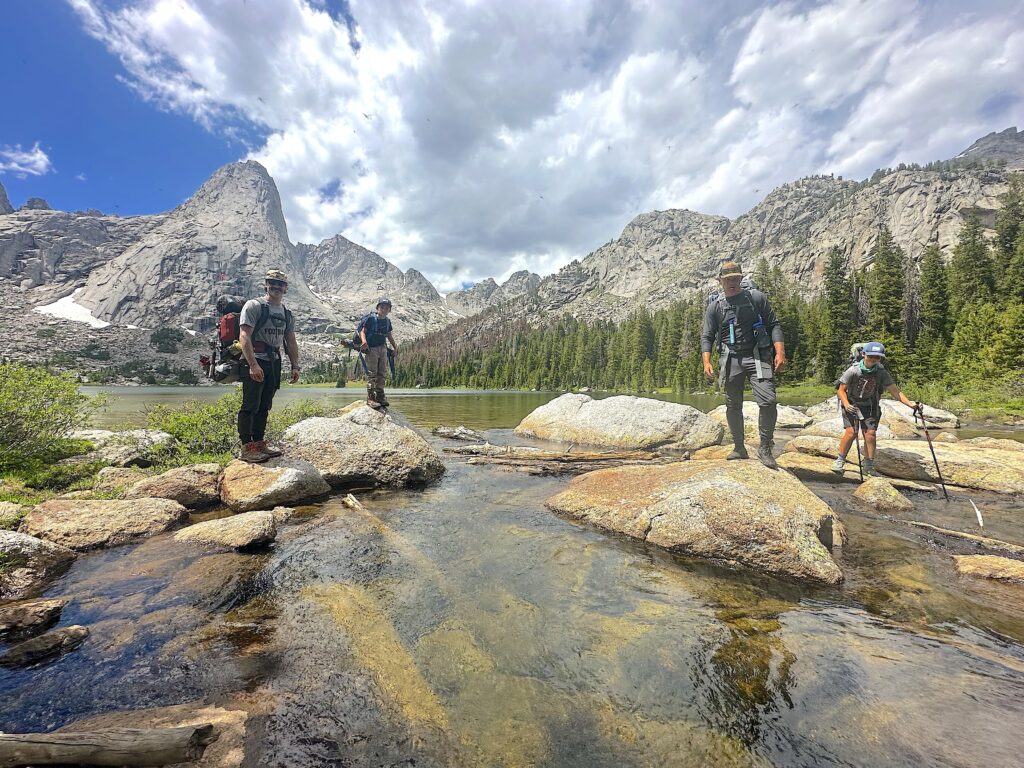
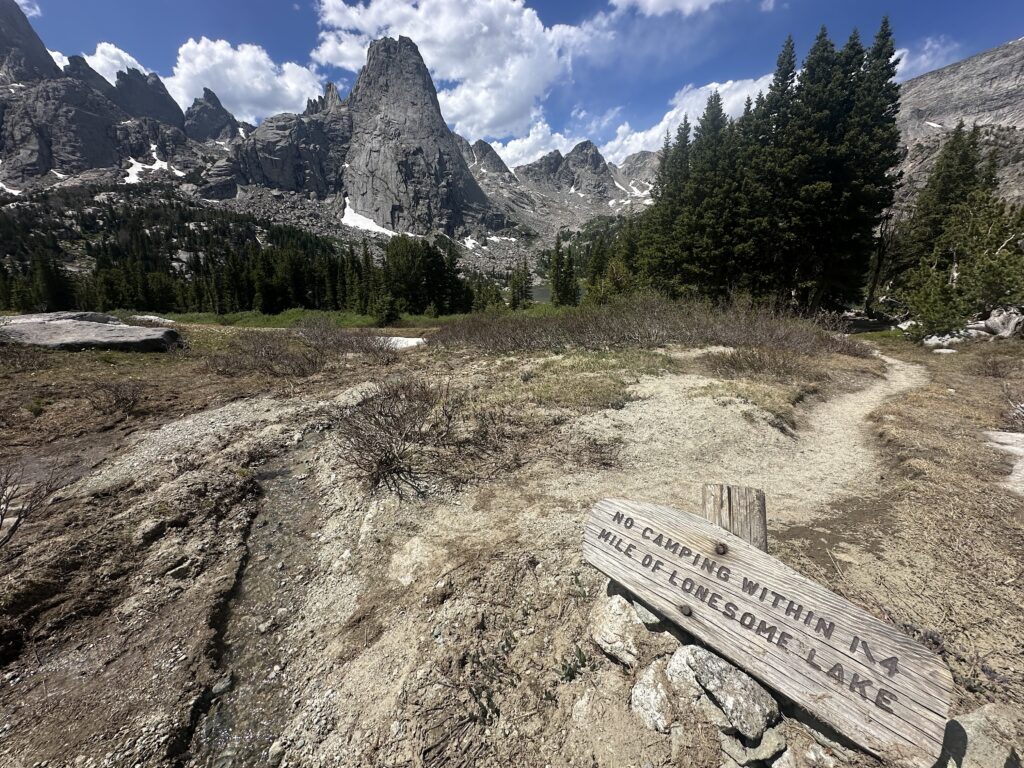
LONESOME LAKE, WYOMING—Whit Coleman belly flopped with style into some of Wyoming’s most famous alpine waters on a summer day.
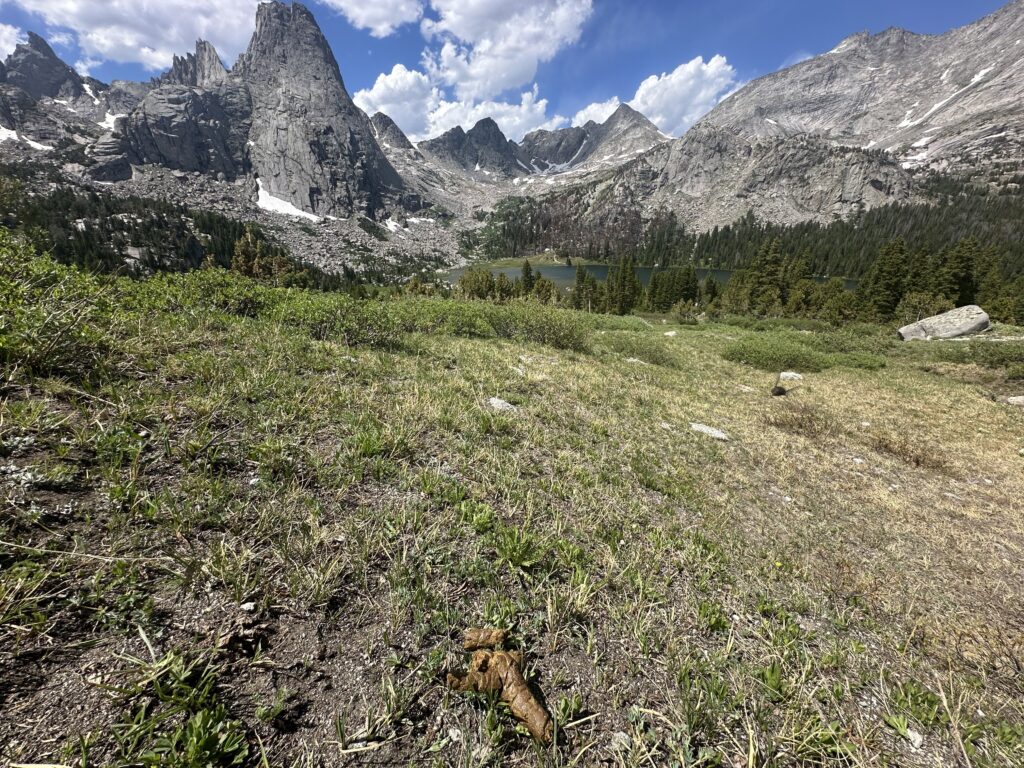
Out on a father-son backpacking trip with friends, the Salt Lake City man took the plunge with an incredible backdrop: the Wind River Range’s Cirque of the Towers, a semi-circle of big-walled granite peaks that all top 12,000 feet. The dip was pleasant, he recalled later in the day.
“It’s probably better that we didn’t know,” Coleman said. “We enjoyed ourselves. I’m not too worried about getting sick.”
Coleman learned of a potential health concern after the fact while hiking out from Lonesome Lake, which sits at the bottom of the cirque and forms the headwaters of the North Popo Agie River.
Lonesome Lake has long been reputed to be unfit for drinking and even swimming. That’s due to contamination presumed to be from the hordes of humans who poop while traveling through the popular backcountry basin. Now there’s a datapoint to back it up.
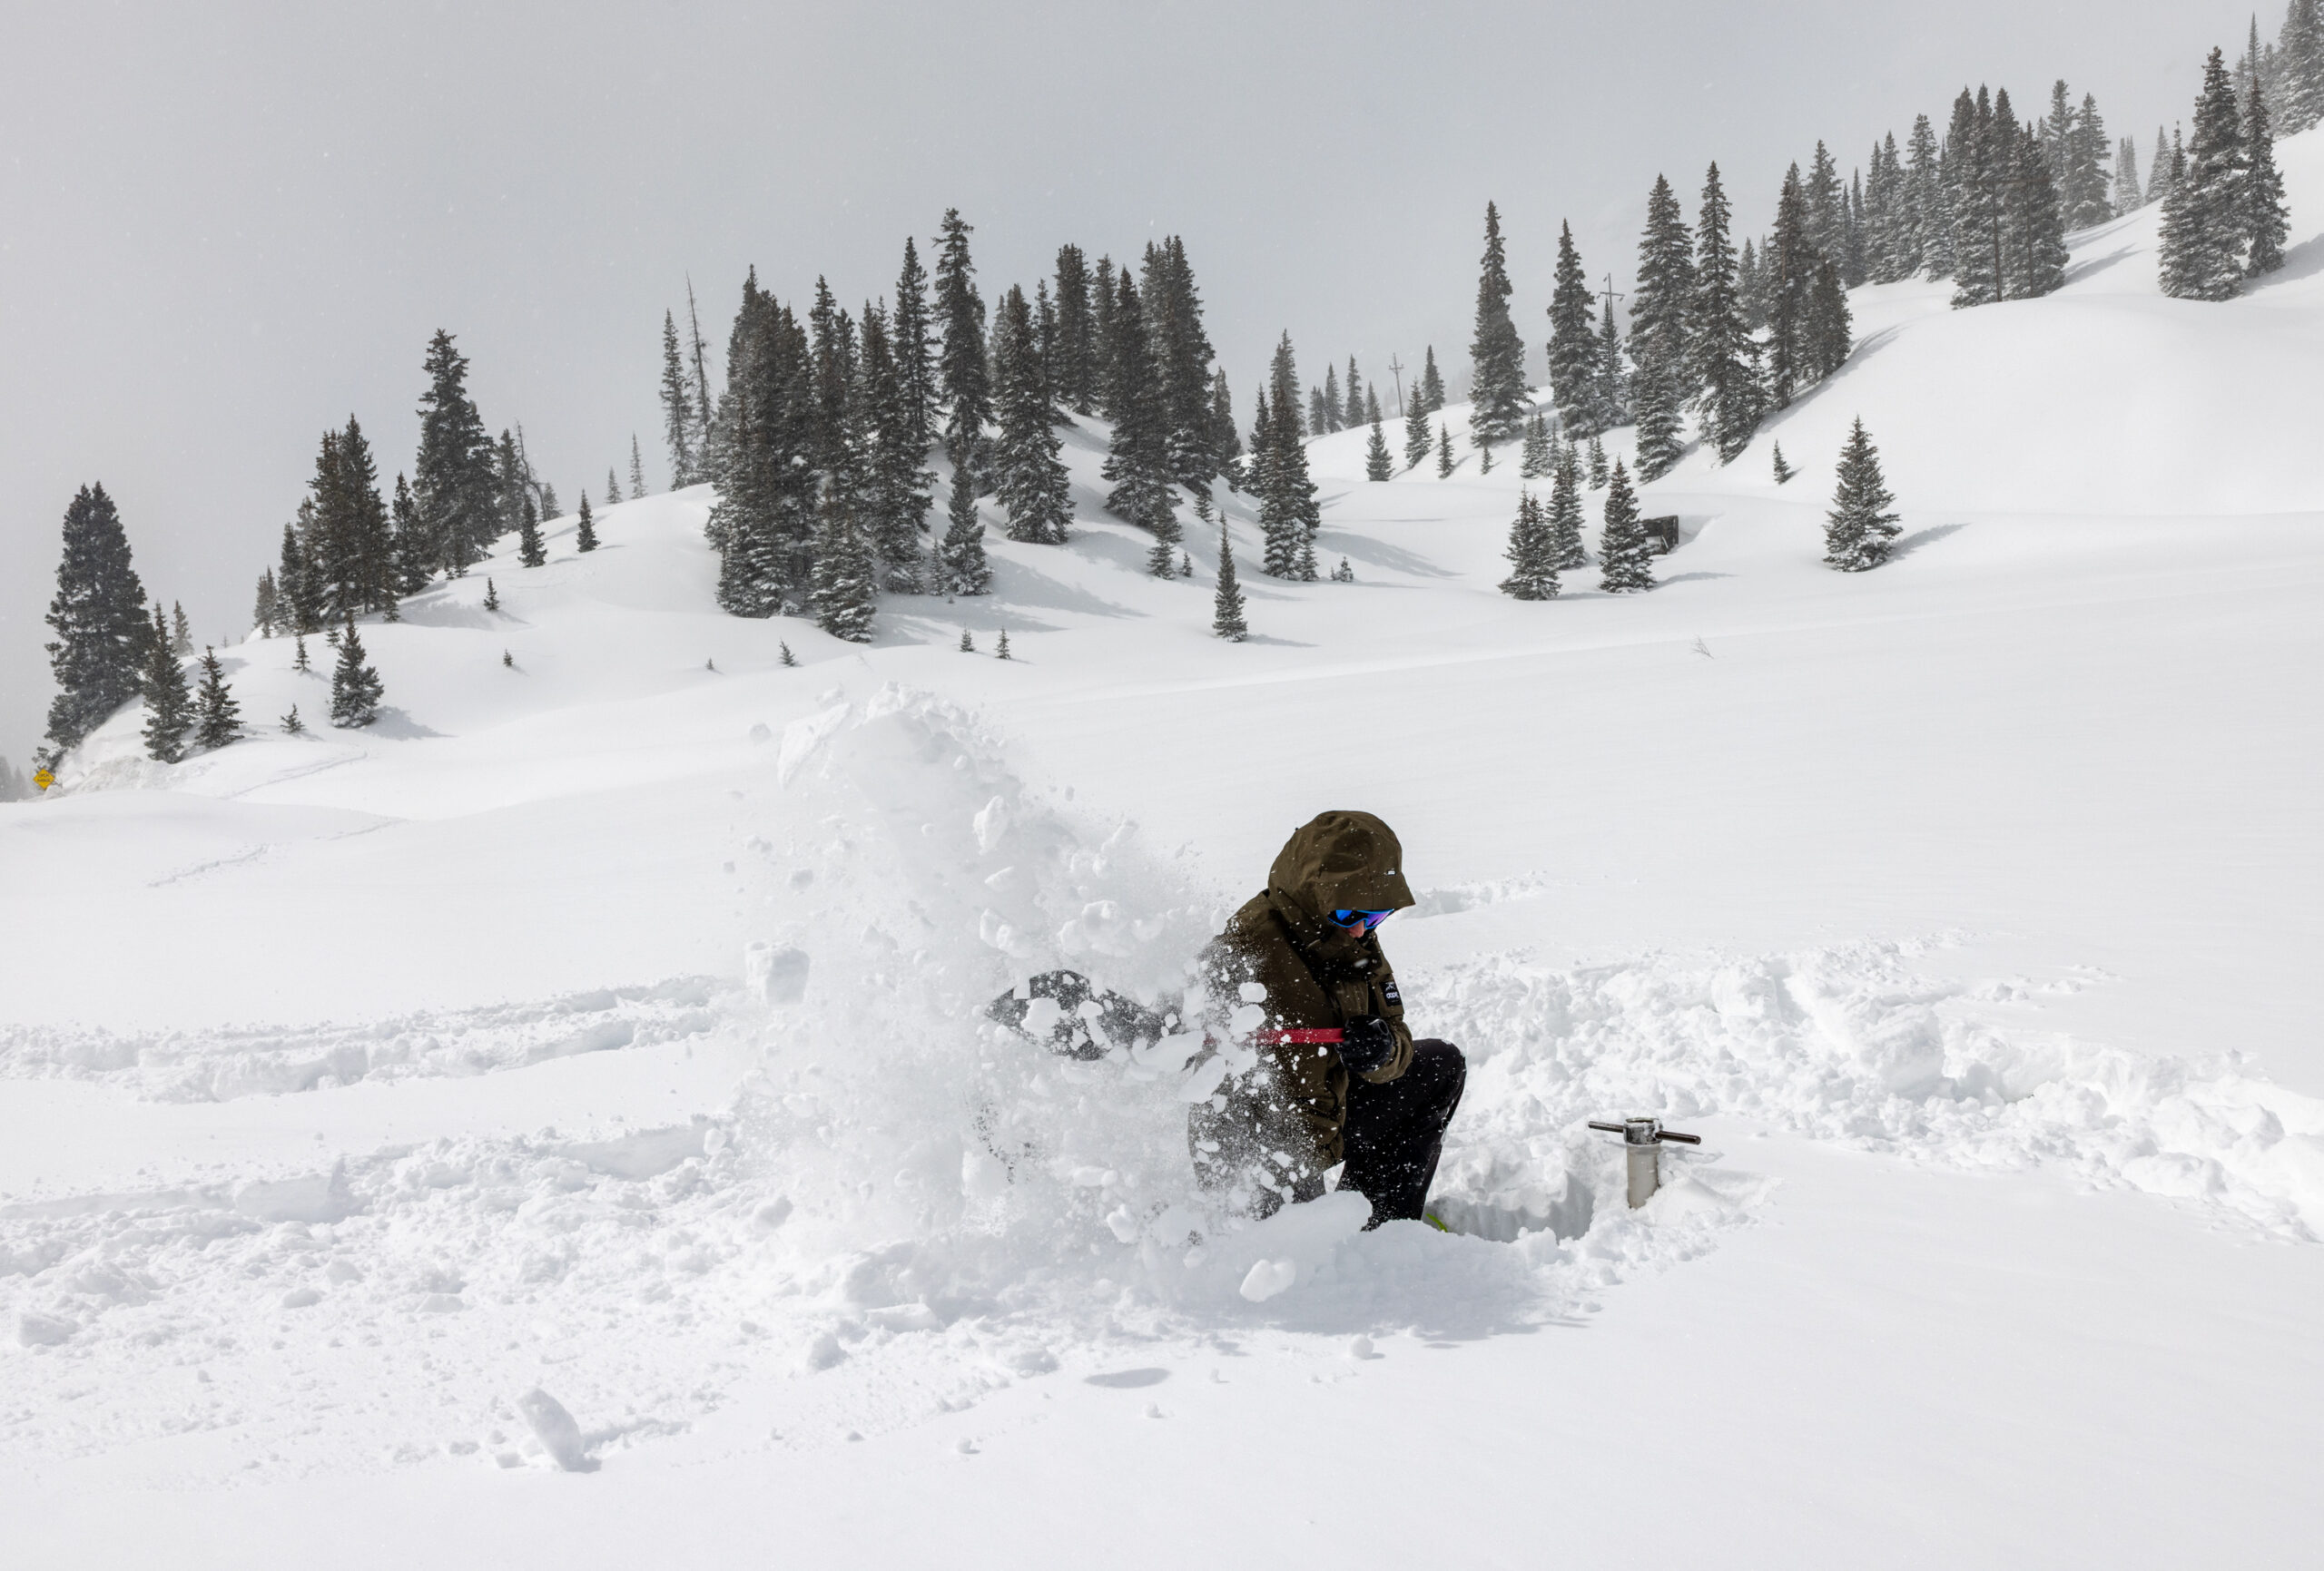
On Aug. 9, 2022, during the height of the recreation season, environmental regulators gathered a water sample from a foot below the surface near the outlet of Lonesome Lake.
The concentration of Enterococci — bacteria indicative of fecal matter — jumped off the page.
The U.S. Environmental Protection Agency didn’t make the results public for two years. When they were published, heads turned.
Lonesome Lake’s sample contained 490,895 calibrator cell equivalents of Enterococci for every 100 milliliters. The EPA’s safety threshold for swimming is 1,280 CCE/100 mL.
The concentration of fecal bacteria, in other words, was 384 times greater than the EPA’s criteria. Not only that, but the fecal bacteria were more concentrated in Lonesome Lake than in any of the other 981 lakes that were surveyed around the country for the federal agency’s National Lakes Assessment, which gathers data for randomly selected ponds, lakes and reservoirs every five years.
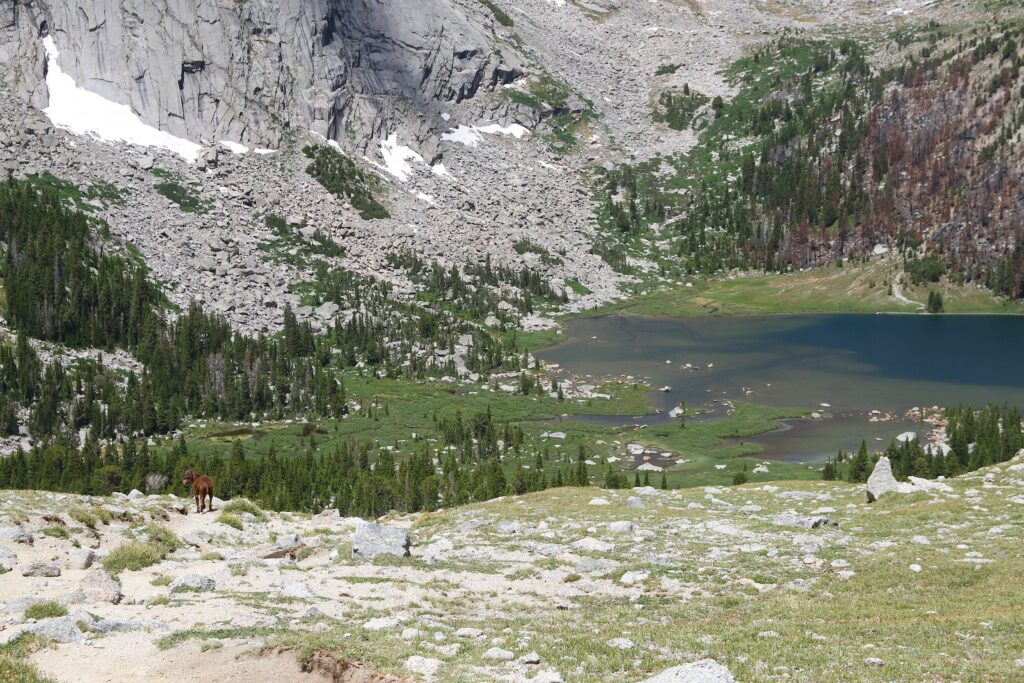
Arguably, Lonesome Lake was the most spectacular, remote waterbody in the broad study examining lake health all around the United States. Its snowmelt-fed 35 acres of crystal clear water, located within the Popo Agie Wilderness, are just a half mile off the Continental Divide along the spine of a mountain range that hosts more than two dozen glaciers and the highest peak in Wyoming.
And yet the data also suggested that Lonesome Lake’s water was the most polluted by poop. That’s especially remarkable given that the assessment also looked at lakes and ponds in urban areas and agricultural regions more typically associated with feces-related pollution.
Early in the process
The sky-high Enterococci concentration found during the EPA’s 2022 survey — sampling conducted by the Wyoming Department of Environmental Quality — set off a chain of events.
Because of its location in a designated wilderness area, Lonesome Lake is classified by Wyoming as a “Class 1” water. That’s a designation that protects uses like “primary contact recreation,” and demands that “nonpoint sources of pollution” be controlled through “best management practices.”
The DEQ and the Shoshone National Forest decided they needed more data to understand the scope of what’s going on.
“A single datapoint doesn’t necessarily tell us much of anything,” said Ron Steg, DEQ’s Lander Office Manager. “We need to get some real data to understand if there is a problem. If there is, we’ll react to the results of the data.”
In October 2022, weeks after the EPA results came out, staffers with the federal and state agencies trekked into the cirque to conduct follow-up testing. Gathering water samples outside of the busy backpacking and climbing season — trail-counter data shows that use virtually shuts off entirely come mid-September — they weren’t able to detect any levels of another fecal indicator bacteria, Escherichia coli (E. coli).
That sample was collected “well past peak recreation season, from a source standpoint,” said Jeremy ZumBerge, who supervises DEQ’s Surface Water Monitoring Program. “You’re also past peak exposure time — when people are most likely to be exposed.”
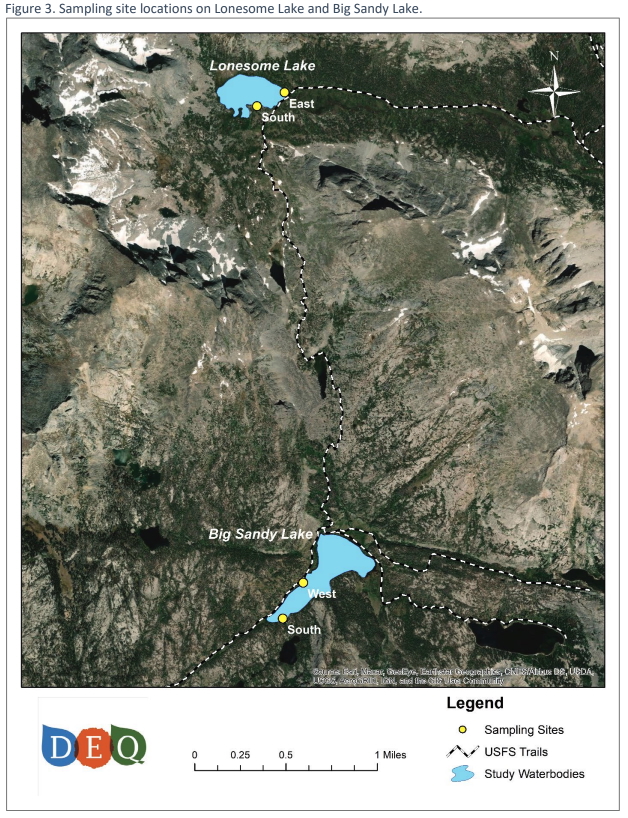
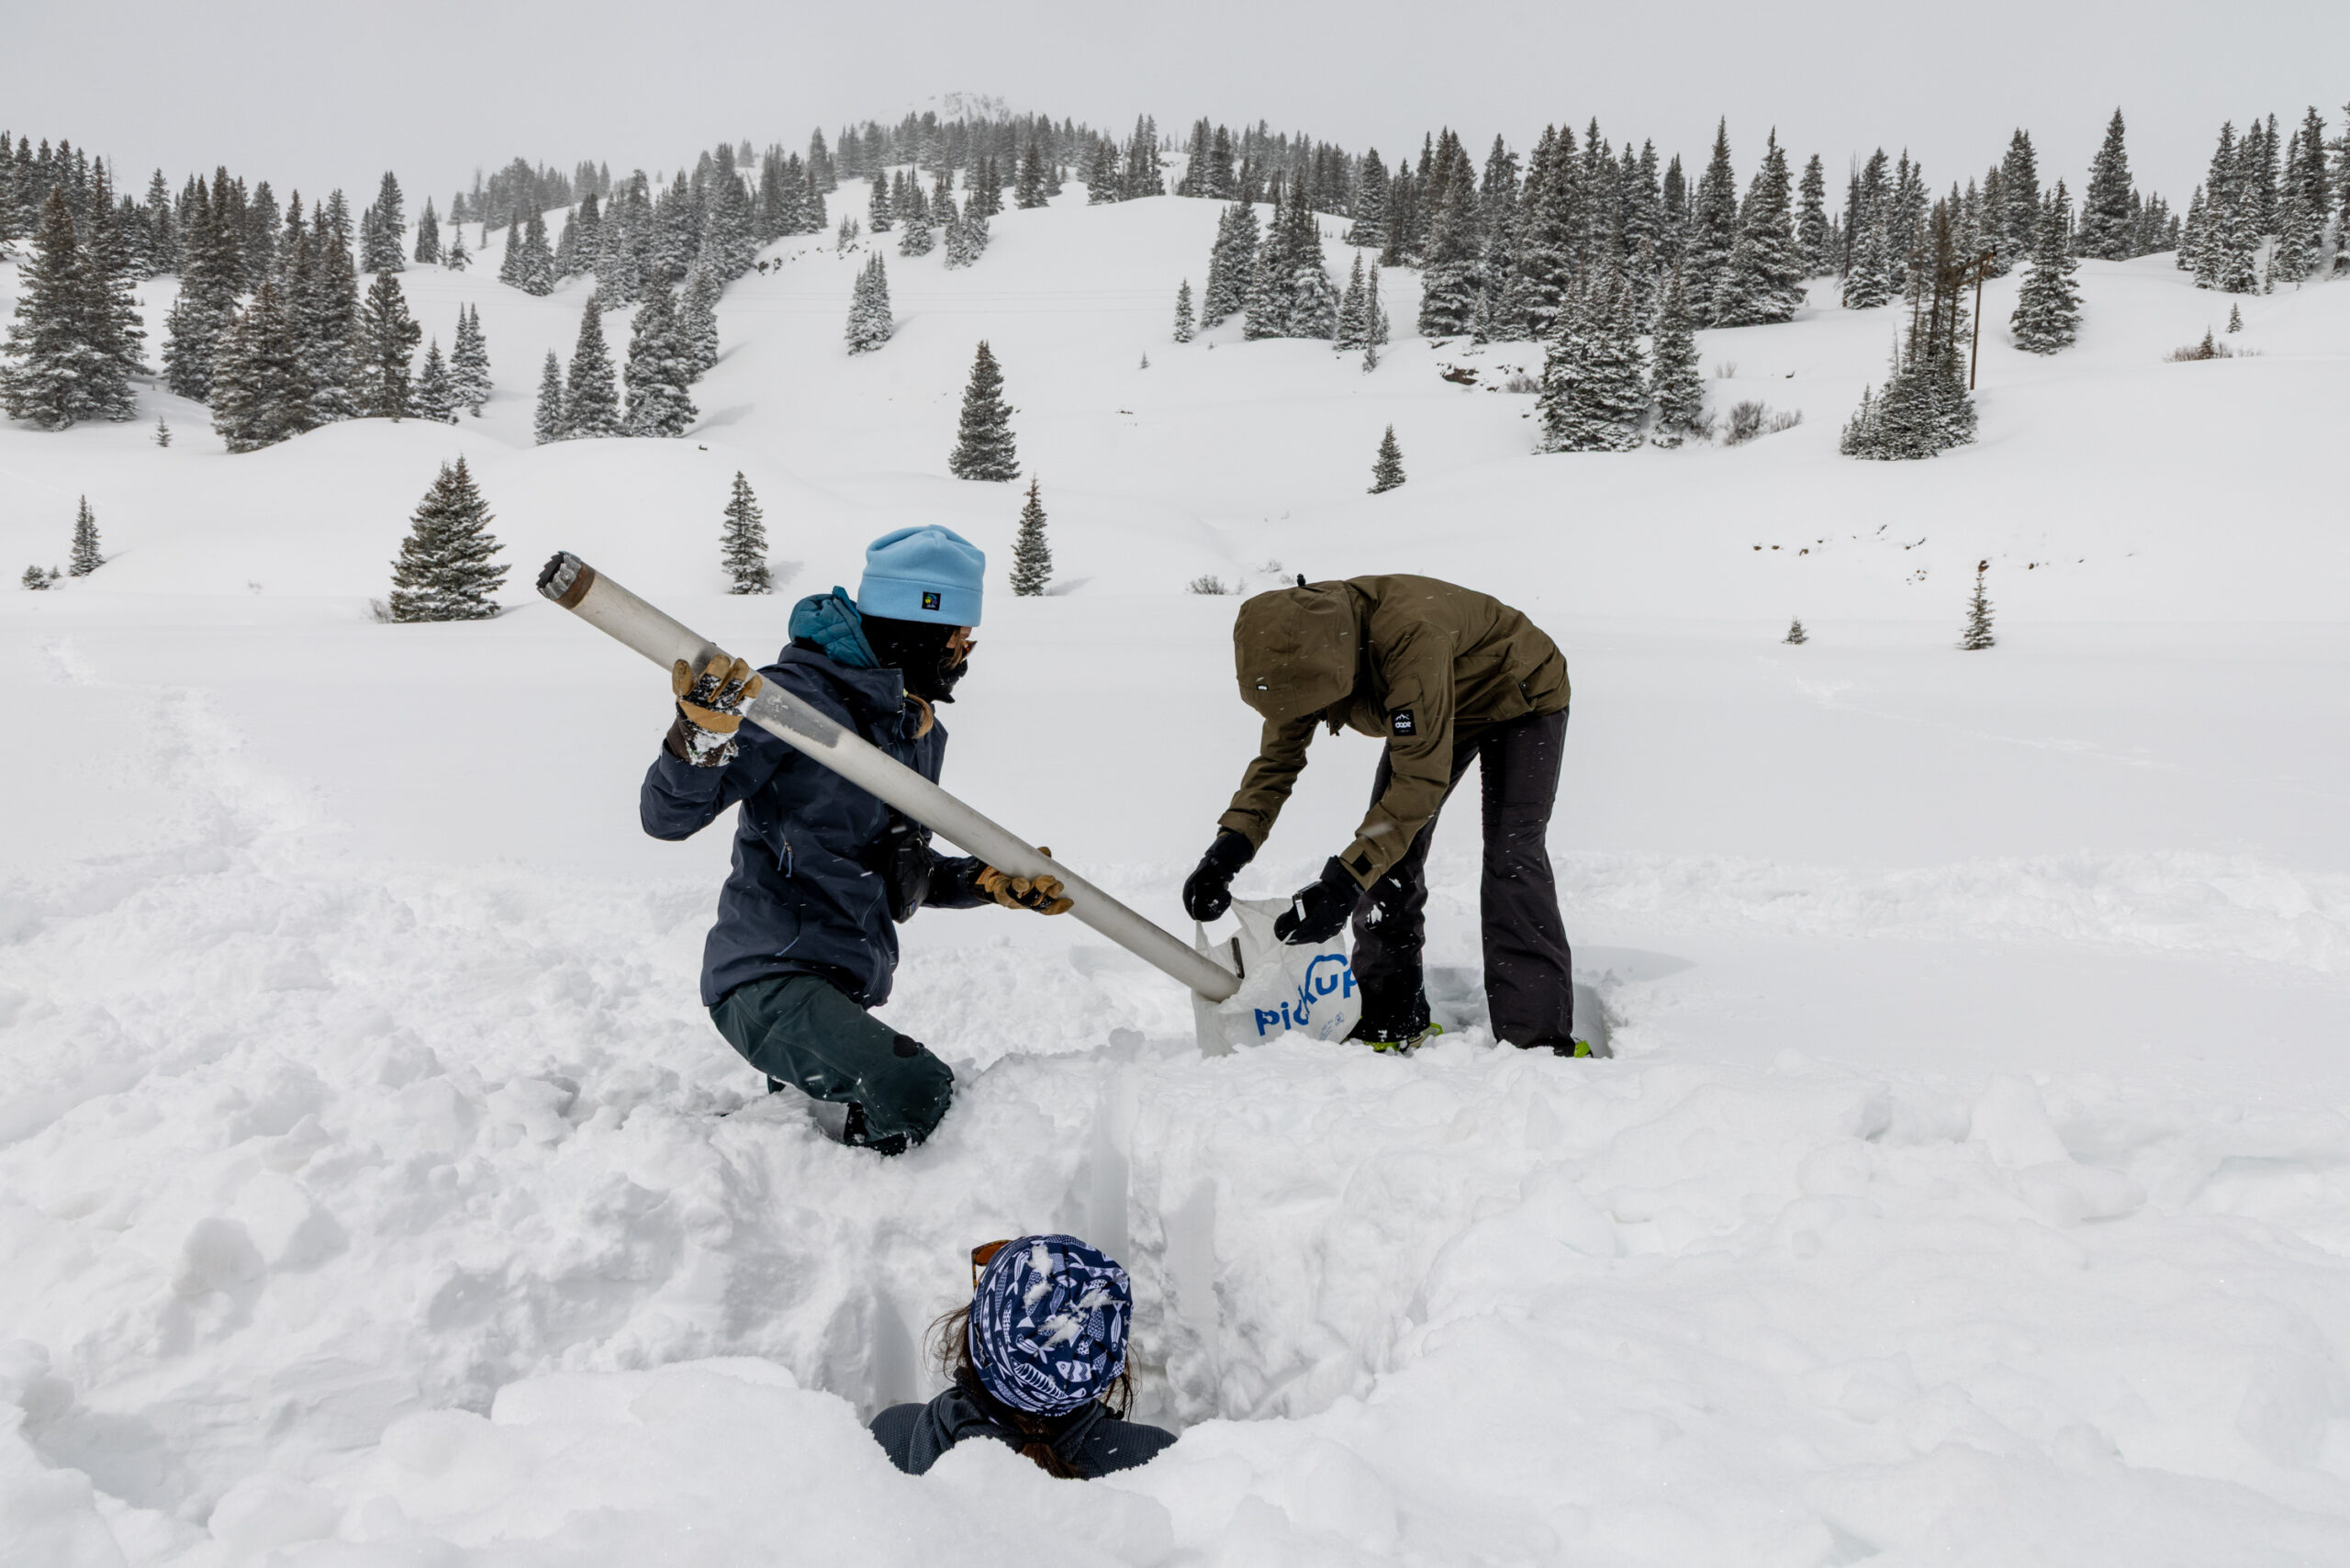
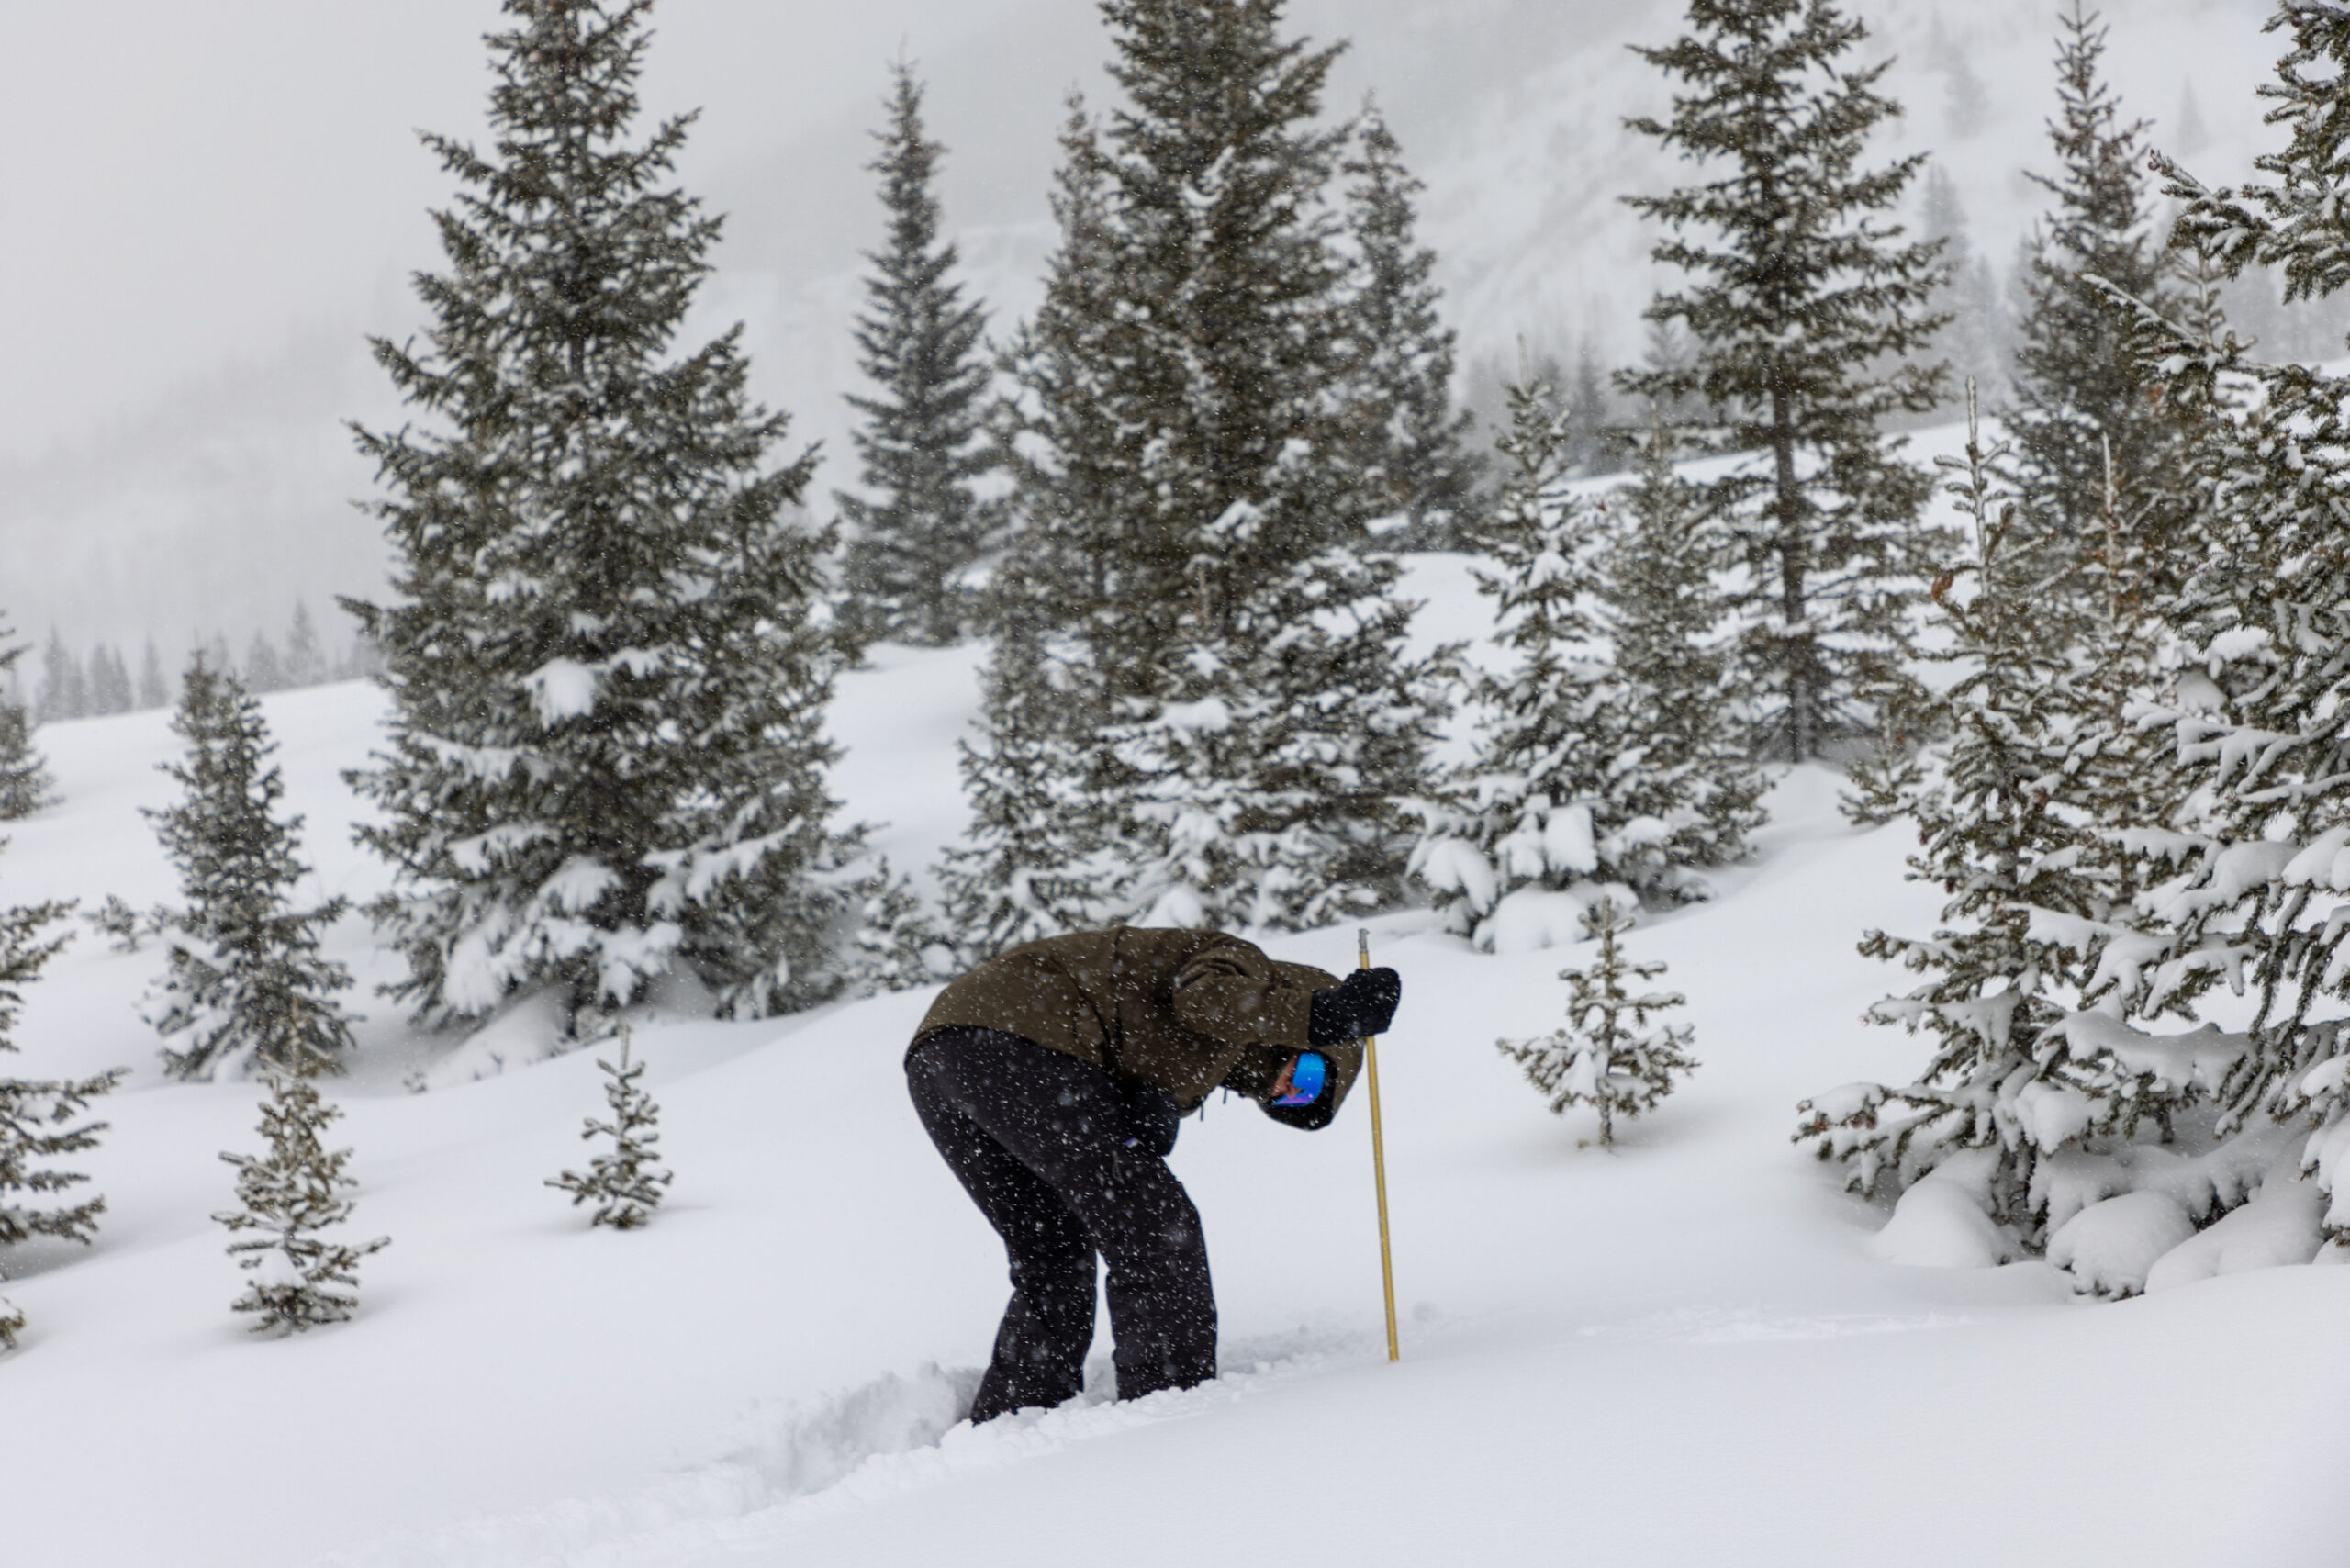
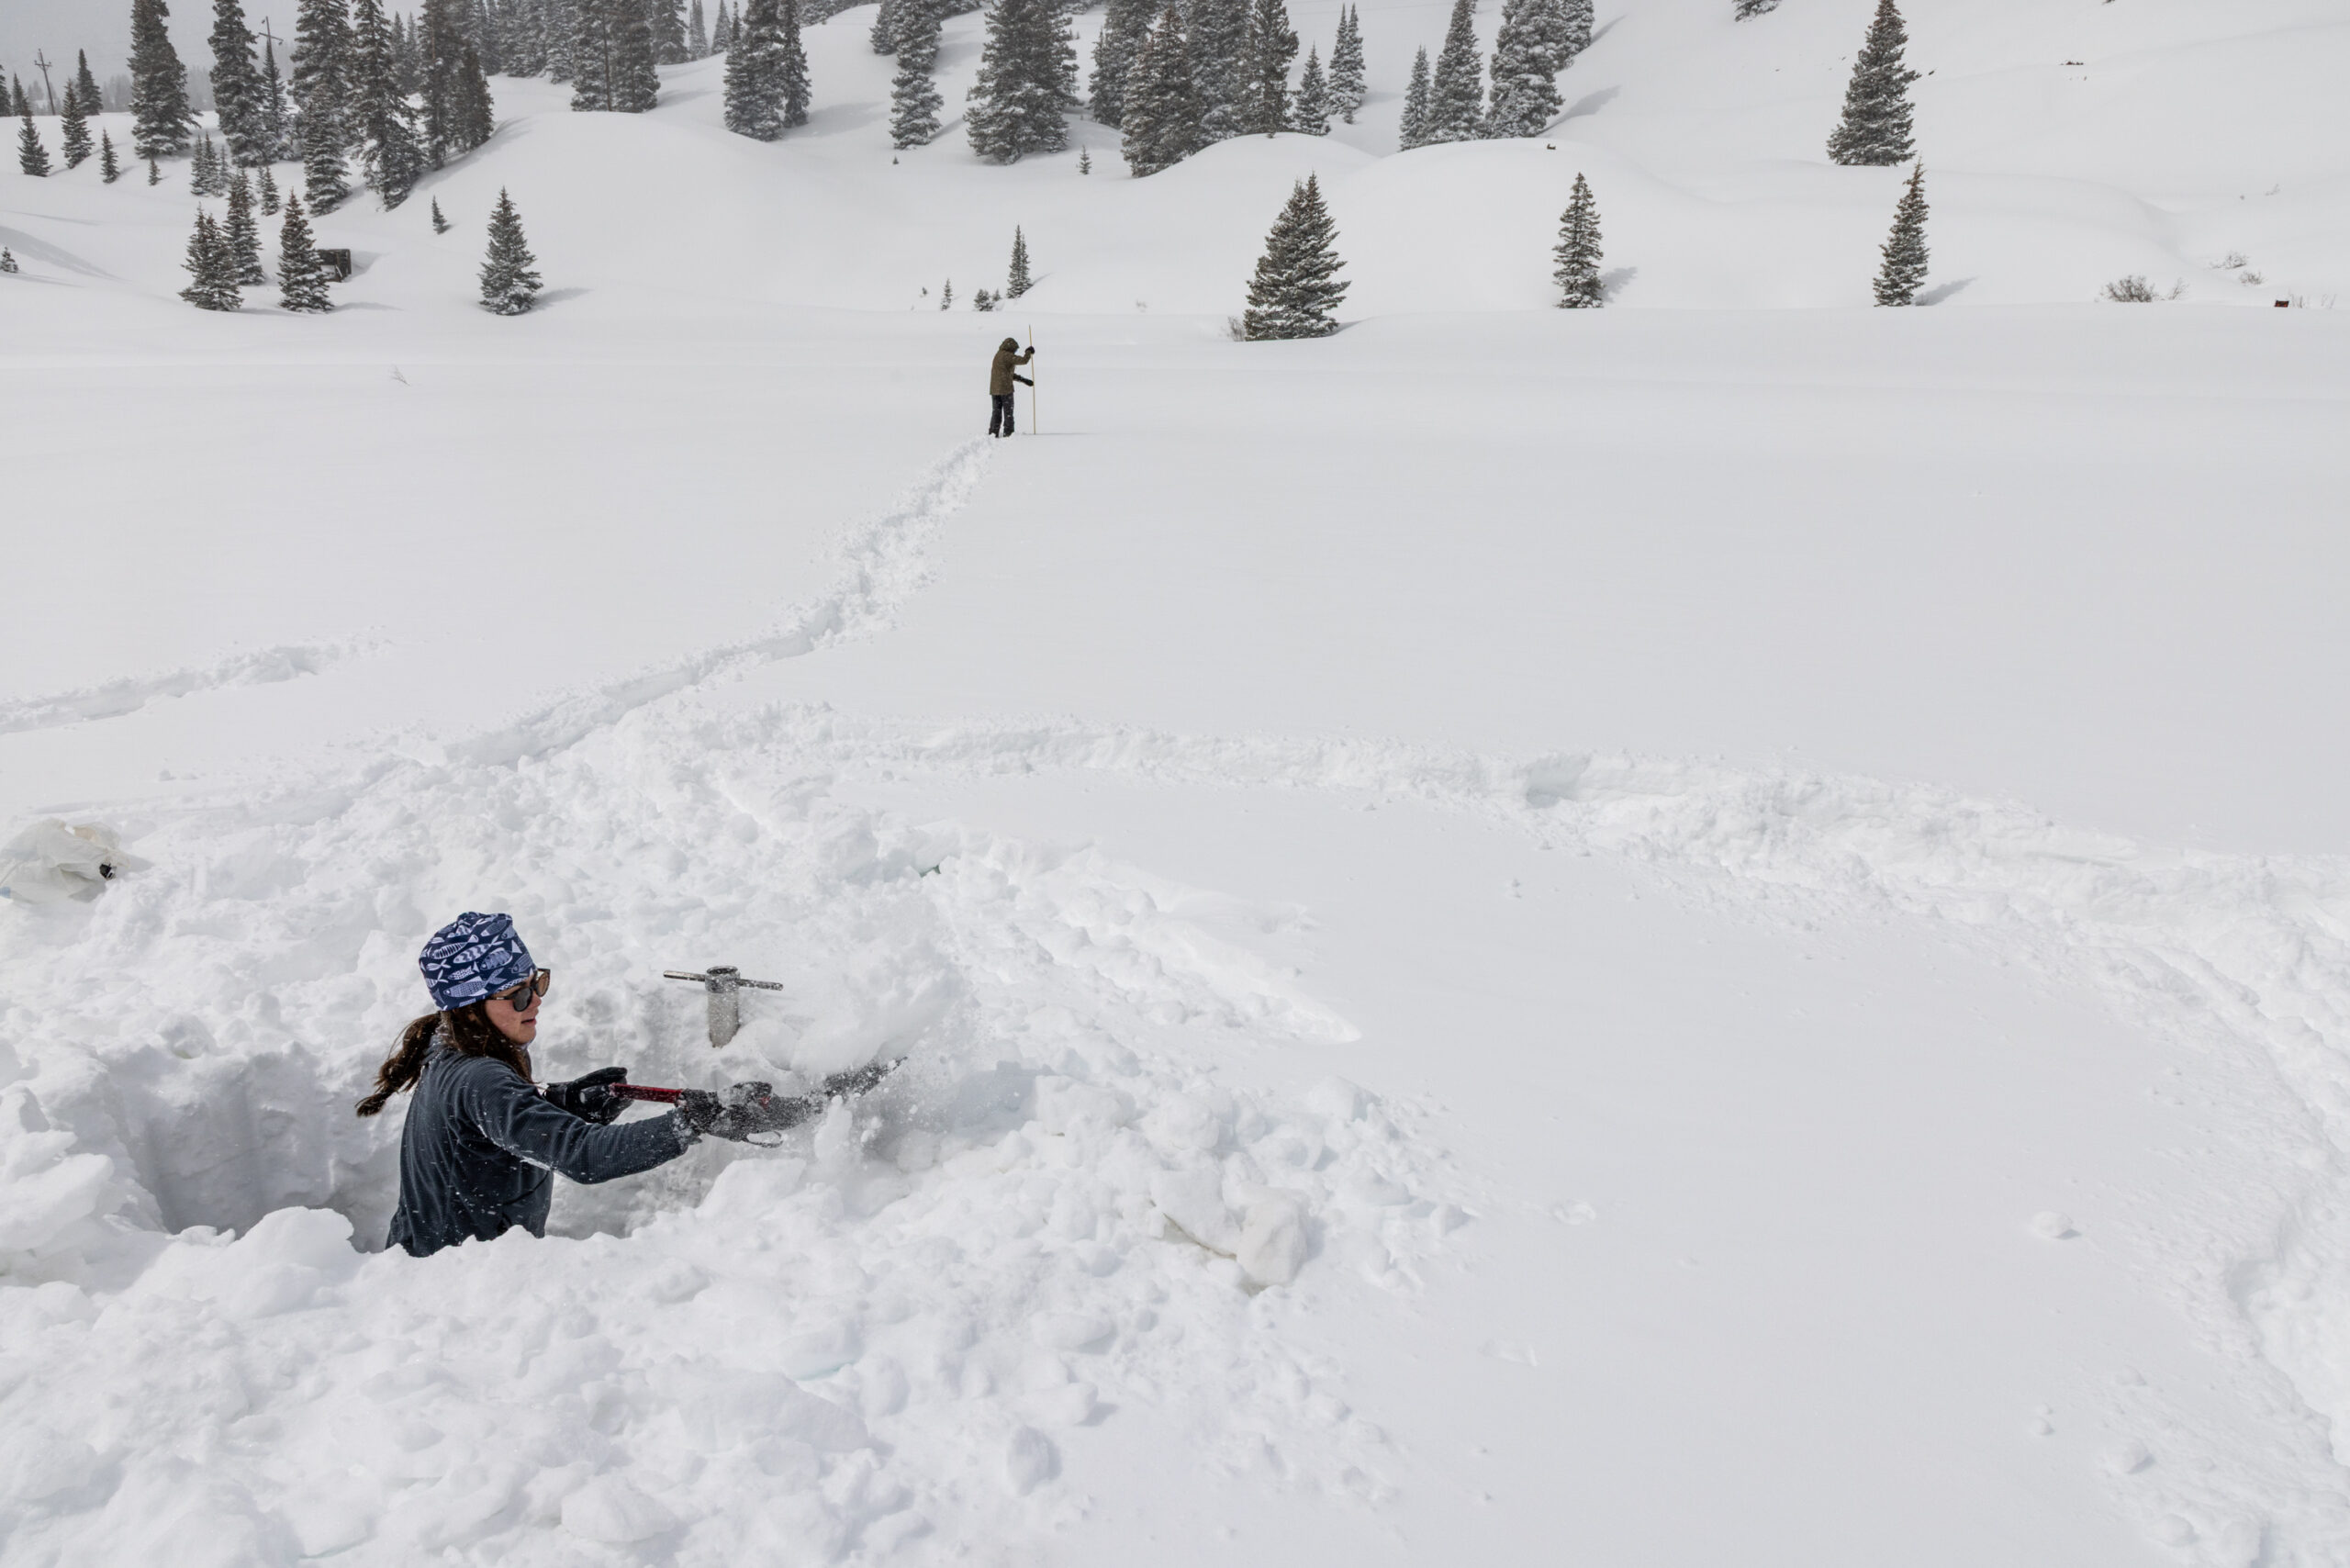
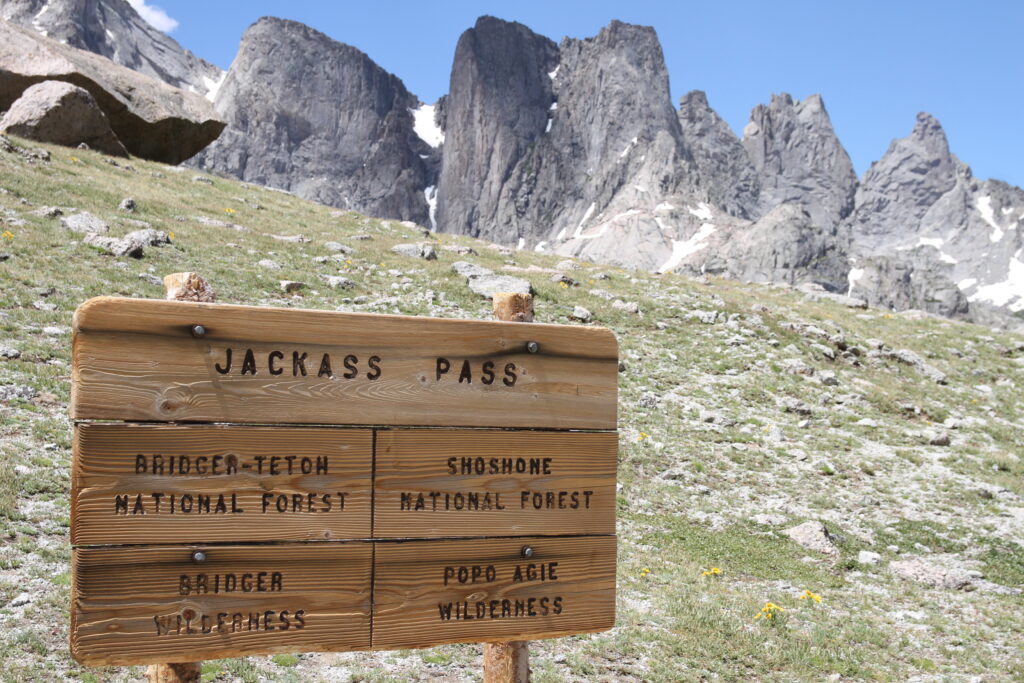
This summer, a much more extensive effort is underway to suss out what exactly is going on in Lonesome Lake. Between July 14 and Sept. 11, DEQ and U.S. Forest Service officials will take five samples near the south and west shore, where trails come down off of Jackass Pass and the North Fork and concentrate use. While they’re at it, the team of hydrologists and watershed protection specialists will also take water samples from Big Sandy Lake, located on the Bridger-Teton National Forest.
“That was of interest to the Forest Service, knowing that Big Sandy is also a very popular destination — and it is very convenient, as it’s off the main trail used to access Lonesome Lake,” ZumBerge said.
The specifics of the joint state-federal investigation are laid out in a “sampling and analysis plan” for Lonesome and Big Sandy lakes that Wyoming DEQ published in March. The results will be published in a subsequent DEQ assessment report.
The scientific inquiry has the potential to elucidate an environmental hazard that frequent Wind River Range travelers have long been aware of. It’s no secret: Lonesome Lake’s diminutive watershed — just 2 square miles — is thought to be overrun with poop that makes its water unsafe. The guidance is all over the place online, and is also frequently passed along word of mouth.
Poop lake
“I tell people definitely do not swim in there, I tell people definitely do not drink the water,” said Brian Cromack, an employee of Pinedale’s Great Outdoor Shop who often advises Wind River Range travelers. “It’s been heavily contaminated for a long time, just via the negligence of outdoor recreation enthusiasts over the years.”
Fecal bacteria readings 384 times the safety threshold “sounds about right,” Cromack said.
“Hopefully, people are more mindful,” Cromack said. “I think the big problem why Lonesome Lake is so bad is because of the serious climbing prevalence there. Generally, backpackers are a little bit more conscientious about how to dispose of their waste. Not to rag on any one group — I love to climb.”
Regardless of who’s doing the pooping, there’s a lot of it and it’s easy to find.
WyoFile visited Lonesome Lake in July and within minutes found seven makeshift latrines in likely areas — in the trees, not far off the trail. Most were loosely buried to varying degrees. In other places, toilet paper and excrement had become exposed.
And it’s not yet peak busy season. Early July, according to the trail-counter data, attracts 100 people or fewer to Lonesome Lake weekly. By early August, the weekly counts crest 250 wilderness travelers, and by the middle of August, a whopping 400 people are trekking into the Cirque of the Towers every seven days.
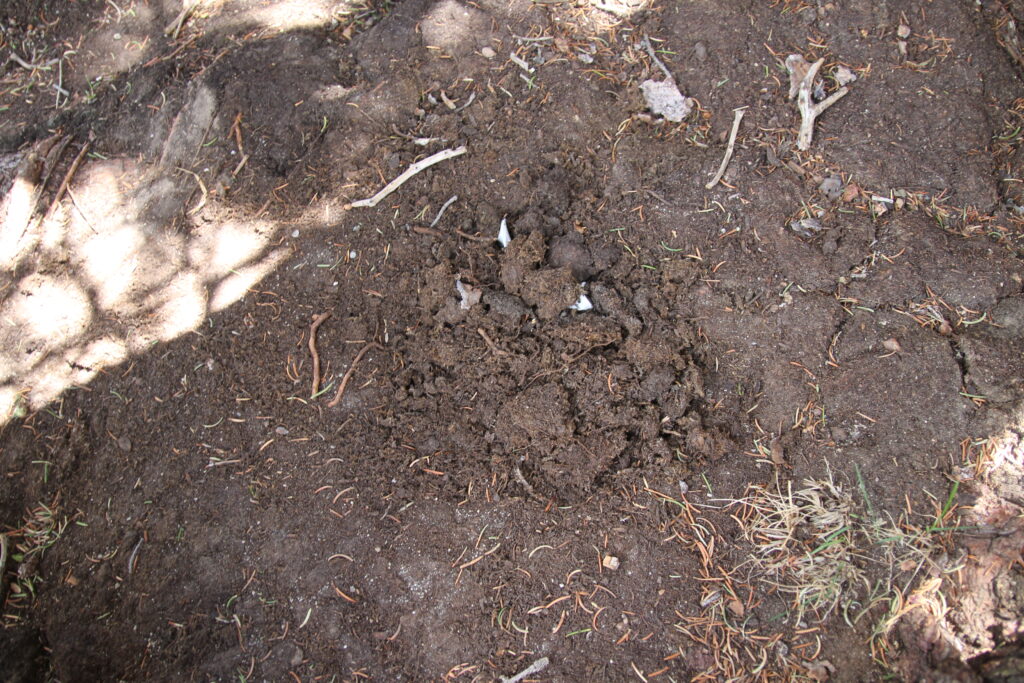
Collectively, it’s a lot of biomass. A decent chunk of it gets left behind. Back-of-the-napkin poop math suggests that, at roughly a quarter pound per stool, perhaps 100 pounds of human feces are getting squished under rocks or buried in the shallow soil that rings Lonesome Lake on a weekly basis during the height of summer.
“I don’t know specifically how that [fecal bacteria] transport to the lake could occur,” said ZumBerge, the Surface Water Monitoring Program supervisor. “I imagine there’s a few different ways that transport can make it to the lake — if it’s happening.”
At between 10,000 feet and nearly 13,000 feet in elevation, the Cirque of the Towers and the basin it surrounds are buried by feet of snow each winter. It melts off in the spring and summer, bound for the low point of Lonesome Lake.
Possible fixes?
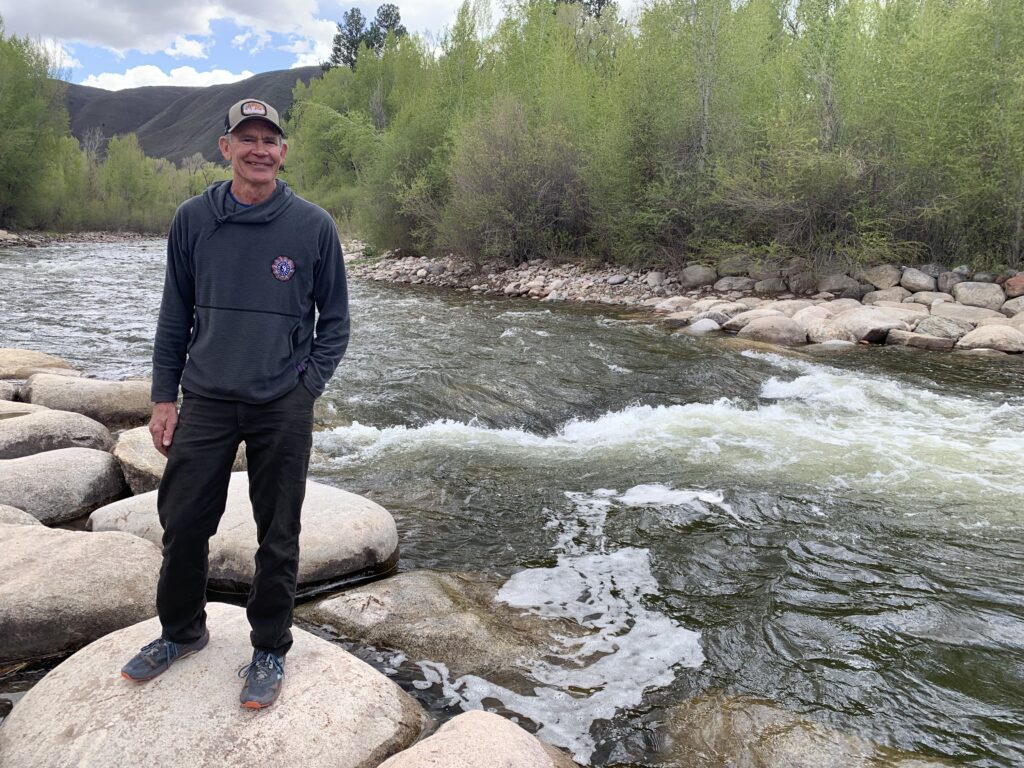
Hiking along Lonesome Lake’s southern shoreline on a July afternoon, Glenwood Springs, Colorado, resident Carl Meinecke, an arborist, wasn’t so shocked by the fecal phenomenon.
“It’s not completely surprising,” Meinecke said. “Things aren’t like they used to be. We’re getting such high use in some of these areas, it becomes tricky.”
The regulations on many western rivers, he pointed out, require that campers carry out their waste in specialized containers known as wag bags or a groover.
“That would be pretty tough here, carrying it out,” Meinecke said.
It wouldn’t be unheard of.
As nearby as Grand Teton National Park, poop-removal regulations are in place. Portable toilet systems are required for backcountry camping on Jackson Lake and all overnight users of Garnet Canyon must pack out their human waste in EPA-approved containers, according to the park regulations.
Steg, at the DEQ, emphasized that it’s tough to know what the future holds. But if the data bears out, he said, the fecal bacteria concentrations will “certainly need to be addressed.”
“It’s a very unique situation to have a water quality issue this many miles into a wilderness area,” Steg said. “It’s not something that any of us have regularly dealt with. We’ll see where the data points us.”
ZumBerge, his DEQ colleague, was unaware of any other Wyoming waters where human use has been implicated in a fecal bacteria problem. During the 2022 EPA assessment, there were 27 total lakes randomly sampled in the state, including six in the Wind River Range.
“Lonesome was the only one that rose to our attention as being potentially elevated,” ZumBerge said.
Environmental regulators do have tools at their disposal designed to address water quality problems. “Total maximum daily load” [TMDL] plans, for example, are years-long strategies commonly used to bring waterways into compliance with the Clean Water Act. In Wyoming, they’ve been used to attempt to address livestock feces-related E. coli bacteria pollution in places like Star Valley’s Salt River.
Steg, who supervises that program, said it’s way too early to say if a TMDL will be necessary for Lonesome Lake.
“That’s a pretty big tool for a pretty simple problem — if, in fact, there is a problem,” he said.
This story is produced by WyoFile, in partnership with The Water Desk at the University of Colorado Boulder’s Center for Environmental Journalism.