
A version of this post originally appeared on Snow News on December 12, 2023.
When snow is incoming, I turn to the Winter Storm Severity Index (WSSI).
WSSI is a helpful, pragmatic, and relatively new forecast product that’s meant to communicate weather-related risks to the general public and illustrate the threat that snow, ice, and wind pose for transportation, infrastructure, homes, and businesses.
Created by the Weather Prediction Center (WPC), part of the National Weather Service, WSSI is designed to convey the “societal impacts” of winter weather. Epic snowstorms not only make for fun powder days but also can kill and injure people while disrupting life across an entire region.
While winter storms usually can’t compete with flooding, tropical cyclones, and other severe storms in terms of the havoc they wreak, it’s worth remembering that damages sometimes exceed $1 billion.

WSSI “highlights regions and localities with the forecasted potential of damaging and life-threatening effects brought on by winter weather,” according to a helpful story map from WPC. The effects include “tree damage, school closures, transportation issues like flight cancellations, traffic accidents, and road closures.”
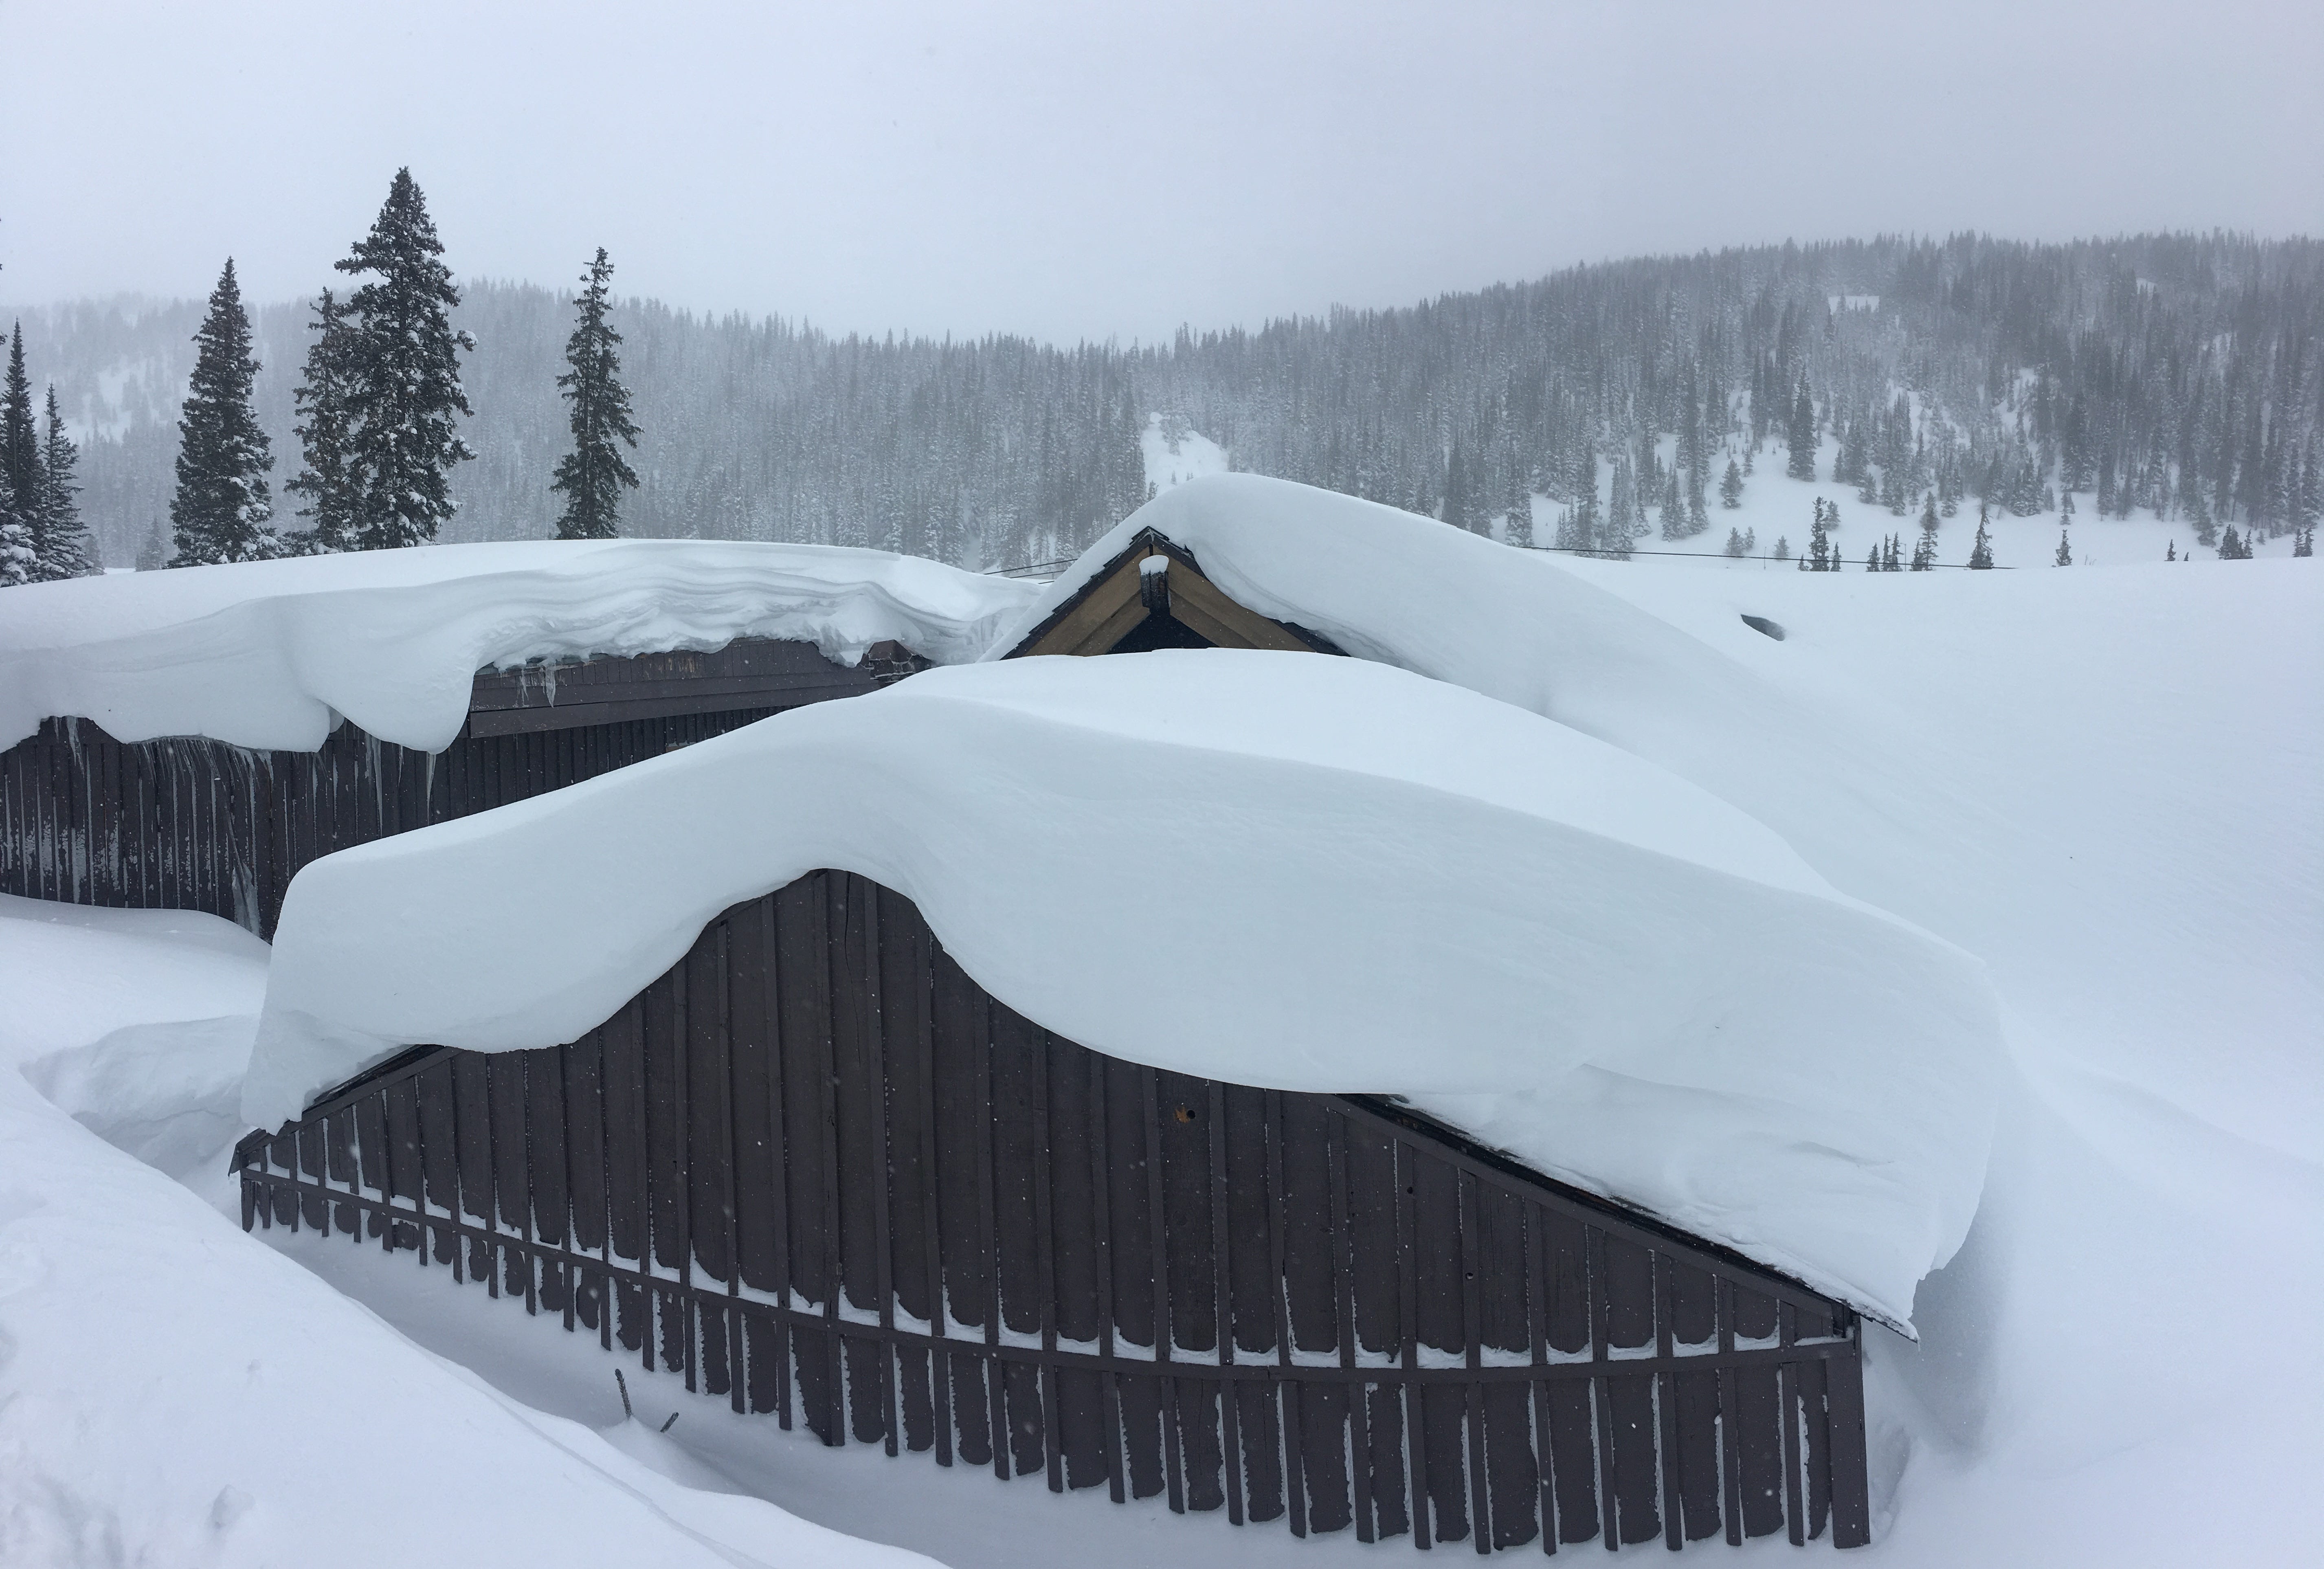
To get a sense of the potential problems, check out this November story from the Los Angeles Times about last year’s catastrophic winter, which left some residents with “PTSD for snow.”
“For weeks last winter, many San Bernardino Mountains residents remained trapped in their homes, buried under as much as 12 feet of snow, some without power for as long as six days,” according to the story. “Almost 350 residences and businesses were damaged or destroyed — including one of the area’s largest grocery stores, whose roof collapsed, and several houses that exploded because of buried gas meters. An estimated $143 million in losses to private property was tallied.”
Below is an example of a WSSI map that I snagged on November 30 while the Pacific Northwest was getting pounded by an atmospheric river.
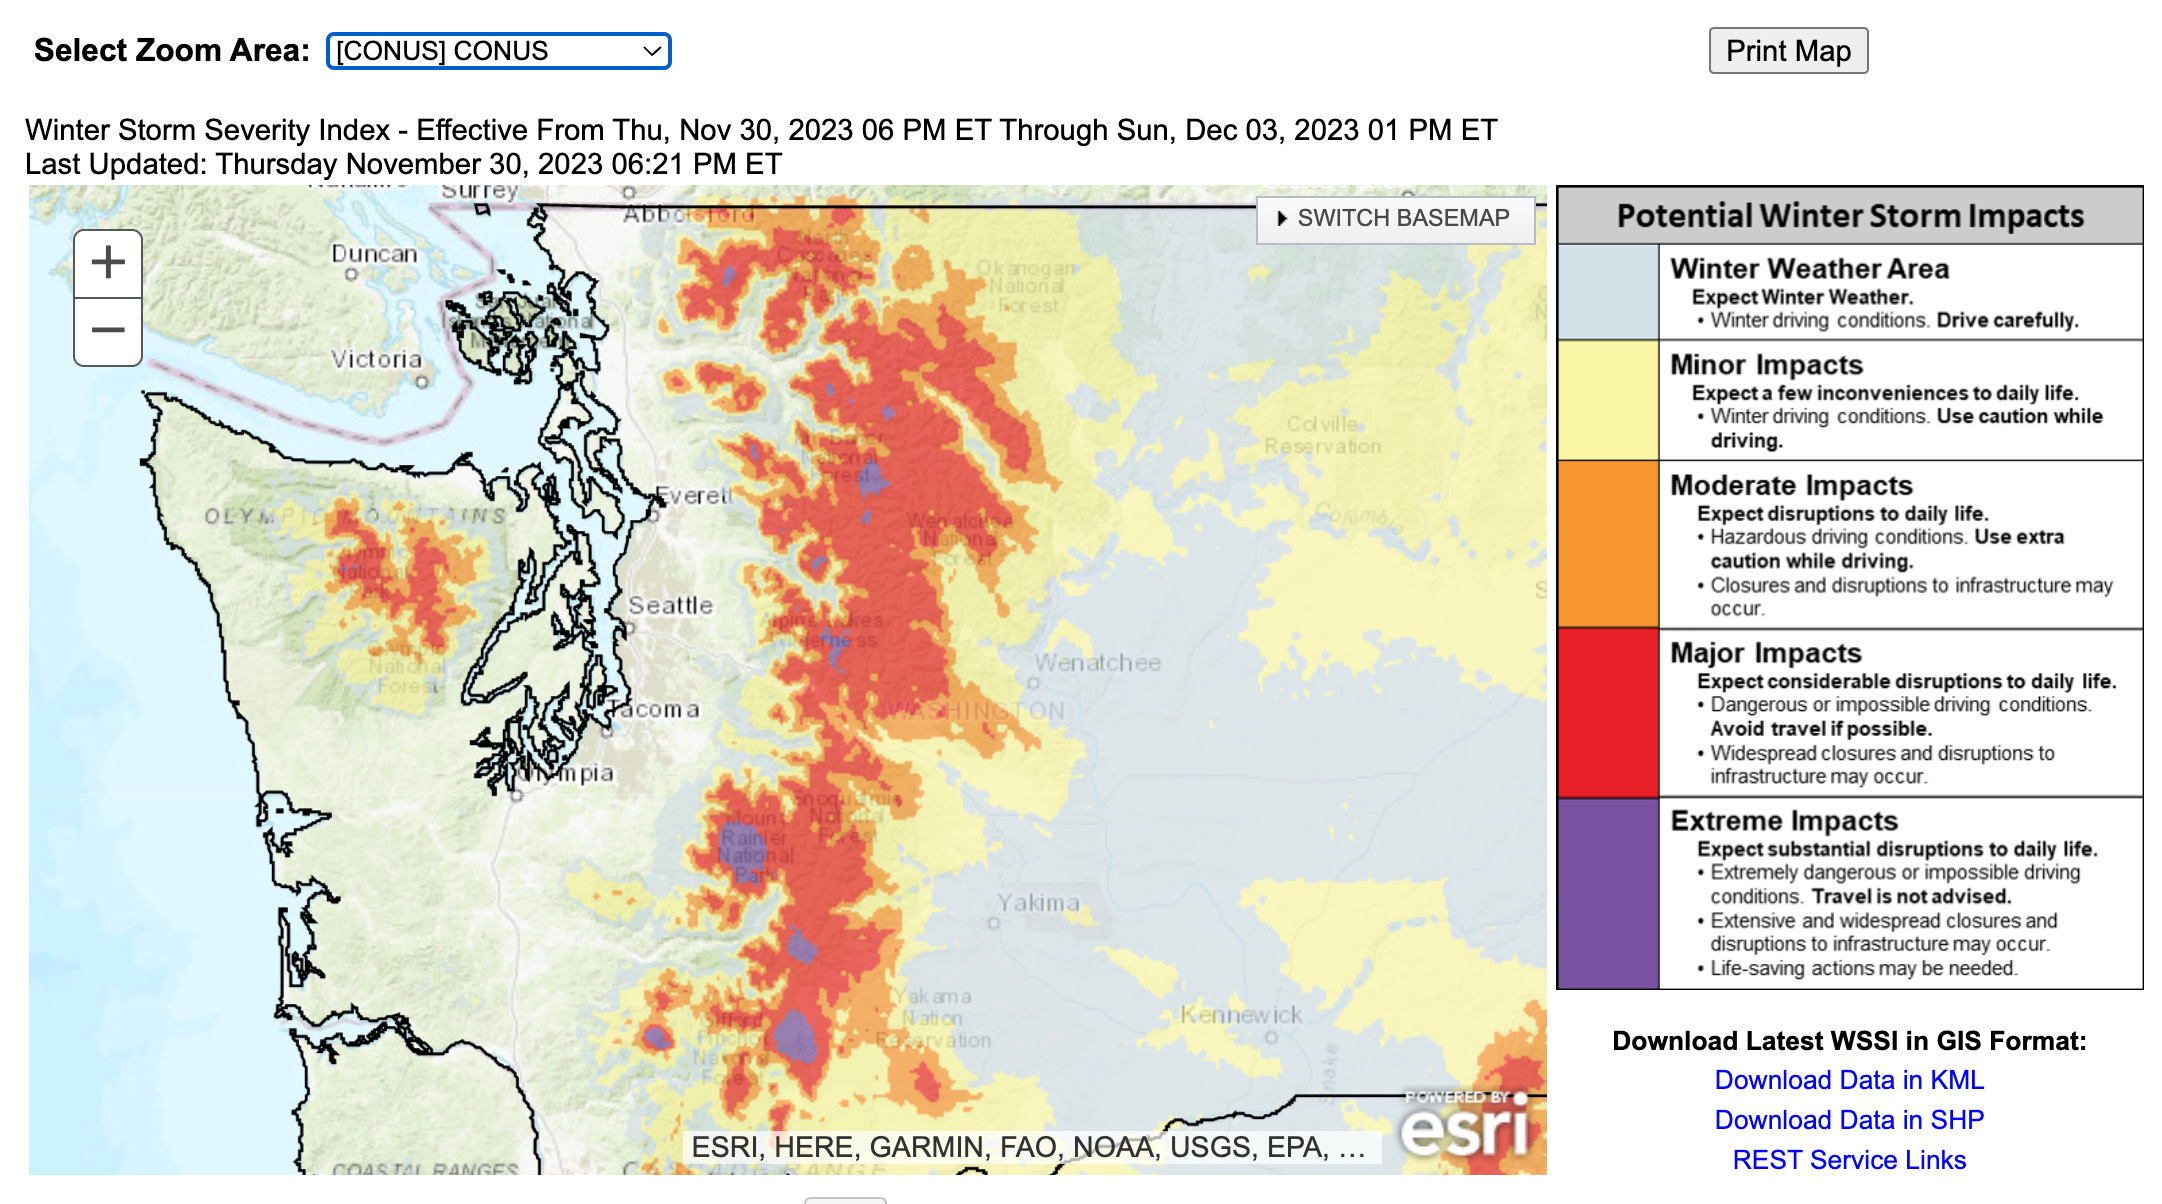
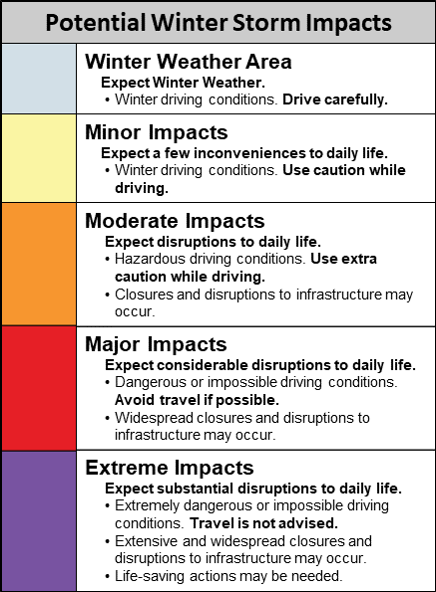
The index has five categories, as shown in the legend below, ranging from the ho-hum “winter weather area” to “extreme impacts” where driving may be impossible and the public is urged not to travel. At this level—a sort of nivean DEFCON 1 but not quite an impending nuclear winter—the storm may disrupt infrastructure, knock out power, and produce life-threatening conditions.
WSSI’s goal is to create easy-to-understand visuals that translate wonky weather forecasts into something that ordinary citizens can quickly grasp.
“Meteorologists may produce an accurate forecast, but the public will not take appropriate action unless there is successful communication between both parties,” WPC says. “Visuals are just as important as verbal communication when conveying hazards, which is where the WSSI product becomes an effective tool for weather personnel.” Here’s a video explaining the basics:
WSSI components
The WSSI maps show impacts over the next 72 hours, and for Day 1, Day 2, and Day 3 of a storm.
The index is based on six equally weighted components:
1) Snow amount: This component depends on both the amount and rate of snowfall while also accounting for local conditions and the social dimension. “Those areas of the country less accustomed to snowfall will be less prepared to deal with snow, resulting in higher levels of impacts than the same amount of snow in a snowier part of the country,” WPC says.
2) Snow load: This forecast is calculated using snow water equivalent, a measure of snow’s liquid content. “This component is significant because the weight of the snow creates a threat to the structural integrity of residential and commercial buildings, as well as tree and powerline damage,” WPC notes.
3) Blowing snow: This component is calculated by combining snowfall, maximum wind gusts, and the snow-to-liquid ratio, a measure of the snow’s density and susceptibility to fly around. Blowing snow, which you’ll typically find in open areas rather than in a dense forest, can wreck visibility and create whiteout conditions. “It takes just under 20 mph of wind to start to move snow around,” according to WPC.
4) Ground blizzard: This component is similar to blowing snow since it highlights places where visibility issues may impact transportation, but the measure is based on winds mobilizing pre-existing snow, rather than flakes falling from the sky. In fact, you can experience a ground blizzard even when the sun is shining. A blizzard, by the way, requires sustained or frequent gusts to at least 35 mph, according to the National Weather Service.
5) Flash freeze: It sounds like a method for producing TV dinners in a factory, but flash freezing is unappetizing because it can create the dreaded black ice, a transparent glaze on a road that can be treacherous since it’s so hard to detect while driving. “Flash freeze occurs when the air temperature starts above freezing, then falls below freezing in a short period of time, and there is remnant moisture/precipitation occurring at the same time,” WPC says. Bridges and overpasses are hot spots for black ice because cold air flows underneath the roadway and lowers its temperature, hence all the warning signs. Bridges and overpasses also are susceptible to black ice because they’re usually made of concrete and steel, which don’t retain heat as well as asphalt.
6) Ice accumulation: This element is based on the forecast for ice and maximum wind gusts. Ice storms can cause “tree damage, transportation shutdowns and utility problems,” according to WPC. To that list, I might add the vast number of people who take a tumble on the ice. At least in Denver, where I used to live, you could theoretically be fined $150 by the city if you didn’t clear your sidewalk in a timely manner.
WSSI versus other forecasts
The WSSI website lets you see the overall threat or check the severity of each of the six components. Although WSSI is a great way to gauge a storm’s punch, the National Weather Service says that it should be used in conjunction with the more familiar watches, advisories, and warnings issued by the agency, adding that WSSI “does not account for conditions that have occurred prior to the creation time.”
Winter storm watches are a heads-up issued “when hazardous winter storm conditions are possible within the next 3 to 4 days, but the timing, intensity, or occurrence may still be uncertain,” according to my local forecast office in Grand Junction.
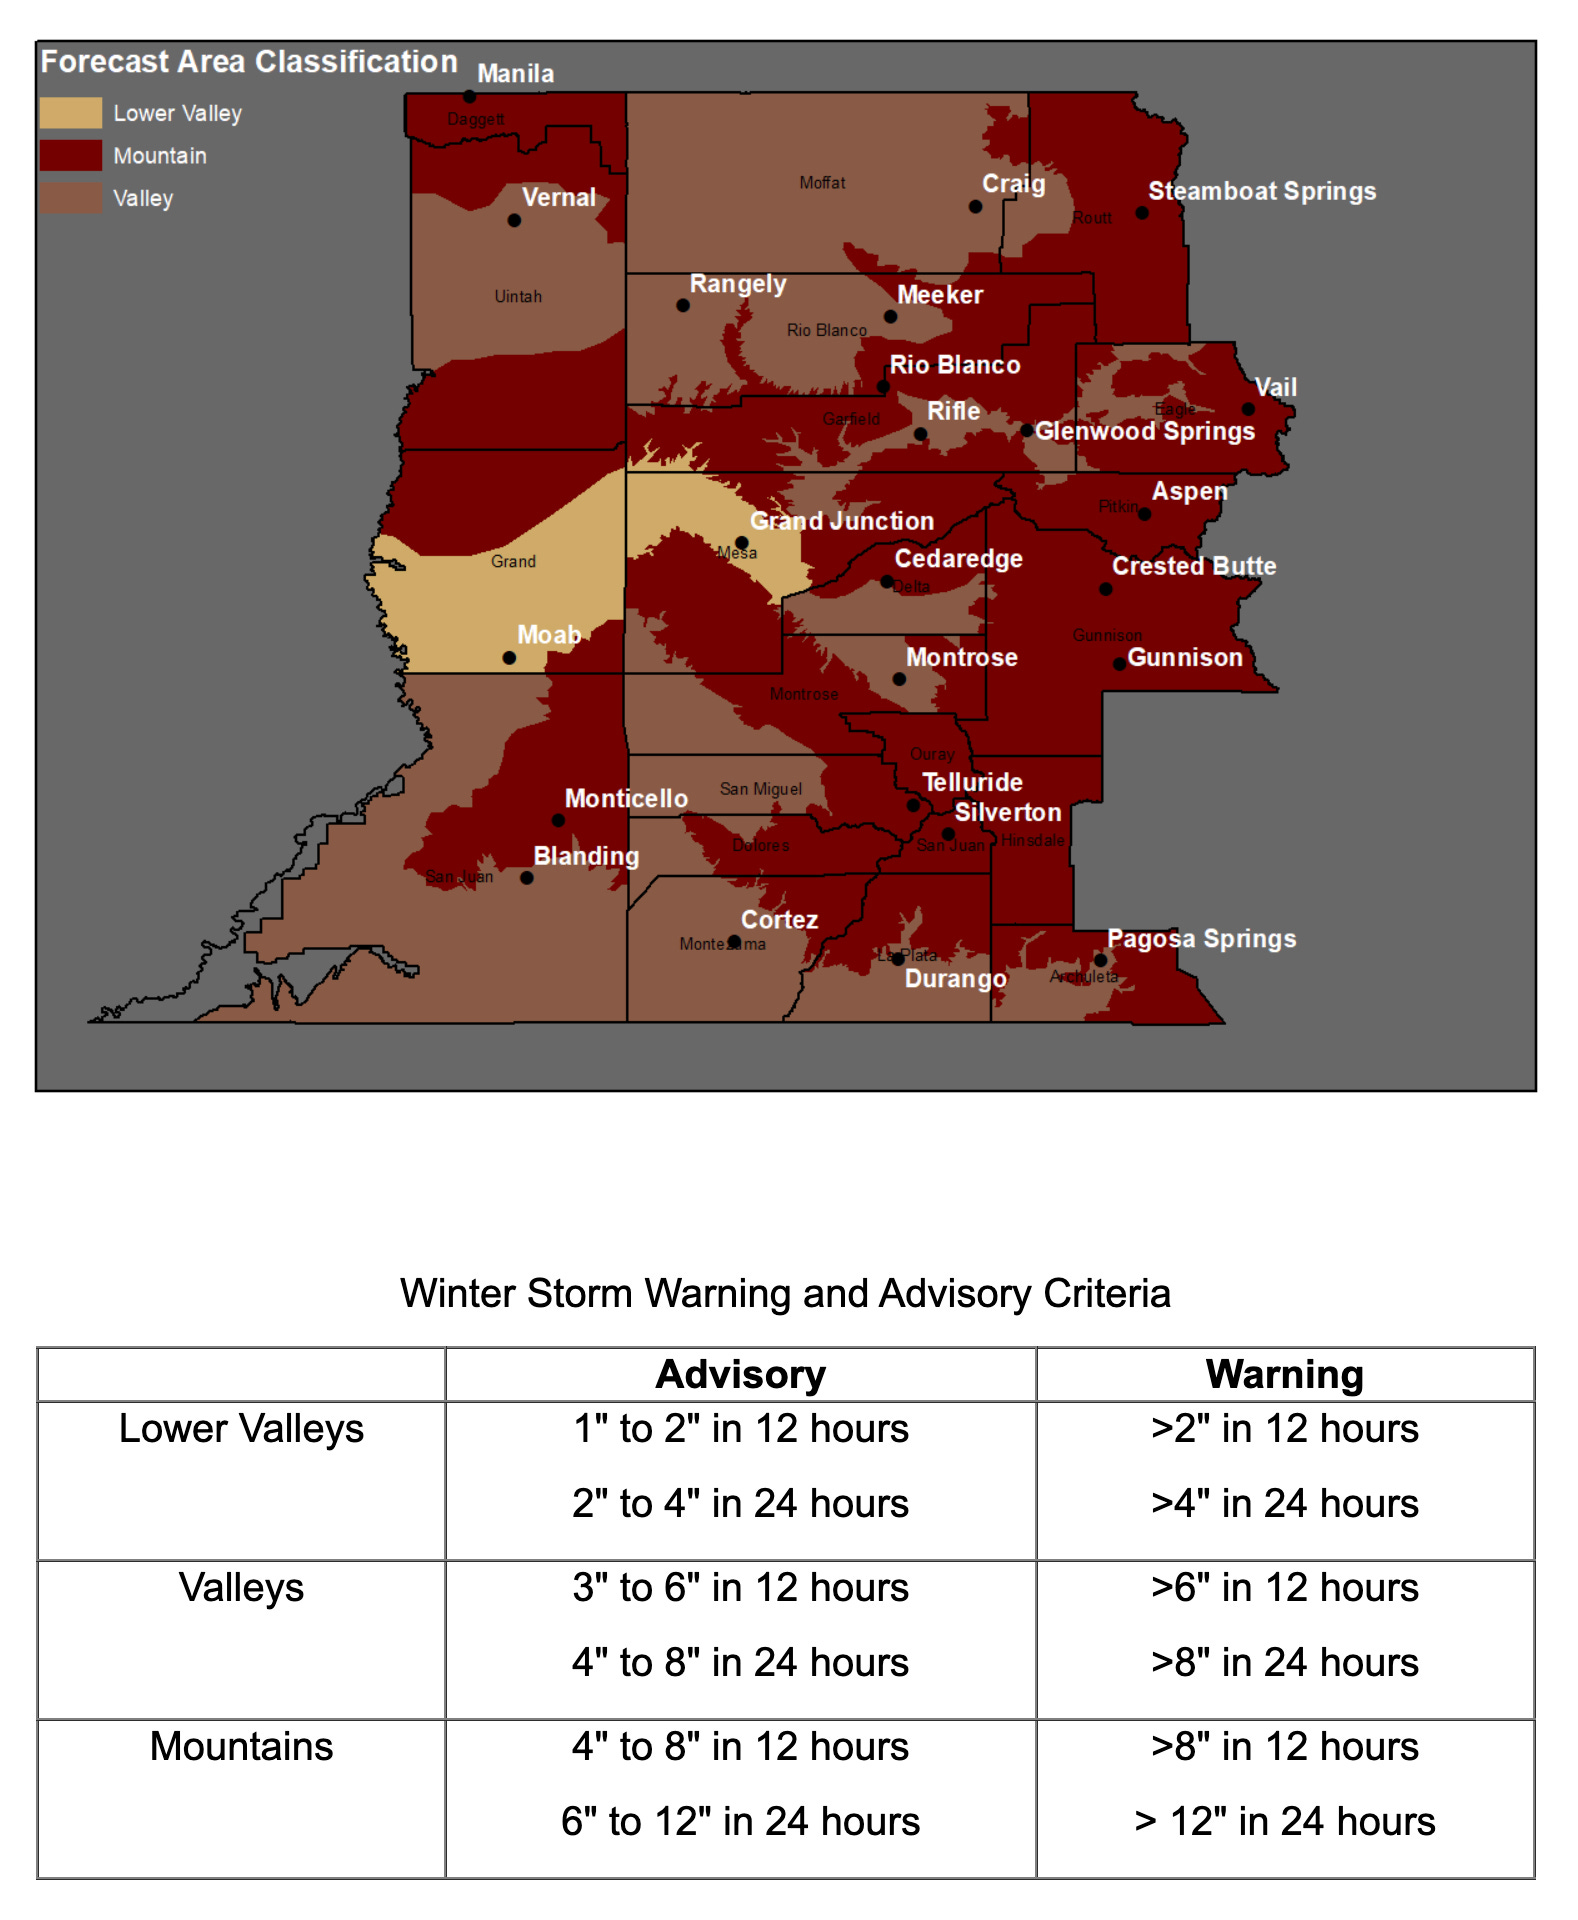
The criteria for issuing winter storm advisories and warnings vary across the nation, and even within a single forecast office’s geographic purview. For example, the Grand Junction office covers Colorado’s Western Slope and Eastern Utah, which ranges from 14ers down to the red rock country of the Colorado Plateau—more than 10,000 feet in elevation difference. Here’s how the Grand Junction office handles winter storm warnings and advisories in different areas:
I’m all about fun in the snow and shredding the gnar, but winter weather can also make for a costly, deadly disaster. Statistically, driving to and from the trailhead or ski resort can be one of the most dangerous parts of the day. WSSI is a useful tool for forecasting a storm’s strength and making risk/reward calculations.
Learn more

Snow News is a free multimedia newsletter that covers the science of snow and the state of the snowpack.
The Water Desk’s mission is to increase the volume, depth and power of journalism connected to Western water issues. We’re an initiative of the Center for Environmental Journalism at the University of Colorado Boulder.


