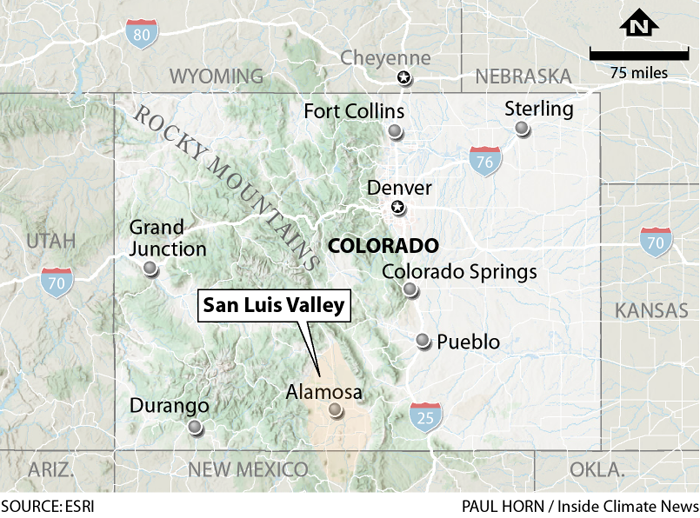
This story was originally published by Aspen Journalism on June 22, 2026.
Some Colorado River experts are floating a concept to address the basin’s water woes that is both radical and mundane: permanently reducing the amount of water used by agriculture.
Many cities have already reduced their water use in recent decades while adding residents, proving that population growth doesn’t have to be tied to an increase in water use. A 2024 study by Colorado River scientists found that agriculture is responsible for about 74% of water used by people in the basin, meaning urban conservation alone cannot solve the crisis.
“I think we need to have permanent reductions in use on the table and agriculture will have to be part of that,” said Anne Castle, a Colorado River expert and a former federal representative to the Upper Colorado River Commission.
Castle was the lead author on a June 1 paper that urgently called on the entire basin to permanently decrease consumptive uses to avoid the worst impacts to reservoirs and water users. Castle and the paper’s other authors are Colorado River experts and academics, and are the brain trust of the basin sometimes referred to as the Traveling Wilburys, a joking reference to the rock music supergroup. But their message is anything but humorous.
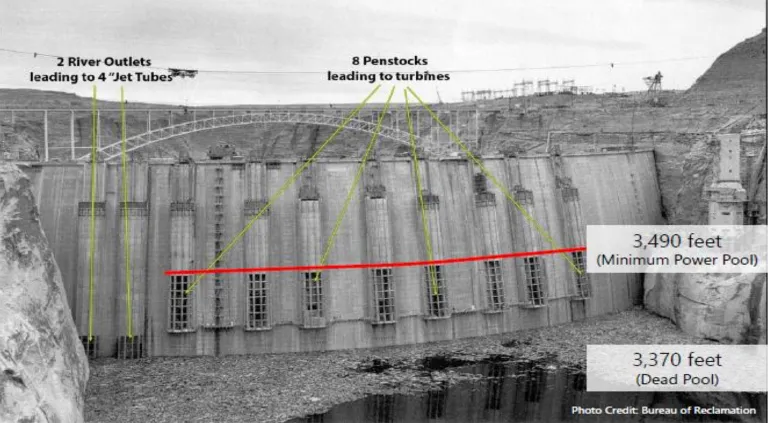
The latest paper says another dry winter would deplete remaining storage and result in devastating consequences like run-of-the-river operations where the nation’s two largest reservoirs can only release downstream the same amount of water that flows into them. It’s the last stop before deadpool, when levels are too low to release water. The authors urge water managers to act immediately to reduce use and avoid a system crash.
But permanently cutting the amount of water that goes to agriculture remains a controversial topic, and water managers from both the Upper and Lower basins say drying up land is not a solution for their basin. Most conservation programs up until now either have been temporary or have allowed the saved water to be used elsewhere. Castle said the problem is especially difficult when people’s livelihoods are on the line.
“The folks who are vulnerable to those kinds of permanent reductions are understandably resistant,” Castle said. “But there’s not enough water. The river won’t allow us to use the same amount of water that we’ve been accustomed to using in the past.”
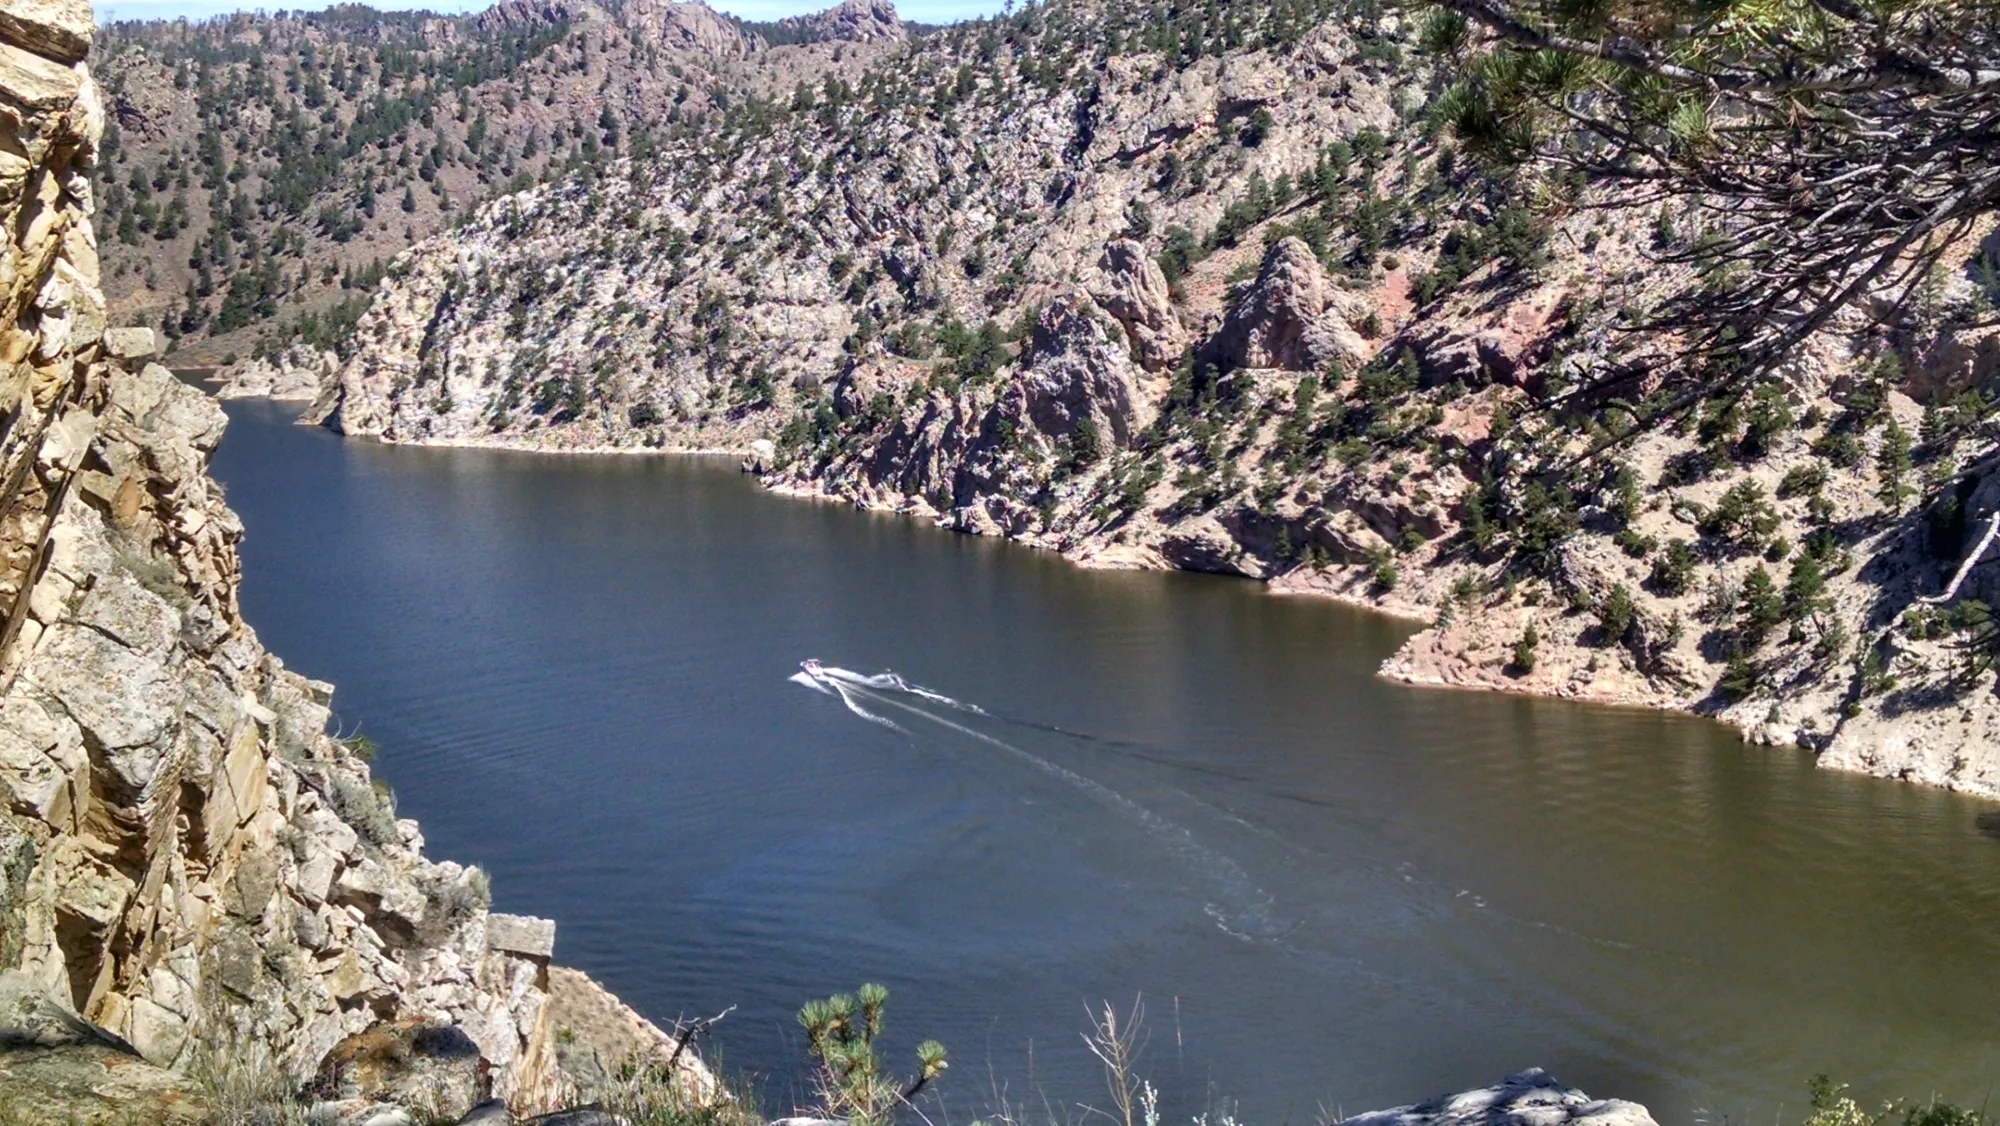
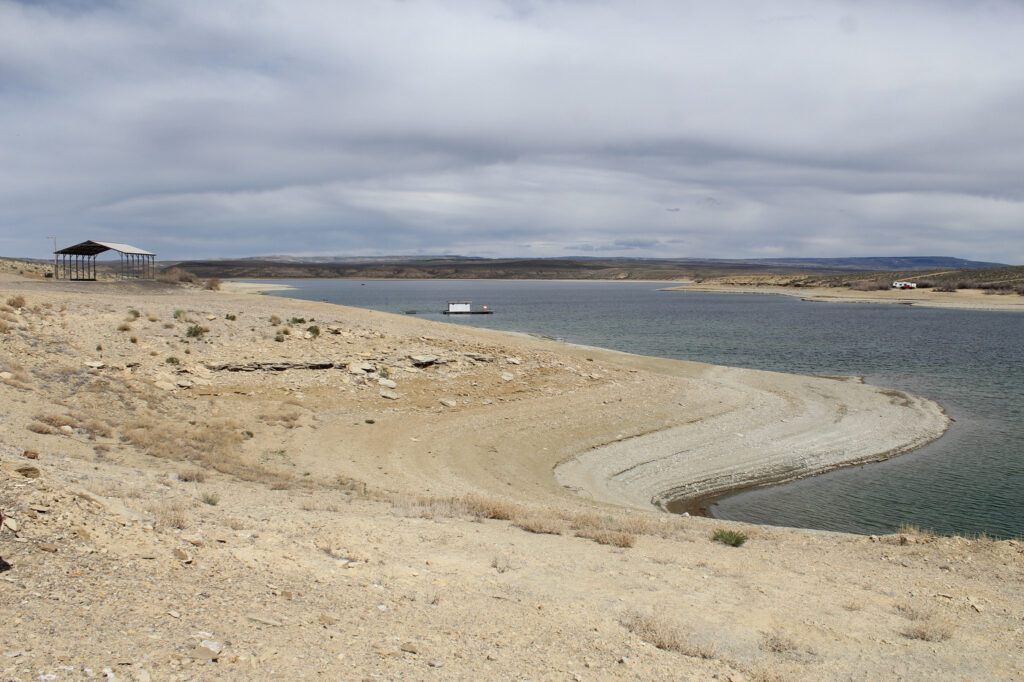
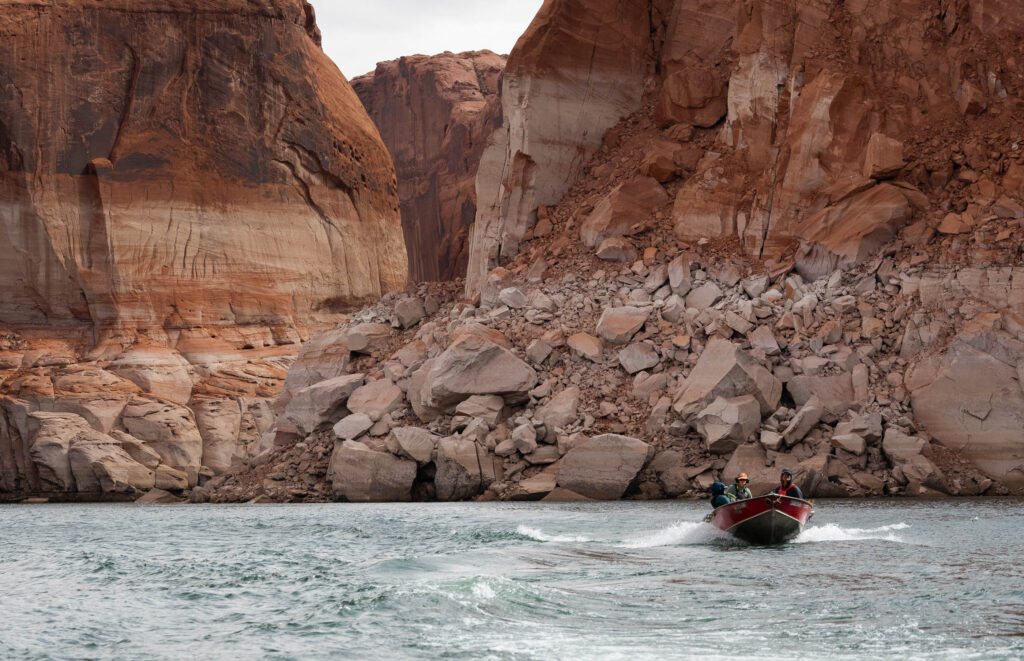
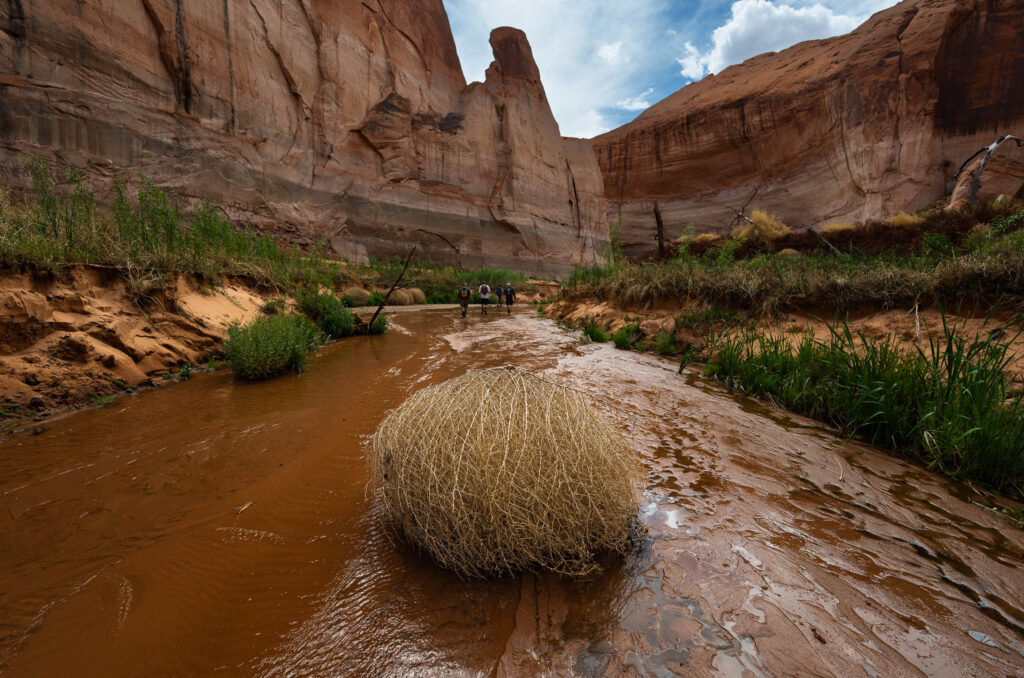
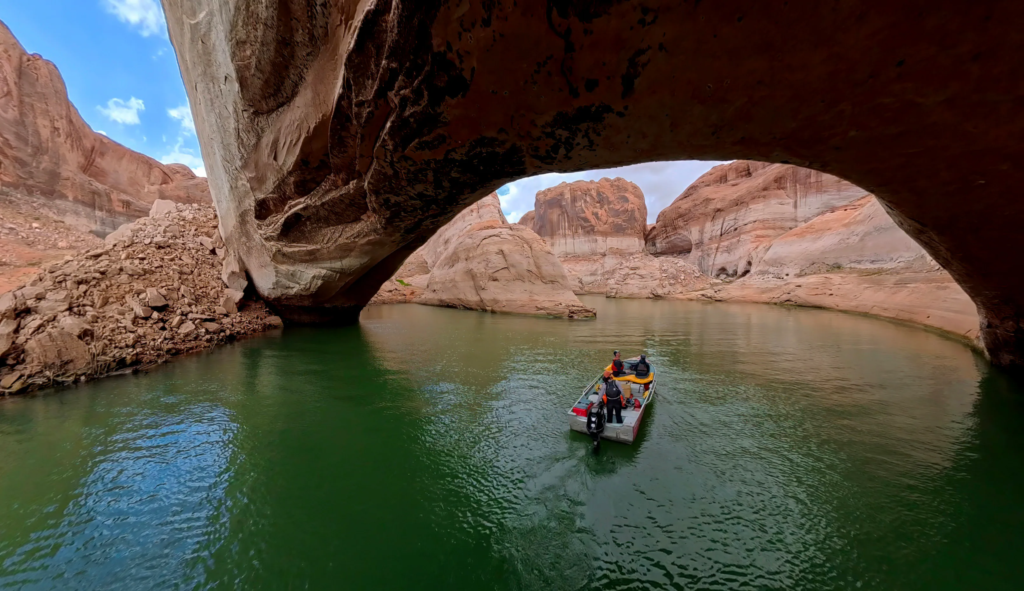
The seven states that share the Colorado River are under increasing pressure to cut water use as one of the worst droughts on record threatens the water supply for millions of people. On the heels of one of the hottest and driest winters since measuring began, spring flows into Lake Powell this year are projected to be the lowest on record.
Much of the $4 billion from the Inflation Reduction Act earmarked for drought mitigation has gone toward short-term conservation. Water users in the Lower Basin states (California, Arizona and Nevada) were paid to temporarily leave water in Lake Mead. And in the Upper Basin (Colorado, New Mexico, Utah and Wyoming), the feds paid irrigators $45 million to leave fields dry during a two-year reboot of a pilot conservation program.
But in the midst of a climate change-fueled megadrought that has already robbed the river of at least 20% of its flows, experts say temporary measures no longer cut it. Water managers are reckoning with the reality that the river will probably never again deliver what was promised a century ago by the Colorado River Compact. The demand for water now far outstrips the dwindling supply.
“Are we going to continue to spend hundreds of millions of dollars a year and not have a permanent solution?” said author and Colorado River expert Eric Kuhn. “I think, at some point, it just makes economic sense to go ahead and say, ‘Let’s buy out the existing demand.’”
Buying out demand
Against this backdrop, some in the academic community are advocating for the federal government to either set up a voluntary program to buy and retire lands that use a lot of water or pay landowners who agree to permanent restrictions on water use.
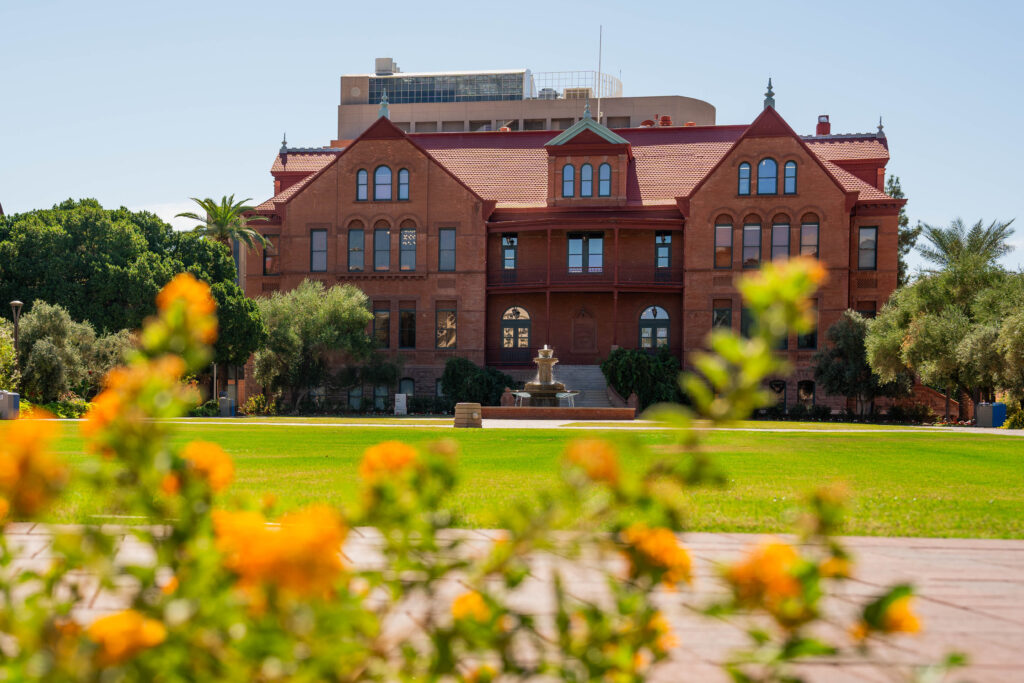
A paper released last year and authored by Kathryn Sorensen and Sarah Porter, who are Colorado River experts at the Kyl Center for Water Policy at Arizona State, lays out how this could be done. Eligible land would have to meet certain characteristics, including being in an area where the economic impacts of not using water are least painful and where impacted crops could be feasibly grown outside of the Colorado River basin, among others.
According to Porter, the federal government should be the entity that buys down demand. The large infrastructure projects funded by the feds in the 20th century are what created booming irrigated agriculture in the West to begin with. And the other entities in the basin that have the ability to buy agricultural water want to use it themselves, not keep it in the system.
“A reset in the Colorado River basin really is needed,” Porter said. “We have a lot of agriculture that’s really a legacy of how the United States was settled… . And now we’re grappling with overallocation and shortage and struggling to figure out a way to manage the Colorado River.”
The proposal is different from the much-derided “buy-and-dry” which usually involves an opportunistic transferring of water from agriculture to cities, not an overall reduction in water use. Still, the potential negative impacts to rural communities have to be considered.
“You have to have a provision for what happens to the land when you remove agriculture and what happens to the local economy when you remove agriculture,” Porter said.
And experts say there is a precedent for the type of federal buyouts that could help the drought-stricken river: the Bankhead-Jones Tenant Farm Act from 1937. This New Deal piece of legislation was a response to the Dust Bowl and allowed the federal government to buy and retire badly eroded or economically unproductive farmland.
The paper says a Colorado River program could start not with those that grow valuable vegetables in winter but, rather, with lands that use a lot of water but have low economic output. The paper says retired agricultural lands could be used for alternative purposes that support local economies such as recreational opportunities or low water-use industries.
Figuring out how to implement conservation programs without harming rural agricultural communities has been a main focus in recent years of the Colorado River Water Conservation District, which works to keep water on the Western Slope. River District General Manager Andy Mueller said that agriculture has a role to play in reducing water consumption, but that permanently retiring agricultural land is a misguided approach that will put the country in danger of not being able to feed itself. Programs should remain temporary, and focus on efficiency improvements and growing less-thirsty crops, he said.
“If it’s temporary, if it’s well-designed in a way that respects local communities, traditions and practices, is custom-built for each community in a way that really tries to do as little economic damage as possible — potentially even bringing some benefits to those farming families that participate — there are ways to do it,” Mueller said.
On the fringe
Although certain academics and experts are talking about permanently drying up agricultural lands as a means of saving water, the concept remains on the fringe of Colorado River politics. It’s both the third rail and the elephant in the room.
“It’s going to pull away from the fringe really quickly when you’ve got to really justify continuing to pay on an annual basis forever,” Kuhn said. “We’re just trying to get the discussion out there, make it acceptable to have the discussion.”
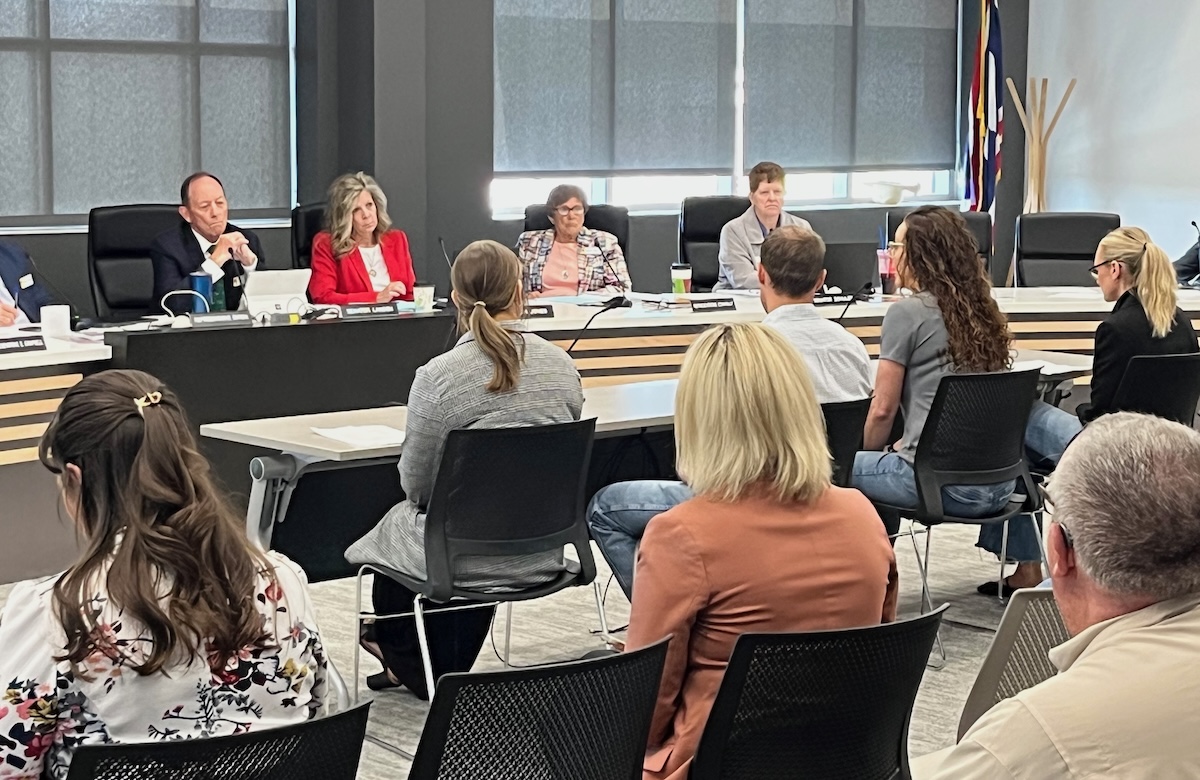
On top of the abysmal hydrologic conditions, the basin is also in the midst of a management crisis. After two years of negotiating, the Upper Basin and Lower Basin states have failed to reach a consensus on how they will share future cuts and have blown past deadlines to come up with a plan. The responsibility for river management now falls to the federal government, which is scheduled to release this summer a short-term operating plan for Lake Powell and Lake Mead.
Part of what makes the problem so tricky is that water managers are still guided by the Colorado River Compact, a century-old agreement that splits the river’s flows evenly between the two basins. Upper Basin water managers still cling to the notion that because their states are already living within the 7.5 million acre-feet of water allotted to them annually, cutbacks are the responsibility of the Lower Basin, which they say uses more than its fair share.
Becky Mitchell, Colorado’s lead negotiator in talks among the seven states, said that permanent dry-up of agriculture in the Upper Basin isn’t necessary because the Upper Basin states already send more than 8 million acre-feet — more than legally required — of water downstream per year. Dry-up may be part of the overall solution, she said, but each state should take its own individual approach to making cuts.
“Those durable reductions are going to be required (for the Lower Basin) to first get in line with their apportionment, but then getting in line with the available supplies is a whole ’nother conversation,” Mitchell said.
California’s representative, JB Hamby, said permanent fallowing doesn’t have a place in reducing the state’s demand either. California is home to the biggest urban and agricultural water districts, as well as the largest allocation of Colorado River water of any of the seven states that share the river.
“In the case of California, there’s no real discussion or interest whatsoever in the retirement of ag lands,” Hamby said. “Land in Southern California that receives Colorado River water is so extremely productive. There is a year-round growing season where every single day of the year there are things being grown.”
Past water savings in Southern California have mostly come from efficiency improvements on farms and in delivery systems, and from deficit irrigation programs in which water is temporarily taken off fields for part of a season. In the absence of a seven-state deal, the Lower Basin states have offered up 700,000 acre-feet of cuts per year through 2028, which is on top of an initial 1.5 million acre-feet in cuts. Most estimates say the basin needs to cut water use by 2 million to 4 million acre-feet.
“There’s full agreement that water should be reduced,” he said. “There’s not agreement in how or where it should be reduced. So the Lower Basin is moving forward, doing our thing, making reductions.”
Ultimately, discussions about permanently reducing the amount of water that goes to farmlands in the basin remain difficult, in part because agricultural water rights are some of the biggest, oldest and most politically powerful in the basin. But there is also an attachment to the American West’s farming and ranching heritage.
“We love agriculture; it’s part of our roots,” Porter said. “We don’t like to think about losing agricultural production. I think we are generally hesitant to have that conversation, and we really haven’t had it as a basin.”