Ice breaks up on the Yampa River as Spring invites warmer temperatures. Should the water that the nearby Hayden and Craig power plants use be allowed to stay in the river once the plants cease to operate, native and endangered fish species in the river would have a higher chance of survival. Photo by Bethany Blitz/Aspen Journalism
By Allen Best
CRAIG — Endangered species of fish in the Yampa River may benefit as coal-fired power stations close in the next 10 to 15 years.
Water demand in the Yampa River valley has been flat, and only modest population growth is expected in coming decades. Unless new industries emerge, the water will probably be allowed to flow downstream.
And that will be of value in recovering populations of fish species.
The Yampa River downstream from Craig has been designated as critical habitat for four species of fish listed for protection under the Endangered Species Act: Colorado pikeminnow, razorback sucker, bonytail and humpback chub.
The Yampa River can fall to very low levels, especially during late summer in drought years, but the water now consumed by power plants at Craig and Hayden could possibly help augment those flows.
The power plants at Craig and Hayden together use about 10% of the water in the Yampa River basin. Municipalities, including Steamboat Springs, Hayden and Craig, use about 10%, and irrigation accounts for 80% of the use, which is common on Western Slope rivers.
Tri-State Generation and Transmission, the dominant owner of the 1,283-megawatt Craig Station, located just outside of Craig and not far from the Yampa River, will close the first unit in 2025 and unit 3 by the end of 2030.
The retirement date for unit 2 isn’t entirely clear. Tri-State has said 2030, but former Colorado Gov. Bill Ritter, who convened stakeholder discussions last year that led to the shutdown plan, told a congressional committee in late February that unit 2 will be closed by 2026. Tri-State spokesman Mark Stutz said the wholesale provider’s partners still need to agree on a retirement date.
Thermoelectric power generation plants in Moffat County, which includes the Craig plants, used 17,500 acre-feet of water in 2008, according to a 2014 study. Routt County used 2,700 acre-feet.
Xcel Energy, the dominant owner of 441-megawatt Hayden Station, will make its plans more clear in early 2021 when it submits its electric resource plan to the Colorado Public Utilities Commission as it is required to do every four years, said Xcel spokeswoman Michelle Aguayo.
Nobody knows for sure yet how the water will be used once those plants close and remediation is completed. But Eric Kuhn, former general manager of the Colorado River Water Conservation District, expects the water will be allowed to flow downstream. He points out that demand in the Yampa Valley has been flat.
“What will happen with that water being used? Probably nothing,” Kuhn said.
And that could help the endangered fish, which are struggling to survive in a river depleted by humans.
“We have a hard time meeting our flow recommendations, particularly in dry years,” said Tom Chart, program director for the Upper Colorado River Endangered Fish Recovery Program.
“As water becomes more available through the closure of those power plants, we could improve performance in meeting our flow recommendations, and that would certainly benefit the aquatic environment and the endangered fish,” he said.
Tri-State, however, has not divulged plans for future use of water from Craig Station. Tri-State spokesman Stutzsays Tri-State will continue to use the associated water during the decommissioning of its power plants and mines.
Steamboat-based water attorney Tom Sharp sees the water from the power plants mattering most in low-water years, such as 2002, 2012 and 2018.
And in the pinch time of August and early fall, Sharp said, the water from the coal plants could make a difference for endangered fish if the water is left in the river or held in storage for release during low-flow times.
Doug Monger, director of the Upper Yampa Water Conservancy District, shows the abandoned meander of the Yampa River that flows through his ranch, Monger Cattle Company, outside of Hayden, Colo. Monger said he isn’t too concerned about Front Range water diversions in the grand scheme of things. Photo by Bethany Blitz/Aspen Journalism
Front Range ‘water grab’?
Diversions by Front Range cities remains a worry by many in Craig, but experts see no cause for fear of a “water grab” by Front Range cities.
“I don’t want to see these water rights sold to the highest bidder on the Front Range,” a woman told the Just Transition workshop in Craig on March 4, provoking sustained applause from many among the more than 200 people in attendance. The state’s Just Transition advisory committee was created by and tasked by the state legislature in House Bill 19-1314 with creating reports, first this July and then December, about how to best assist coal-dependent communities as mines and plants close.
Not to worry, say experts. Geographic barriers between the Yampa Valley and the Front Range that have precluded diversions over the past century remain.
Also, experts point out that rights associated with the power plants are relatively “junior,” in the lexicon of Colorado’s first-in-time, first-in-right doctrine of prior appropriation. The oldest right, from 1967, belongs to the Hayden plant. More valuable by far are water rights that predate the Colorado River Compact of 1922.
“If Front Range entities were inclined to a water grab, they would be looking for something a little more useful, and pre-compact rights are on the ranches,” said John McClow, a water attorney in Gunnison and an alternate commissioner from Colorado on the Upper Colorado River Water Commission.
The compact governs allocations by Colorado and the other six states in the basin, and pre-compact rights will be most valuable in avoiding a compact curtailment, should the Colorado River enter even more extended and deeper drought.
Hayden rancher Doug Monger, a member of the Yampa-White-Green Basin Roundtable and director of the Upper Yampa Water Conservancy District, similarly downplays worries about Front Range diversions.
“I don’t think it will be as much of a threat in the bigger scheme of things,” he said.
Editor’s note: Aspen Journalism is collaborating with the Steamboat Pilot & Today and other Swift Communications newspapers on coverage of rivers in the upper Colorado River basin. This story ran in the April 7 online edition of The Steamboat Pilot & Today and the April 7 edition of Aspen Journalism.
This story was supported by The Water Desk using funding from the Walton Family Foundation.
The Water Desk’s mission is to increase the volume, depth and power of journalism connected to Western water issues. We’re an initiative of the Center for Environmental Journalism at the University of Colorado Boulder. The Water Desk launched in April 2019 with support from the Walton Family Foundation. We maintain a strict editorial firewall between our funders and our journalism.
Aerial view of the snowpack in the Medicine Bow Mountains of Northern Colorado in October 2019. Photo by Mitch Tobin/The Water Desk, with aerial support provided by Lighthawk
Colorado mountain snows, the primary source of the state’s annual water supplies, hit 102 percent of average this week, a bit of good news that hydrologists and forecasters were glad to embrace.
“If folks are looking for something to be grateful for now, a healthy water situation is on the list,” said Peter Goble, climate specialist at Colorado State University’s Colorado Climate Center.
Snowpack is measured across the state’s eight primary river basins. The highest numbers this week were found in the South Platte River Basin, home to such major cities as Denver, Boulder and Fort Collins. Here snowpack measured 112 percent of average.
The lowest readings occurred in southwestern Colorado, where snowpack in the San Miguel/Dolores Basin measured just 93 percent of average, according to the Natural Resource Conservation Service (NRCS) snow survey.
Colorado’s reservoirs are also showing strength, with most projected to fill. Storage levels this month were registering at 107 percent of average statewide.
Thanks to the pandemic, the teams of hydrologists who normally climb high into the mountains to manually measure the snow each month were tied to their desks, observing the stay-at-home order and relying on the state’s remote SNOTEL sites for data. Under normal circumstances, NRCS staff combine remote sensing data and field data to compile the critical monthly snow reports.
But Karl Wetlaufer, who leads the NRCS snow survey effort in Colorado, said his team was able to use additional modeling to help fill in the data gaps this month, and they’re working on a contingency plan for compiling their last major readings May 1.
“The mountain communities were among the hardest hit [by COVID-19], so we discontinued the manual measurements for April 1 to minimize any potential spread,” he said.
While snowpack and reservoirs are strong, forecasts for streamflows, which build as melting snow reaches streams, are expected to be below normal across southwestern and southeastern parts of the state.
Snowmelt that normally would reach the streams in a healthy water year is likely to be captured by soils that have dried out, thanks to ultra-dry weather late last summer and into the fall.
“We’re a bit worried about southeastern Colorado. Dryland farm operators are struggling because it was dry last fall and they had a dry winter,” Goble said, meaning there was little moisture to help crops such as winter wheat, produced without supplemental irrigation, grow.
In the Rio Grande River Basin, where snowpack is registering at 94 percent of average, farmers are hoping they will see more moisture in the spring to compensate for the below-average snowpack and dry soils.
“Streamflows are forecast at 70 percent of normal,” said Cleave Simpson, manager of the Rio Grande Water Conservation District in Alamosa. “It’s still better than 2018, but it’s not great.”
The broader Colorado River Basin, which stretches beyond state lines all the way into Mexico, is also expected to see below-normal streamflows, impacting major regional storage reservoirs, such as Blue Mesa in Colorado and Lake Powell in Utah and Arizona, which are likely to receive just 50 percent to 70 percent of normal inflows, respectively.
As a result, according to the U.S. Bureau of Reclamation, the April-July inflow into Lake Powell is forecast to be just 78 percent of average. This is a critical number because it determines how Lake Powell will be managed this year, including how much water will be released to Arizona, California and Nevada and when.
Looking ahead, Goble said, forecasts indicate a slightly higher chance of drier, rather than wetter, weather from April through June, making it unlikely that those regions which are already beginning to dry out will see much relief.
Thanks to the lingering dry conditions, more than half of Colorado remains in drought, according to the U.S. Drought Monitor, with portions of the southeastern and southwestern parts of the state classified as being in severe drought.
Jerd Smith is editor of Fresh Water News. She can be reached at 720-398-6474, via email at jerd@wateredco.org or @jerd_smith.
Fresh Water News is an independent, non-partisan news initiative of Water Education Colorado. WEco is funded by multiple donors. Our editorial policy and donor list can be viewed at wateredco.org
This story originally appeared on Fresh Water News on April 8, 2020.
The Roaring Fork River (left) joins with the Colorado River in downtown Glenwood Springs. Snowpack in the Roaring Fork basin is slight above normal, but April streamflows are predicted to be just 85% of normal. Heather Sackett/Aspen Journalism
By Heather Sackett
Although snowpack in the mountains near Aspen is hovering above normal for this time of year, streamflows in the Roaring Fork River are predicted to be just 85% of normal for April.
The snow-telemetry, or SNOTEL, site at Independence Pass, near the headwaters of the Roaring Fork River, is at 106% of normal snow-water equivalent. The SNOTEL site at Kiln, near the headwaters of the Fryingpan River, is at 106% of normal. And at Scofield Pass, home to the headwaters of the Crystal River, the SNOTEL site shows snowpack at 90% of normal. The Roaring Fork basin as a whole is at 112% of normal snowpack.
But the April water-supply outlook released by the National Resources Conservation Service predicts streamflows at just 85% of normal at the confluence of the Roaring Fork and Colorado rivers in Glenwood Springs.
“It’s kind of an anomalous year,” said Karl Wetlaufer, a hydrologist with NRCS and assistant supervisor with the Colorado Snow Survey. “More commonly, the streamflow forecasts do pair with the snowpack pretty well.”
The reason for the discrepancy is dry soils, which soak up spring snowmelt before it gets to streams. According to the U.S. Drought Monitor, abnormally dry conditions crept back into Pitkin County in mid-September. By Oct. 22, the western half of the county was in severe drought, while the eastern half was in moderate drought. The western half of Pitkin County is still experiencing either abnormally dry conditions or moderate drought.
“All of late summer was really dry, but before the snow started to accumulate, it was extremely dry,” Wetlaufer said. “The soil can be like a really dry sponge right now and soak up more runoff than usual.”
That lower-than-normal runoff could have impacts on the city of Aspen, which takes its municipal water supply directly from Castle and Maroon creeks. Tyler Christoff, director of Aspen’s utilities department, said city staff is constantly monitoring the variables in the watershed — U.S. Geological Survey gauges, SNOTEL sites, weather forecasts, Drought Monitor — but so far, they are treating this as an average year.
“Being close to average, we are going to let it play out and see if there’s any action we need to take,” Christoff said. “I think regardless of the year and the season, it’s important for our community to be conscious of our use of water as a resource; we do not have an unlimited supply.”
The Colorado River basin typically reaches its peak snowpack for the year in early to mid-April.
NRCS has two main ways of measuring snowpack, which feed into the water-supply forecasts. The first is through SNOTEL sites, which are an automated system of sensors that collect weather and climate data hourly from 115 areas around Colorado, mostly in remote, mountainous watersheds between 9,000 and 11,000 feet. They measure snow depth, water content of the snow, precipitation and air temperature.
The other way is through snow courses, which are manual measurements of snow depth and water content.
But due to the COVID-19 crisis, NRCS staff did not conduct end-of-March manual snow surveys. Wetlaufer said the agency wanted to follow social-distancing guidelines and not have employees traveling in the same vehicle to remote mountain communities.
“We need to go out in pairs for backcountry work,” he said. “We have been talking about options for next month. Some sites that are key, maybe we can still go out and drive two vehicles.”
But streamflow forecasts for the Colorado River basin barely use any snow-course data, Wetlaufer said, so those forecasts should still be accurate without the manually collected data.
“In the Colorado River basin, there’s really pretty minimal impact,” he said.
Aspen Journalism collaborates with The Aspen Times and other Swift Communications newspapers on coverage of water and rivers. This story ran in the April 13 edition of The Aspen Times and the April 13 edition of Aspen Journalism.
Rafters enjoy a day on the Gunnison River near Gunnison, Colo., on May 17, 2020. The Gunnison is flowing at about 80 percent of its normal volume for this time of year. Overall, Colorado’s snowpack is melting faster than usual. Along with lower river flows the presence of COVID-19 is creating challenges for commercial river running companies as well as private boaters. Credit: Dean Krakel/Special to Fresh Water News
With warming temperatures in Colorado’s mountains and spring runoff in full swing, the whitewater boating season should be off to a roaring start.
But Colorado’s stringent COVID-19 travel and recreation restrictions are forcing commercial rafting companies to create social distance on unruly rivers and face the potential for smaller crowds.
“The snowpack’s in good shape,” said John Kreski, rafting coordinator for Colorado Parks and Wildlife’s Arkansas River Headwaters Area. “But the phones aren’t ringing. This is very frustrating.”
Colorado’s highest flows, as of mid-May, are in the northern part of the state, with the Poudre and North Platte at 100 to 120 percent of normal, according to Aldis Strautins, a hydrologist for the National Weather Service in Grand Junction.
The upper Colorado, Gunnison, Green and lower Colorado rivers are all flowing at between 70 to 80 percent of normal, while the Arkansas River, from Buena Vista to the Royal Gorge, is flowing at 80 percent of normal.
Because of an unusually warm and dry April, flows are trending downward in the central and southern mountains.
The South Platte River and Clear Creek are running at 64 to 70 percent of normal, while the Rio Grande and San Juan River are just 45 percent of normal.
Northern Colorado rivers, such as the Poudre, will have enough snowmelt to extend flows for boating into late summer. Elsewhere in the state the best floating will occur from May into early July. “Get down into that 70 to 75 percent and you’re looking at a reduced season,” Strautins said. “There’s just not enough snow to extend it.”
Rafters and surfers enjoy riding a wave on the Gunnison River near Gunnison, Colo., on May 17, 2020. Credit: Dean Krakel/Special to Fresh Water News
Hoping to maximize the early season flows, outfitters are anxiously waiting to see how many visitors will show, according to Bob Hamel, executive director of the Arkansas River Outfitters Association, a trade group.
“Who’s going to travel? Who’s got money? Will we even be traveling or flying to destinations?” he asked.
Still, Hamel is hopeful that the state’s waterways can be opened for commercial use by early June, bringing some much-needed economic activity to the state.
Colorado’s rafting industry is the No. 2 contributor to the state’s recreation economy, behind skiing. Centered on the Colorado, Rio Grande, Arkansas and Platte rivers, it contributed nearly $188 million to the state’s economy, according to a report of the Colorado River Outfitters Association. Visitors spent an average of $135 on a river adventure, including food, lodging, gas and souvenirs.
These numbers don’t include hundreds of homegrown rafters and kayakers who recreate on Colorado’s rivers or the large numbers of boaters from out of state that bring their own gear to the hallmark waterways.
How COVID-19 will impact the industry this summer isn’t clear yet, though major changes are underway.
“Every river floating company will have to adapt their own safety procedures to the kind of trips that they offer,” said Hamel. “A half-day trip down the Taylor River can’t be handled the same as a multi-day trip down the Gunnison Gorge. Some rafts are bigger. Some are smaller. The rafting industry can’t do a one size fits all.”
One set of COVID-19 rafting guidelines developed by Mark Schumacher, owner of Three Rivers Resort in Almont, Colo., includes daily screening of employees, non-touch guest check-in, and hand sanitizer in all office and retail areas.
In addition, directional signs will guide visitors to wherever they need to go, with group size monitored by employees. The number of people on a raft will be reduced to maintain proper social distancing, with spaced seating and open windows on vans and shuttles, disinfection of equipment after each use, and instructions to clients to bring their own water bottles and food.
Andy Neinas, a river running veteran with Echo Canyon Outfitters in Cañon City, said the rafting industry is well-equipped to handle the COVID-19 restrictions.
“All of us are juggling things to make it all work. We’re going to being doing it differently, but nobody does it better than Colorado,” Neinas said.
Dean Krakel is a photographer and writer based in Almont, Colo. He can be reached at dkrakel@gmail.com.
Fresh Water News is an independent, nonpartisan news initiative of Water Education Colorado. WEco is funded by multiple donors. Our editorial policy and donor list can be viewed at wateredco.org.
Rancher and fly fishing guide Paul Bruchez’s daughter and nephew sit in a hay field at the family ranch near Kremmling. Bruchez is helping spearhead a study among local ranchers, which could inform a potential statewide demand management program. Photo credit: Paul Bruchez
The Colorado River begins high in the Rocky Mountains of northern Colorado at Poudre Pass before flowing south and then west into Grand County, through the town of Kremmling, a small ranching community of just over 1,400 people.
It’s a hard place to have a ranch. The soils are sandy, and at over 7,000 feet, the growing season is short. But the real challenge is water. Powerful Front Range water utilities such as Denver Water own many of the senior water rights in Grand County, leaving many ranchers fearful of the day when the city might need the water they rely on to irrigate.
Paul Bruchez, a fifth-generation rancher and fly-fishing guide who raises cattle on 6,000 acres near Kremmling, knows firsthand the hardship caused by water shortages. In 2000, his father sold the family’s original homestead on the Front Range and bought two new ranches in Grand County, hoping for a fresh start away from the rapidly encroaching city. One of the property’s water rights was owned by Denver Water, which had agreed to lease it for 50 years — so long as the city could use the water in times of extreme drought. That time came just two years after Bruchez’s father bought the ranch, in 2002, leaving the family without enough water to irrigate. Forced to fallow half their fields, Bruchez’s family struggled to pay their mortgage.
The crisis prompted Bruchez to get involved in state-level water negotiations so he could help figure out creative solutions to the kind of problem his family faced. In 2015, he became an agriculture representative to the Colorado Basin Roundtable, where the concept of “demand management” began dominating conversations last year. At the heart of a demand-management program is paying irrigators on a voluntary, temporary and compensated basis to leave more water in the river in an effort to bolster levels in Lake Powell and help the state meet its downstream obligations.
Under the Colorado River Compact, Colorado and the three other Upper Basin states (Wyoming, Utah, and New Mexico) must send 7.5 million acre-feet to Lake Powell every year for the three Lower Basin states (California, Arizona and Nevada). Failing to meet those obligations triggers a so-called “compact call,” where junior water rights holders throughout the Upper Basin would see their water cut off — a disastrous situation that water managers are desperate to avoid.
To address that threat, the Colorado Water Conservation Board (CWCB), the agency charged with managing the state’s water resources, voted last year to begin studying the feasibility of a demand-management program. But there was a problem: Although the fields in a potential demand-management program would be at various altitudes, scientists do not have much data on the impacts of reducing irrigation water on higher elevation pastures. Bruchez saw an opportunity to help those efforts by recruiting his ranching neighbors to participate in a study that would help fill the current data gap on fields such as those in the Kremmling area.
“This is our opportunity to participate in the process,” Bruchez told them. Ranchers were receptive, but they had questions. A lot of questions. How, for instance, would they get enough hay to feed their cattle if some of their fields were out of production? How would one rancher’s curtailing of water on his fields affect his neighbors’ fields? How much water savings do you achieve and what happens to the lands themselves? How quickly do they recover?
Bruchez knew that the answers to those questions could be crucial determiners for Colorado’s demand-management investigation.
“If we do this project, it could equally indicate the lack of viability or it could indicate that this is a really great opportunity,” he said. “But at least we’ll be making those decisions based on science rather than emotions or policy without real data.”
Rancher and fly-fishing guide Paul Bruchez raises cattle on 6,000 acres near Kremmling. Bruchez has taken an active role in Colorado River issues ever since his family suffered from a critical water shortage during the 2002 drought. Photo credit: Russ Schnitzer
Demonstration project
Bruchez, 36, is somewhat of a guru for the ranching community in the Colorado water world, participating in numerous river-restoration projects and various water focus groups in addition to his role on the Colorado Basin Roundtable, one of nine groups representing each of Colorado’s main river basins (as well as the Denver area) composed of various stakeholders working to address the state’s water challenges.
In 2012, he helped create a partnership among local ranchers called the Irrigators of the Lands in the Vicinity of Kremmling (ILVK) to secure grant funding for river-restoration initiatives such as stabilizing riverbanks and reviving irrigation channels across a 12-mile stretch of the Colorado River.
Late last fall, Bruchez began discussing the idea of a water-saving study with the ILVK, and by February he had five volunteers (with the potential for two more). Among them, they had 1,200 to 1,500 acres ranging in elevation from 7,300 to 8,300 feet in which to study the ecological and economic impacts of full- and partial-season irrigation curtailment on hayfields.
In March, the CWCB awarded Bruchez’s project a $500,000 grant under its Alternative Agriculture Water Transfer Method program, which supports proposals that offer ways to boost water supplies without relying on traditional “buy and dry” transactions. The remaining funding for the $900,000 project is coming from American Rivers, Trout Unlimited, The Nature Conservancy and private donors.
Some of the ranchers will irrigate their participating fields as normal for half a season — until June 15 — before cutting off their water, while others will not irrigate at all. For the split-season irrigation, ranchers will be compensated at $225 per acre with an additional $56 per acre of risk-mitigation payment (to pay for general upkeep and other unanticipated damages that might result from the lack of irrigation). For full-season curtailment, ranchers will receive $414 per acre with an additional $207 per acre for risk mitigation.
For Bruchez’s neighbors such as Bill and Wendy Thompson, the study is an opportunity not only to help the state potentially avoid a major water crisis but to answer some of their own questions. The Thompsons ranch on 400 acres along the Colorado River a mile south of Kremmling with views of Longs Peak and Gore Range. After Bruchez broached the idea of studying the potential for an irrigation-reduction program on high-altitude pastures, the Thompsons volunteer two of their fields — one for a partial-season curtailment and the other as a “control” field, which they will irrigate as normal.
“We don’t know enough about our own consumptive use on these meadows,” Bill Thompson said. Maybe we’ll discover a new species of grass that’ll actually grow in this sandy soil.”
Conway Farrell, another Kremmling rancher whom Bruchez recruited, hopes the study will help yield the scientific research that water managers can use to create a demand-management program that will help agriculture in the long run.
“Everyone’s been talking about this for years,” Farrell said. “It’s time to finally do something.”
Colorado State University researchers led by Dr. Perry Cabot, a water-resources specialist, will use remote sensing to determine how much water plants consume on the ranchers’ pastures and how much they save by not irrigating on select fields. The researchers will also look at the recovery patterns and risks associated with subjecting pastures to different levels of irrigation curtailment.
Joe Brummer, the forage specialist for the state of Colorado and an associate professor at CSU, has conducted one of the few studies into the effects of partial- and full-season hay fallowing at different elevations in western Colorado. His findings, though limited in scope, are encouraging: While there are short-term losses, the fields recovered after a few seasons to within 10% of full production.
“Plants are resilient,” he said.
This mowed hay field is part of Reeder Creek Ranch, owned by the Bruchez family near Kremmling. Little data exists on the impacts of reducing irrigation water on higher elevation pastures like this one, but Paul Bruchez and a group of local ranchers have volunteered their fields for a study that will help scientists learn more about what happens to pastures that receive less irrigation water. Photo credit: Paul Bruchez
Demand management
As Bruchez ironed out the details of his initiative last winter with ranchers, researchers and the other NGO partners, he had to tread carefully.
Amy Ostdiek, the deputy chief of CWCB’s Interstate, Federal and Water Information Section, emphasized that since the state is still in the initial stages of studying the feasibility of demand management, it’s too early to know how Bruchez’s initiative will play into those efforts. The other three Upper Basin states are in the middle of similar processes as part of the Drought Contingency Planning agreement that all seven Colorado River basin states signed last May.
“We can’t do anything until all Upper Basin states agree that demand management is feasible in their states,” Ostdiek said. “If other states agree that it is, then we get to the hard work of what that program would look like.”
Almost two decades ago, Bruchez’s family overcame their own water crisis by negotiating with Denver Water so that both the utility and Grand County’s agriculture community and environment could get the water they all need. For Bruchez, the experience was a lesson in the value of simple awareness and better management when it comes to solving seemingly intractable water issues.
Speaking from his ranch a couple of weeks ago via Zoom — an online video conferencing app used due to restrictions on in-person meetings because of the COVID-19 crisis — Bruchez felt more than ever the need to be proactive about a future water crisis.
“If people in Phoenix or Denver can’t drink water, what’re we going to do about it?” Bruchez said, adding that it’s no secret that agricultural water rights would be in jeopardy. “Trying to get ahead of this is super important.”
Aspen Journalism is a 501(c)(3) nonprofit organization supported by its donors and funders. This story ran in the April 15 edition of SkyHi News and the April 17 edition of Aspen Journalism.
This story was supported by The Water Desk using funding from the Walton Family Foundation.
A key reservoir for Colorado River storage program, Powell faces demands from stakeholders in upper and lower basins with different water needs as runoff is forecast to decline
Sprawled across a desert expanse along the Utah-Arizona border, Lake Powell’s nearly 100-foot high bathtub ring etched on its sandstone walls belie the challenges of a major Colorado River reservoir at less than half-full. How those challenges play out as demand grows for the river’s water amid a changing climate is fueling simmering questions about Powell’s future.
The reservoir, a central piece of the storage program for the Colorado River, provides water, hydropower and recreation to millions of people. It was designed to ensure that Wyoming, Colorado, Utah and New Mexico can meet their legal obligation to let enough water pass to Arizona, California and Nevada, as well as supplying water to Mexico.
But persistent drought in the Colorado River Basin over the last 20 years and the need to keep Lake Mead, Powell’s twin reservoir downstream, from reaching critically low levels have left Lake Powell consistently about half-full. Some environmental advocacy groups, aiming to restore Glen Canyon, have called for the dam’s decommissioning.
Water managers say that’s unlikely, given Lake Powell’s key role in meeting downstream obligations and the interest of some upstream who hope to tap its waters. Recent studies point to warmer and drier conditions ahead, with reduced runoff into the river. A rewrite of the river’s operating guidelines is on the horizon, and already there is talk about how those guidelines could affect Powell.
Lake Powell and Lake Mead currently adhere to an operations protocol that determines release volumes from Lake Powell to Lake Mead and how Lower Basin water users enjoy the benefits of surplus conditions or the shared sacrifice of delivery cuts during shortage. The rules for these scenarios are found in the 2007 Interim Guidelines, the 2019 Drought Contingency Plans and international agreements with Mexico.
“I think an honest and thorough look into the future of Lake Powell is absolutely warranted.” ~Matt Rice, director of American Rivers Colorado Basin Program
Chief among the Guidelines’ provisions is better coordination of the operations of Lake Powell and Lake Mead each year.
As key stakeholders prepare to forge the next set of management guidelines that will update those from 2007, there may be a reassessment of Lake Powell’s operations so that it can take on the coming challenges.
“I think an honest and thorough look into the future of Lake Powell is absolutely warranted,” said Matt Rice, director of American Rivers Colorado Basin Program.
Rice, part of a February forum on the future of Lake Powell, said the crisis wrought by the coronavirus pandemic shows how rare “black swan” events can emerge and shatter existing management plans, such as those for watersheds.
The dry conditions have prompted Colorado River water agencies to undertake unprecedented, collaborative efforts to ensure water supplies are not disrupted. In Las Vegas, for instance, rebates to homeowners by the Southern Nevada Water Authority have converted 193 million square feet of thirsty grass lawns into water-efficient landscaping.
Staying ahead of future crises is critical, and officials are informally discussing the parameters of the next set of guidelines. How those talks affect future water levels at Lake Powell and Lake Mead will be significant.
A reliable Lake Powell
Conditions on the river are never static. In some years, a large snowpack produces voluminous runoff, but the science is showing a pattern of decreased flow from tributaries into the mainstem Colorado River. Earlier this month, the National Oceanic and Atmospheric Administration’s Colorado Basin River Forecast Center projected inflow to Lake Powell from April to July would be 65 percent of average.
Upper Basin users, meanwhile, want to access their share of Colorado River water to meet growing demands. In Utah, a 140-mile pipeline proposal would divert as much as 86,000 acre-feet annually from Lake Powell to growing communities in the state’s southwest corner. Utah officials believe the $1 billion plan is necessary for places such as St. George that are bumping against their limits of water supply.
Furthermore, Utah officials say the state is well within its right to access water it has rights to.
The Colorado River Compact divided the basin into an upper and lower half, with each having the right to develop and use 7.5 million acre-feet of river water annually. (Source: U.S. Bureau of Reclamation)
“Utah’s right to develop water for the Lake Powell Pipeline is equal to, not inferior to, the rights of all the other 1922 [Colorado River] Compact signatory states,” Eric Millis, then-director of the Utah Division of Water Resources, said in a 2019 statement by the state’s Department of Natural Resources. The Colorado River Compact divided the Basin into an upper and lower half, with each having the right to develop and use 7.5 million acre-feet of river water annually.
Meanwhile, the Navajo Nation is also looking at tapping Lake Powell water via pipeline so it can supplement limited groundwater supplies.
“The continued existence of Glen Canyon Dam is imperative if the Navajo Nation is to obtain a reliable supply of water from the Colorado River,” said Stanley Pollack, an attorney for the tribe. “A water line only works if you have Lake Powell.”
“The continued existence of Glen Canyon Dam is imperative if the Navajo Nation is to obtain a reliable supply of water from the Colorado River.” ~Stanley Pollack, an attorney for the Navajo Nation
In the Upper Basin, there is concern that Lake Powell has been increasingly called on to help Lake Mead, with not much to show for it.
“We are not improving the health of Lake Mead and … until and unless the Lower Basin addresses its overuse … Mead is not going to improve and it’s just going to bring the elevations of Powell down,” said Amy Haas, executive director of the Upper Colorado River Commission.
The storage/release paradigm between the two reservoirs has caused the most tension since adoption of the 2007 Interim Guidelines, said Colby Pellegrino, director of water resources for the Southern Nevada Water Authority.
The Upper Basin recognizes its obligation to let enough river flow pass to the Lower Basin, but occasional machinations with Lake Mead’s storage can be touchy. “Sometimes water is moved from Lake Mead downstream to other reservoirs or water users in a different pattern or timing, prompting concern from people in the Upper Basin that its neighbors seek to game the system,” she said.
Jeff Kightlinger, general manager, Metropolitan Water District of Southern California. (Source: MWDSC)
The largest reservoir in the United States, Lake Mead receives the lion’s share of attention because of the efforts to keep it viable and supplying water to the many farms and urban areas – Las Vegas, Los Angeles and Phoenix, among them – south of Hoover Dam. In 2015, a third, deeper intake was completed at the lake to keep water flowing to Las Vegas’ 2 million residents and 40 million annual visitors. The lake supplies about 25 percent of the water needs of the Metropolitan Water District of Southern California – even more during drought.
Having a reliable Lake Powell to back up Lake Mead is crucial especially during a period of uncertainty, Lower Basin users say.
“As we get into flashier, more volatile hydrology cycles with climate change we can likely see the occasional huge storm years with less snow and more rain,” said Jeff Kightlinger, general manager of Metropolitan Water District, the largest supplier of treated water in the United States. “Having readily available storage capacity for the occasional mega year will be extremely valuable.”
‘The most wonderful lake in the world’
Controversial from the start, Lake Powell remains polarizing to some degree. Former Bureau of Reclamation Commissioner Floyd Dominy, who spearheaded construction of Glen Canyon Dam that created Lake Powell in the early 1960s, said in a 2000 interview that Powell is “the most wonderful lake in the world [and] my crowning jewel.”
At capacity, Lake Powell holds more than 26 million acre-feet of water that originates as snowpack from the Upper Basin. (Source: U.S. Bureau of Reclamation)
Former Reclamation Commissioner Dan Beard, who served in the 1990s during the Clinton administration, opposes the continued existence of Glen Canyon Dam. Because climate change and further reductions in runoff will cause Lake Powell to keep dropping, he said, stakeholders should focus their energy on saving Lake Mead.
“Lake Mead is the heartbeat of the Colorado River,” Beard said. “It is a vital and important part of the delivery system for water to the Lower Basin states and to Mexico. It is a critical facility and yet it continues to decline.”
Beard is a board member with the advocacy group Save the Colorado, which, along with the Center for Biological Diversity and Living Rivers last year sued the federal government to force examination of climate change science in the management of Glen Canyon Dam.
The litigants say Reclamation and the Department of the Interior should conduct a revised analysis and include a full range of alternatives based on predicted climate change-related impacts on the flow of water in the Colorado River.
“Such a full range must include an alternative that incorporates the decommissioning and removal of Glen Canyon Dam because the projections from the best available climate science indicate there likely will not be sufficient flow in the Colorado River to keep Lake Powell and Glen Canyon Dam operational,” a press release accompanying the lawsuit said.
At capacity, Lake Powell holds more than 26 million acre-feet of water that originates as snowpack from the Upper Basin states of Colorado, Utah, Wyoming and New Mexico. That water gets released to Lake Mead via the Grand Canyon and helps supply the Lower Basin — Arizona, Nevada, California – as well as Mexico.
At 710 feet, Glen Canyon Dam is the second highest concrete-arch dam in the United States. (Source: U.S. Bureau of Reclamation)
However, since 2002 Lake Powell’s water elevation has rarely gone above its historical 50-year annual average of 3,639 feet above sea level, the point at which it contains about 15.8 million acre-feet of water. The operating system is flawed, some experts say.
Two years ago, the Colorado River Research Group, a highly respected group of Colorado River scholars including Colorado State University’s Brad Udall and University of Arizona’s Karl Flessa, produced a publication called It’s Hard to Fill a Bathtub When the Drain Is Wide Open: The Case of Lake Powell. In it, they noted that the system is stacked against Lake Powell in part because of an overallocated Colorado River system.
Lake Powell and Lake Mead operate under multiple laws and agreements that are collectively known as the Law of the River. Under the rules, Lake Powell is obligated to release a certain amount of water each year to Lake Mead for the Lower Basin states.
The Lower Basin states, however, collectively draw about 1.2 million acre-feet more water from Lake Mead than Lake Powell releases in a normal year. The result is a so-called “structural deficit.”
Amy Haas, executive director of the Upper Colorado River Commission, is critical of the 2007 operating guidelines. (Source: UCRC)
“The structural deficit is the true villain in this story, mixing with the operational rules to drain Lake Powell,” the Colorado River Research Group publication said. “If storage in Lake Powell cannot rebound in an era where the Upper Basin consumes less than two‐thirds of its legal apportionment, then the crisis is already real.”
Answers, the authors say, lie partly in the ability of Lake Powell storage to recover in wet years, reducing use in the Upper Basin and re-thinking exiting reservoir management. “Lakes Mead and Powell, after all, are essentially one giant reservoir and … thinking of these facilities as two distinct reservoirs, one for the benefit of the Upper Basin and one for the Lower, now seems outdated,” the publication said.
Haas, with the Upper Colorado River Commission, said the existing operating guidelines leave room for improvement. “I feel very strongly that as long as our reservoir operations are coordinated … the future of Lake Powell hinges on the future of Lake Mead,” she said. “We need to find a more equitable mechanism by which reservoir operations are coordinated.”
Marlon Duke, spokesman with the U.S. Bureau of Reclamation, the federal agency that manages the river, acknowledged that Lake Powell draws scrutiny.
“I often get asked, ‘What’s the deal with Lake Powell?’” he said. “Shouldn’t we just drain it or is it really doing what it is supposed to do?”
The answer, Duke said, means looking at the lake’s performance and how it has met expectations during difficult times. Powell was near capacity in 2000. Then a period of record-setting dryness set in. Through it all, enough water was released to meet the Upper Basin’s obligation to the Lower Basin.
People in the respective basins view Lake Powell and Lake Mead with a certain degree of ownership, and perspectives vary. Upper Basin interests generally want a more robust Lake Powell. South of the lake, the desire to tap into it further is not uncommon in the Lower Basin. The degree of change, ultimately, will likely fall between those sentiments.
Jack Schmidt, with Utah State University, analyzed the concept of “Fill Mead First.” (Source: Jack Schmidt)
All of that notwithstanding, it’s important to understand the two reservoirs are tightly woven, said Jack Schmidt, the Janet Quinney Lawson chair of Colorado River studies at Utah State University.
“It’s one big system and whether Powell [or Mead] goes up or down …those are intentional societal decisions of management that have little to do with climate change,” he said.
“Powell, even less full going forward, remains a valuable piece of very expensive infrastructure that will remain part of the Colorado River storage pool for decades to come.” ~Jeff Kightlinger, general manager of Metropolitan Water District
Schmidt in 2016 analyzed the concept of “Fill Mead First,” the idea of establishing Lake Mead as the primary water storage facility on the mainstem river and relegating Lake Powell to a secondary storage role when Mead is full. The savings in evaporation and seepage losses would be relatively small, Schmidt said, but the idea shouldn’t be completely discounted.
Fill Mead First “generates passions and emotions,” Schmidt said. It is embraced by some as a restorative opportunity for Glen Canyon. “Then there is the world of traditional water managers who say that’s a ludicrous idea and we don’t pay any attention.”
The disparate views “live in two worlds completely.”
But Kightlinger, with Metropolitan Water District, discounts the idea of draining Powell. “Politically, I don’t see any real support or push for a fill Mead first strategy,” he said. “Powell, even less full going forward, remains a valuable piece of very expensive infrastructure that will remain part of the Colorado River storage pool for decades to come.”
A warmer and drier basin
A small army of water professionals and experts constantly analyze the Colorado River Basin, which supplies water to 40 million people and fuels a huge agricultural economy.
For years, scientists have looked at the drying conditions of the Colorado River Basin, employing techniques such as tree ring sampling. Analysis of that method has shown that the years 1905 to 1922 – just as the river’s waters were being allocated among the states — were exceptionally wet.
In 2012, Reclamation’s Colorado River Basin Water Supply and Demand Study confirmed there are likely to be significant shortfalls in coming decades between projected water supplies and demands in the Colorado River Basin. Since the study, a steady stream of research points to warmer and drier conditions.
Pearce Ferry Rapid prevents predators such as catfish, bass and pike from getting upriver and destroying native fish. (Source: Cory Nielson, Arizona Game and Fish Department)
In April, a study published in the journal Science said the current dry period in the Southwest is one for the record books, and that its “megadrought-like trajectory” is fueled by natural variability superimposed on human-caused warming. Also in April, experts with the Western Water Assessment, whose researchers work out of the University of Colorado, Boulder and several other institutions in the region, noted that the severity and length of drought conditions can be difficult to quantify.
“This is especially true for the Colorado River system, in which total consumptive use plus other depletions typically exceeds supply, such that under even average hydrologic conditions the levels of Lake Mead and Lake Powell will tend to decline,” according to Colorado River Basin Climate and Hydrology: State of the Science, the study conducted by the Western Water Assessment.
The continued variability justifies a robust Lake Powell, said Haas, with the Upper Colorado River Commission.
“We know that future flows are going to be more variable and almost clearly lower, but we also need to ensure that our non-depletion obligation is satisfied,” she said. “Powell is our repository for this water. Doing away with the reservoir, in light of our 1922 Compact obligation, is not realistic,” she said.
Furthermore, an improved, more accurate forecasting approach is needed ahead of the next set of operating criteria. “That’s especially true given the vicissitudes of hydrology and the impacts of climate change,” Haas said.
Increasing Lake Powell’s releases is potentially problematic because of the likelihood that predator fish from Lake Mead could make it upstream and devastate native fish in the Grand Canyon.
Matt Rice, director of American Rivers’ Colorado Basin Program, believes an honest evaluation of the future of Lake Powell is needed. (Source: Matt Rice)
As it stands, Pearce Ferry Rapid, a rugged, impassable cataract located near the downstream end of the Grand Canyon, prevents predators such as catfish, bass and pike from getting upriver and destroying native fish. The rapid exists because Lake Mead, sitting at just 43 percent of capacity, is so low that the inflow to it from the river has carved a new entry where the river plunges over a bedrock ledge.
If Lake Mead ever began to fill again, it would inundate Pearce Ferry Rapid, allowing the non-native fish to migrate upstream and prey on native Colorado River fish. “They would just eat and eat,” said Rice, with American Rivers. “All the recovery of endangered fish could be for naught.”
Playing the waiting game
During a period of great uncertainty about what the next water year will bring, Colorado River water users will need to think creatively while using all their tools, including storage.
“Glen Canyon Dam exists because you need all that potential storage,” said Schmidt, with Utah State University. “In some freak years you are going to get really big runoff, and nobody wants to see that go through the system.”
Meanwhile, the lake’s future role in the Colorado River Basin is a key topic as Reclamation reviews the performance of the 2007 Guidelines, with results expected at the end of this year at the annual meeting of Colorado River water users.
Colby Pellegrino, director of water resources for the Southern Nevada Water Authority. (Source: SNWA)
Pellegrino with Southern Nevada Water Authority said it would be nice to get past the controversy about Lake Powell’s releases and instead find ways to store more water in it. “We have had a lot of consternation … more because of the balancing releases than the actual behavior of any water user or basin,” she said. “Going back to something that’s more constant or more fixed would remove an element of consternation between the Basins.”
What’s likely to happen is an approach that builds upon the years of collaboration and cooperation established between everyone working on Colorado River water management, said Tina Shields, water manager with the Imperial Irrigation District, the largest user of Colorado River water.
“We know how the river works – its incrementalism,” she said. “Nobody wants to make wholesale changes because it’s too big of a deal and what if it went south? We are not quick to change these relationships and negotiations. They took a lot of time.”
Chris Harris, executive director of the Colorado River Board of California, said Reclamation’s findings will be key in considering the continued conjunctive management of Lake Powell and Lake Mead.
“There are 40 million people who rely on water from this river and over the last 20 years, we would not have been able to supply that water reliably without these storage reservoirs.” ~Marlon Duke, Bureau of Reclamation
“Certainly, the [2007] Guidelines have shown that managing the reservoirs together has kept Lake Powell from crashing and has kept Lake Mead from a shortage condition,” he said. “I believe that there will be significant interest in evaluating opportunities, including with Mexico, for even more effective management of the reservoir system.”
That process will most likely look at different elevations and trigger points for excess releases from Lake Powell in a manner that’s acceptable to the Upper and Lower Basins.
“The question is, how do you get movement either way without someone saying, ‘That doesn’t work for me,’” Shields said. “Sometimes the status quo is easier to continue than the fear associated with changing those trigger points.”
As with virtually all Colorado River issues, the ramifications of actions can run far and wide. “This sounds like an esoteric argument about something hundreds of miles away, but the reality of it is what happens at Lake Powell affects the amount of water available to the Lower Basin states, Southern California and, indirectly, Northern California,” said Beard, the former Reclamation commissioner.
California’s extensive water plumbing network relies on a careful balance of imports to Southern California from Northern California and the Colorado River.
Even with Reclamation’s review of the guidelines expected to be issued at the end of the year, Schmidt with Utah State University said he believes stakeholders will let multiple years pass before committing to any radical operational changes.
Solutions to Colorado River management are built on the legacy of collaboration and cooperation, said Tina Shields, water manager with Imperial Irrigation District. (Source: IID)
“Every year that we wait buys a little more information about climate change and decreasing runoff and whether we go into a wet cycle,” he said. “There’s a lot of things that could happen and people will hope that nature provides a favorable condition so there can be a tiny bit more wiggle room and we don’t go into dire crisis.”
Haas echoed the comments of many stakeholders in noting that all options for Powell’s operation should be considered. “It’s not heretical to be thinking outside the norm on things,” she said. “It spurs a more robust discussion and we should not shy away from that.”
Reclamation’s Duke harkens back to Powell’s ability to consistently meet and sometimes exceed its release obligations during severe conditions.
“That is a testament to the people who came before and had to make those tough calls,” he said. “They built that reservoir and it’s done what we needed. Looking into the future, everything’s on the table, but we also need to remember there are 40 million people who rely on water from this river and over the last 20 years, we would not have been able to supply that water reliably without these storage reservoirs.”
In 2002, Utah was reeling from four years of dry conditions that turned the state “into a parched tinderbox,’’ as the Associated Press reported at the time. “Drought Could Last Another 1-2 years,” the headline proclaimed. Right on time, in 2004, the Salt Lake Tribune ran a similar article, on “Coming To Terms with Utah’s Six-Year Drought,” that was “believed to be the worst to strike the Southwest in half a millennium.”
Almost two decades later, the drought has raged on. In October 2019, the water supplier for St. George, a rapidly growing resort and retirement community in southwest Utah, released a statement declaring the city’s longest-ever dry spell: 122 days without rain.
A study published last month in the journal Science identified an emerging “megadrought” across all or parts of 11 western states and part of northern Mexico—a drought likely, with the influence of climate change, to be more severe and long-lasting than any since the 1500s. The area includes Utah, Nevada, Arizona, California and portions of Oregon, Idaho, Montana, Wyoming, Colorado, New Mexico and Texas.
This region is also experiencing explosive population growth—with Idaho, Nevada, Arizona and Utah topping the list of states with the highest percentage increase in residents from 2018 to 2019, according to the U.S. Census Bureau. For decades, these states and their mushrooming municipalities have been grappling with the twin concerns of rapid growth and dwindling water supply projections. Now, in the midst of an historic megadrought predicted to last many more years, the issue has grown increasingly urgent.
For the megadrought study, scientists analyzed tree rings from nearly 1,600 trees that had grown across the region over hundreds of years, says the study’s lead author, A. Park Williams, an associate research professor at Columbia University’s Lamont-Doherty Earth Observatory. Examining the rings under a microscope, the researchers could see when growth was slow, indicating time periods when the region was especially dry.
The authors identified megadroughts—droughts more severe and much longer than anything observed in the written record, says Williams—over the last 1200 years. The most recent was in the late 1500s, until now. Today’s megadrought has been marked by more frequent and severe wildfires, a decline in groundwater, lake and river levels and a reduced snowpack.
And climate change, added Williams, is “making it easier to go into a megadrought without the ocean and atmosphere needing to team up in as extreme of a way” as they did to create such conditions in the past.
In Utah, the situation might be considered dire.
“Our population is one of the fastest-growing in the country and we’re also one of the driest states in the country and our water supply in large part is mountain snow,” said Michelle Baker, an aquatic hydrologist at Utah State University who was project director for iUtah, a years-long research effort to transition the state to sustainable water usage.
With the mountain snowpack dwindling due to climate change, iUtah researchers identified several ways to help close the supply gap, said Baker. One included storing more water underground than in reservoirs to limit the amount of water lost to evaporation. Another involved replacing Utah’s old-fashioned dirt-lined irrigation canals with pipes to curb evaporation and seepage.
In March, Utah adopted a law creating a new water banking program, similar to those in other states, that will allow water rights holders to “bank” their unused water rights and lease them temporarily to others without selling them outright.
This might help a place like St. George, the fifth-fastest growing metro area in the U.S., according to the Census bureau. Since 1980, its population has grown nearly seven-fold from 26,000 people to nearly 178,000.
“We’re projecting it to reach about a half a million people in the next 50 years,” said Pam Perlich, the senior demographer at the Kem C. Gardner Institute at the University of Utah. She warned of the city’s particular vulnerability to water shortages, even compared to other parts of Utah. “It’s got a different climate. It’s very arid, it’s consistently 20 degrees warmer.”
St. George currently uses 33,000 acre-feet of water per year, Karry Rathje, a spokesperson for the Washington County Water Conservancy District, told FairWarning in an email. (An acre-foot is enough water to cover an acre of land with one foot of water, and is roughly enough to supply three homes for a year.)
Crop irrigation in Yuma, Arizona. (Jeff Vanuga/U.S. Department of Agriculture)
Washington County, which includes St. George, “is projected to need an additional 86,000 acre feet of water to meet the demands of a population that’s projected to nearly triple by 2060,” Rathje said.
This is to say nothing of exponential growth in greater Salt Lake City, which by 2060 could swell to the size of the Seattle metropolitan area of 3.7 million residents, according to one estimate.
Battles over water have long plagued the West. For St. George, a proposed pipeline from Lake Powell on the Colorado River is a contentious issue, with city water officials saying it’s necessary to meet the growing demand and environmental advocates claiming that it would be damaging, costly and unsustainable over the long run. The Colorado, the primary water source for seven western states, is overallocated, meaning there is not enough water to meet the volume promised to all rights holders. In the spring of 2019, representatives of these states completed a drought contingency plan, each agreeing to take less water.
Nowhere is the collision between water scarcity and population growth more evident than in Buckeye, Arizona, a Phoenix suburb that was the fastest-growing large city in the country from 2017 to 2018.
Right now, it is home to about 74,000 people, but it has enough land area to eventually be bigger than Phoenix.
Buckeye uses 11,800 acre-feet of water per year, said the city’s hydrologist Ron Whitler. But based on estimates of population growth, the city council anticipates that it will need 200,000 acre-feet annually.
“We have adequate water supply for the next 20 years, for the current population and growth,” said Alisha Solano, director of the Buckeye Water Resources Department. But, she added, “We’re absolutely concerned about conserving water.”
About 70 percent of water used in Buckeye is for outdoor landscaping, while 30 percent is for indoor use, said Whitler—a common ratio in arid regions.
The water department is trying to educate residents on growing desert-hearty flora, said Whitler, and has goals to scrap “turf that is just for appearances” throughout the city.
Buckeye has a small allocation from the Colorado River, Whitler said, but mostly draws on groundwater. Yet the reliance on groundwater in fast-growing parts of Arizona comes with its own tangled knot of water shortage issues tied to rapid development.
Arizona has long required developers to demonstrate a 100-year water supply in order to carry out their projects. But a legislative workaround in 1993 has allowed them to source less-renewable groundwater for their century supply, as long as they enroll in their regional groundwater replenishment district. The idea is that groundwater mined in a replenishment district is eventually replaced by another water source somewhere within the district.
“Now there is a real question about where the water core replenishment would come from given that we are facing reductions in the Colorado River supply” and other water sources, said Sarah Porter, director of the Kyl Center for Water Policy at Arizona State University.
In Buckeye, as in St. George, there is no formal plan to limit new development. But some officials have ideas for the way things might evolve.
“Not all developments necessarily have to look alike,” said Sharon Megdal, a board member of the Central Arizona Project, which manages and distributes the state’s Colorado River supply. “We’ve gone down the road in this country for a long time of spreading out, large lots, always thinking that larger is better.”
Meanwhile, agriculture is being considered as a potential source for freeing up more water. In Arizona, agriculture consumed 74 percent of the water supply in 2017.
“I think the concern is mostly that in order to supply a growing population the water rights probably will need to be transferred from agricultural to urban usage,” said Baker of Utah State University.
For example, the Metropolitan Water District, which supplies water utilities throughout Southern California, has arrangements with agricultural water districts in California and Arizona. The deals often involve paying farmers to fallow their fields at times to meet increased urban needs.
But Porter warns there is danger in depleting too many of the agricultural sector’s now-plentiful water rights.
“If you got rid of [agricultural water use] and instead you built out all of that urban demand,” she said, “then when a shortage came, you would really be hurting.”
This story was produced by FairWarning (www.fairwarning.org), a nonprofit news organization based in Southern California that focuses on public health, consumer, labor and environmental issues.
The South Platte River near Evans. A new study indicates that a proposal to create a regional water system on the South Platte River is feasible. Credit: Jerd Smith
As COVID-19 continues to roil Colorado and the world, experts are suggesting that the pandemic may teach all of us to work together better. If that’s the case, then a collaborative water system for the Front Range may be a harbinger of things to come, according to a new study.
Released March 10, just days after Colorado reported its first cases of COVID-19, the study indicates that if Front Range cities band together to build a large-scale water reuse and delivery system, water sufficient to serve 100,000 homes could be developed.
It would rely on moving water between cities and farms, building new pipelines, as well as storing water underground and in off-channel reservoirs, and could be done without tapping new sources on the West Slope.
Such a project, if built, would cost $3.2 billion to $4.4 billion, according to the study, a price that is in line with other water delivery systems now being developed.
That cost includes 50 years of operations and maintenance and assumes the water would likely need to be heavily treated.
The study comes as the Front Range faces the most acute water shortages in the state, with a gap between water supply and demand for municipal and industrial users of as much as 540,000 acre-feet projected by 2050, according to a recent analysis by the state. Farmers could face a gap nearly twice that large, particularly in dry years.
Lisa Darling, executive director of the South Metro Water Supply Authority, helped oversee the study. She said once Colorado recovers from COVID-19, she hopes communities will be able to use it as a roadmap toward future water supplies. (Editor’s note: Darling is president of Water Education Colorado, the nonpartisan nonprofit that sponsors Fresh Water News.)
“It shows that it’s feasible, and it will allow people to see exactly what it might look like,” she said.
The South Platte Regional Opportunities Water Group (SPROWG), a group that includes dozens of Front Range water districts, sponsored the work. The study analyzed different alternatives for capturing water in the South Platte River as it approaches the Nebraska border, an area where flows are typically more abundant than they are closer to metro Denver, where the river is heavily used and its waters largely claimed by existing users.
Because the river’s supplies in average years are already spoken for, any new water would be developed by capturing some during flood years and, in other years, reusing water already diverted from other basins via new water treatment plants and pipelines, making that water supply go farther.
Funded by the Colorado Water Conservation Board (CWCB) and several cities, including Denver and Aurora, the study was geared to help taxpayers from metro Denver to Brighton to Greeley and beyond determine whether they want such a project, how it would be configured, and who would benefit and shoulder the cost.
The South Platte Regional Opportunities Water Group proposal could serve cities from Denver to Greeley and beyond.
The South Platte Regional Opportunities Water Group proposal could serve cities from Denver to Greeley and beyond.
“The price tag sounds like a lot, but it is comparable to other projects in the South Platte Basin,” said Mary Presecan, a consultant with Leonard Rice Engineers and one of the study’s authors.
Water sold through the Loveland-based Colorado-Big Thompson Project is selling for $78,000 to $92,000 an acre-foot, Presecan said, while the SPROWG study analysis shows water developed through this new partnership would cost from $44,000 to $58,000 an acre-foot. An acre-foot equals nearly 326,000 gallons, enough water to serve on average two urban homes for one year.
In addition to water for fast-growing small communities, the study examined providing water to farmers on the Eastern Plains. These farmers control some of the oldest, most senior water rights in the region, but the water is increasingly being sold to thirsty cities, threatening local economies and the livelihoods of farmers left behind, and ultimately reducing the state’s ability to grow food.
A collaborative reuse project could provide additional water to water-short farms, as much as 35,000 acre-feet a year, allowing them to maintain their agricultural production.
“If there is an opportunity to be part of a regional partnership and address the ag gaps, we are all for it,” said Joe Frank, general manager of the Lower South Platte Water Conservancy District, a sponsor of the study.
“SPROWG is a concept where we are starting at a high level and drilling down. Can we bring the whole [South Platte River] Basin together to figure out if this can work,” Frank said.
Early on, the study drew fire from West Slope interests and environmental groups, who feared it would inevitably lead to bigger efforts to tap the drought-stressed Colorado River and could harm the South Platte River.
But feedback from dozens of meetings with citizens, environmentalists, taxpayers and water officials during the past year led the study’s authors to conclude that the project can be structured in such a way to provide environmental benefits, as well as water for cities and farms.
“This is a collaborative way, and an innovative way to conjunctively manage and use a variety of water sources for multiple beneficiaries,” said Matt Lindburg, a consultant with Brown and Caldwell and one of the study’s authors.
State water officials, such as Gail Schwartz, who represents the Colorado River Basin on the Colorado Water Conservation Board, said she believed the regional, collaborative premise underlying the early work could be utilized elsewhere.
“It’s a great model for collaborative thinking,” she said, at the CWCB’s March board meeting in Lakewood. “I think it could work for other parts of the state too.”
Whether the pandemic will bench the work on this new South Platte water delivery planning isn’t clear yet.
But Frank is optimistic work will continue. “The pandemic could slow us down, but it definitely won’t stop us. Now the next step will be determining [which communities] are really serious about coming together and taking this to the next level,” he said.
Jerd Smith is editor of Fresh Water News. She can be reached at 720-398-6474, via email at jerd@wateredco.org or @jerd_smith.
Fresh Water News is an independent, nonpartisan news initiative of Water Education Colorado. WEco is funded by multiple donors. Our editorial policy and donor list can be viewed at wateredco.org.
This story originally appeared on Fresh Water News on April 1, 2020.
Streets are empty in Central City, with casinos shuttered and hundreds of workers laid off. The pandemic is bad news for the state’s new sports-betting tax, which was to have helped fund the Colorado Water Plan. April 21, 2020. Credit: Jerd Smith
It’s hard to generate money from a sports-betting tax when COVID-19 has wiped all athletes worldwide from the fields, courts and stadiums where they would normally play.
And that’s a problem for the Colorado Water Plan, a 2015 citizen-backed guide for helping Colorado stave off future water shortages and protect the environment while sustaining agriculture and other heavily water-dependent parts of the economy.
Tax revenues from the new gambling initiative, slated largely to help fund the plan, were initially expected to start streaming in later this year, after the May 1 start of newly legalized sports betting here.
But one look at the empty streets and shuttered casinos in Black Hawk and Central City makes clear that the future of sports betting and its promised tax revenues are uncertain at best, at least in the near term.
Estimates presented to the legislature late last year, after voters approved Proposition DD in November, indicated that the new tax might generate as much as $9.6 million in its first full year of operation, enough to pay for regulatory and administrative costs, and provide perhaps as much as $6.3 million for the Colorado Water Plan.
The pain from the pandemic is clear in Central City, where a church message board poses the question everyone is asking: When will things return to normal? April 21, 2020. Credit: Jerd Smith
That’s a fraction of the $100 million or so water officials believe it would cost to fully fund the plan on an annual basis, but it was an important first step in setting up a sustainable source of revenue.
Those early revenue numbers are out the window now, however, thanks largely to the pandemic.
“There’s just nothing to bet on,” said Doug Kemper, executive director of the Colorado Water Congress, a nonpartisan industry group that represents several hundred of Colorado’s key water interests.
But sports-betting revenue estimates were in trouble even before COVID-19 shut down sports.
By late December, the Department of Revenue had determined that the license fees on which revenue estimates had been partially based originally were set too high and would have to be brought down significantly, from $125,000 to roughly $1,200, according to the Division of Gaming.
Now gaming officials estimate annual revenue will be just $1.5 million to $1.7 million, far below the original $9.6 million.
“The Department’s internal revenue expectations are much lower than [the earlier] fiscal note estimates,” according to a Department of Revenue report to the legislature dated Dec. 19, 2019.
“It’s definitely a major blow,” said Floyd Ciruli, a political analyst who followed Proposition DD, and who tracks water issues for the Colorado Water Congress.
Sports-betting revenue could have been a bright spot this year, when the state budget is facing an estimated $2 billion budget deficit, one roughly twice as high as that generated during the Great Recession of 2008 to 2010.
Dan Hartman, director of Colorado’s Division of Gaming, said there are too many unknowns right now to predict what, if any, revenue the sports tax might generate this year.
Whether even the lower $1.5 million revenue estimate will hold is unclear, he said. “That’s going to depend on how quickly people come back. We just have to wait and see. I’m hoping it’s a lot more.”
But Hartman said the Division of Gaming did approve a new operations fee, which will at least cover the cost of overseeing betting.
“While we didn’t get those license fees that were written into statute, we did impose a fee [on operators] that takes the cost of regulation out of the tax money,” Hartman said. “So whatever tax money comes in will all go to the beneficiaries,” including the water plan and gambling addiction programs.
How much state money, if any, can be salvaged elsewhere for the water plan this year isn’t clear.
The Colorado Water Conservation Board (CWCB), which implements the plan, also receives funding from tax revenues generated by oil and gas production and those funds have helped pay for water plan programs. But that money is drying up as well due to the crash in oil markets. Because those revenues don’t flow to the CWCB in the year in which they’re received, their loss won’t hit the CWCB until the next fiscal year, which begins July 1, 2021, according to the Joint Budget Committee.
State agencies are expected to have a clearer picture of how much cash they will have to operate with once the Joint Budget Committee finishes work on a revised spending plan in early May. Until then each is evaluating various alternatives, officials said.
Becky Mitchell, executive director of the CWCB, said the agency hadn’t planned on big cash from the sports-betting tax anytime soon and that the news wouldn’t deter her staff from continuing to implement the plan.
“Just because we don’t have [that additional] money, doesn’t mean we stop working. It means we up our game,” she said.
Jerd Smith is editor of Fresh Water News. She can be reached at 720-398-6474, via email at jerd@wateredco.org or @jerd_smith.
Fresh Water News is an independent, nonpartisan news initiative of Water Education Colorado. WEco is funded by multiple donors. Our editorial policy and donor list can be viewed at wateredco.org.
This story originally appeared on Fresh Water News on April 22, 2020.
The Department of the Interior is supposed to manage both environmental conservation and mineral extraction. Because of these opposing interests, the balance between these imperatives tends to vary greatly under different administrations. As one might expect, priorities tend to shift toward conservation during liberal administrations and toward extraction during conservative ones. However, no administration has managed to diminish the pride and morale of career civil servants as much as the present one, according to two former top officials at the department.
The Water Desk spoke with Rebecca Watson and John Leshy, who visited the University of Colorado Boulder campus recently for an armchair debate hosted by the Getches-Wilkinson Center. Watson worked as Assistant Secretary for Land and Minerals Management under the George W. Bush administration and now is president of the Rocky Mountain Mineral Law Foundation. Leshy, now a professor of law at the University of California’s Hastings College of the Law, previously held the post of Solicitor for the Department of the Interior under President Clinton, and received the Defenders of Wildlife Legacy Award for lifetime contributions to wildlife conservation in 2013.
The following interview has been edited for brevity and clarity.
Water Desk:An ice breaker for both of you: What is your favorite national park?
Rebecca Watson: It’s easy for me: it’s Yellowstone and that’s why I moved to Cody, so I could live next to Yellowstone National Park. I was really struck by Hayden Valley the first time I went through.
John Leshy: I love them all. Yosemite probably is the one. Actually, my book is going to make the point that Yosemite was really the first national park, not Yellowstone … the feds gave it to the state, but to be managed in perpetuity under federal law, so that to me makes it kind of the first national park.
WD: So many environmental protections are being changed by executive order. What is the impact of using this governing tactic as opposed to passing bills in Congress?
JL: It’s certainly more durable to do it by legislation, although the formal executive orders do tend to have a bit of staying power. For example, when President Reagan came in in 1980, he did a number of executive orders on cost-benefit analysis and stuff like that, which subsequent Democratic administrations did not really change. I mean they tinkered with them, but they didn’t really change. So there is some stability in executive orders. But when you do something by executive order you always raise the question of do you have authority to do it, so it makes it challengeable in court.
WD:You both have talked about how the system is broken and there’s not as much working together as there used to be. Do you think that is one of the reasons we’re seeing so many of these rules change by executive order?
RW: Well, you saw it begin in President Obama’s administration when he faced kind of an intransigent legislature…So I think this is the response of the executive when they can’t work with a Congress. So, it’s not a surprise it’s been done before. Once somebody does it, then the next guy does it—or woman.
WD: What do you think the impact of that style of governing is at the ground level for the people who are impacted by these constant changes by executive orders, such as the recent Waters of the United States rule?
RW: This Waters of the U.S. rulemaking has been ongoing in the Clinton administration, Bush administration, Obama administration, and now Trump. It goes back and forth, and it’s a very important question of who has the authority over water in a state. Some is federal water. Some is managed by the state. Where’s that dividing line? So it’s a pretty fundamental question, and the different parties have a different viewpoint of it, so there is no settled opinion. The Supreme Court didn’t help things with a fractured five-part decision, which has led to all this confusion.
JL: It goes back actually to an ambiguity in 1972 [Clean Water Act], the first major claim to water, which gave the federal government regulatory authority over waters of the United States but had a very ambiguous definition of what Waters of the United States are. So, for the last 50 years, people, agencies, courts, administrations, have been sort of wrestling with this problem because it’s a difficult issue. If there were an easy answer somebody would have solved it a long time ago. And it does raise, as Rebecca said, not only the question of how do you define waters, but it raises this pretty fundamental question about local land-use authority versus national authority, because traditionally in this country, most land-use regulation has come through state and local governments. Not all—there’s always been some federal regulation—but this issue raises where’s that dividing line and that’s what makes it very controversial, very political.
The other reason it’s controversial and difficult is that the Clean Water Act was all about water quality. That’s what the regulation is designed to do, to protect water quality. But in protecting water quality you almost inevitably affect the allocation of water supply, which is a water rights issue. So you have water quality and water rights, and this rule, and this issue, is where that intersection is. Because water quality, by and large, is regulated by the federal government and water rights are regulated by the state government, you have conflict, so it really touches a lot of hot buttons.
WD:What implications might this new rule have for the way legislation like the Endangered Species Act is enforced?
JL: Well that’s complicated because the Endangered Species Act is a very complicated statute, but it has two thrusts, I mean the two sorts of places it goes. One is that it requires a consultation: anytime the federal government takes an action that could affect a listed endangered species, that’s when you have the consultation process and biological opinions, and there’s a whole regulatory apparatus that does that. But that only applies to federal action that the federal government takes, supports, permits or funds. And if there’s no federal funding, permitting, etcetera, the consultation process does not apply. But there’s another part of the Endangered Species Act, which makes it illegal for anyone—state, private, federal, anybody—to “take” a listed species, meaning harass, harm, kill, etcetera. That part is a universal application. So whatever the Waters of the United States rule says, and allows, the take problem is still a problem. The federal government really has no power under the Endangered Species Act to exempt anybody from the take except by the so-called God Squad, a cabinet-level committee with the head of the Corps of Engineers, the Interior Secretary and the EPA. These three people were given the power to exempt a project from the Endangered Species Act, which meant they were deciding that this species could be exterminated.
Anglers on the Colorado River, near Lees Ferry, Arizona. Source: Adobe Stock
WD:Do you have a sense of how the culture has shifted in the Department of the Interior from the last administration to this one? Is it a starker contrast than in years past?
RW: I think the shift in this administration has been different from the perspective of the career employee. And I think, always when you have political appointees come into a building where they’re a thin layer on top of thousands of people, there’s always an “us versus them.” Especially when you’re following an administration that was the opposite party, you know…typically over six months or so you learn to work with them, learn to trust them and understand the role of a career civil service in our system, which is that they are to be apolitical. The people speak, they elect a president, he sets a policy and they help the political appointees implement that policy. That’s the way it’s supposed to work. And I think in this administration we’re seeing this play out right now with lists of suspected political appointees, much less the so-called “deep state” of career appointees that this administration has targeted. [The administration] has said very negative things about career people, and that matters to career people. That, I think, is a significant difference in my opinion and it’s not positive.
JL: I agree 100%. I mean, we both had experience in the Interior Department and I think probably agree on a lot of how it really works. And she’s exactly right that that layer of political appointees is, about as I remember, 50 people out of 70,000. Okay, so 69,950 people in the Interior Department are career civil servants, and they make the government go, and they actually make 99% of the decisions that you never hear about. And then the political people, you know, obviously have the power to because of elections to control and decide the big policy issues. And they do, they may decide them in the way that a lot of career people disagree with. But I think anybody who spent time in those big bureaucracies understands the bureaucracies have enormous responsibilities and the authority and the responsibility to make decisions that affect a lot of people’s lives. But they’re made, hopefully, in predictable, stable ways and life goes on, regardless of the administration. It is troubling what’s happening now because there really is this sort of assault on the career people and they feel under siege. I don’t know how it’ll turn out, but it’s not a healthy thing.
RW: People that work in the government, in those positions, they view themselves as public servants. They’re, you know, not people wearing halos necessarily, but they do have a source of pride. They work for the federal government, they are public servants, they’re doing something that matters to the American people. And to be denigrated and treated in a suspicious manner that has never ended for, you know, over three years of this administration—nobody would want to work under that kind of situation. It’s soul destroying, I think.
WD:The National Oceanic and Atmospheric Administration and U.S. Geological Survey have been told to scrape the phrase climate change and this is one of the cultural implications of the new administration. Do you have a sense of how unique this is?
JL: It’s certainly unusual. Everybody tries to shake things, I suppose, to serve your sort of political ends regardless of which administration it is. But I think the degree to which the control on the basic facts in this administration is pretty unprecedented. I don’t recall anything like that.
RW: In the Bush administration, one of our mantras, or clichés if you will, but was something we took seriously was “sound science.” You don’t hear that phrase anymore: “sound science.”
JL: You hardly even hear the phrase “science,” which is too bad because certainly natural resources, public lands, water facts control a lot of the policy. What’s going to happen if you do “x”? The basic facts are the bedrock of good resource management. And if you’re denying the facts, we’re in trouble.
RW: Science doesn’t set policy but it informs policy, and you have to trust the science and the basic facts to make decisions. So, being married to a scientist, I don’t like the disregard for scientific evidence. And, of course, as lawyers we need to get what the facts are. We have to hear from our clients, but then we have to look—okay, what’s the other side? The facts are important. I think scientific data is critical for the Interior Department.
JL: It’s not just sort of controlling what the factual reports are, but I think there’s a problem with the funding. Government does an awful lot of basic science, and the USGS does an awful lot of basic things that you never hear about in terms of assessing water quality and water quantity and earthquakes—it’s an essential function. Michael Lewis is a well-known author and his latest book [“The Fifth Risk”] is really interesting. It’s on what might be the most boring subject you could think of, which is science in the federal government and what’s happening to it. It’s about NOAA and the USGS. He’s a wonderful writer and he really tells a great story about this problem of destroying the kind of bedrock scientific capacity of the government and how dangerous it is, basically for everybody.
WD:John offered a book, so do you have any recommendations, Rebecca?
RW: I just read this book called “The Swamp” by Michael Grunwald on the Everglades. It’s just fascinating because he’s a reporter, so he writes really well. And he just takes a look at the Everglades, but it’s really the history of Florida. What were the Everglades like? He went back to the original diaries of the soldiers that were down there chasing the Native Americans that lived there. What did they see? And then the idiotic ideas they had to drain the Everglades: water flows downhill, they thought it’d be really easy. Well, they managed to screw everything up. So then during the Clinton administration I think was the first federal action to try and restore some of the functionality of the Everglades. So it’s just this amazing ecological history, Florida history. And, of course Florida, is full of really weird characters, so it’s a great read.
John Leshy biographhy John Leshy joined the University of California, Hastings College of Law in fall 2001 after serving as Solicitor (General Counsel) of the U.S. Department of the Interior throughout the Clinton administration. Previously, he taught at Arizona State University College of Law (1980-1992), and served in the Interior Department in the Carter administration as special counsel to the Chair of the Committee on Natural Resources, U.S. House of Representatives, and with the Natural Resources Defense Council in California. He started his legal career as a litigator with the Civil Rights Division of the U.S. Department of Justice. In 2008 and 2009, Leshy co-chaired the Obama administration transition team for the Interior Department, after heading the Interior transition team for the Clinton administration in 1992 and 1993. In 2013, he received the Defenders of Wildlife Legacy Award for lifetime contributions to wildlife conservation.
Rebecca Watson biography Rebecca Watson is a shareholder in the law firm of Welborn, P.C. in Denver and serves as president of the Rocky Mountain Mineral Law Foundation. She is the fourth woman to serve as president and is leading the foundation through its first strategic plan in its 66-year history. In her 40-year career, Watson has represented natural resource, oil and gas, and renewable energy clients as well as served in the federal government. As Assistant Secretary for Land and Minerals Management in the U.S. Department of Interior in the George W. Bush administration, she had oversight over three bureaus, including the Bureau of Land Management. Earlier, she served as Assistant General Counsel for Energy Policy at the U.S. Department of Energy. Watson was named the 2011 Distinguished Natural Resources Practitioner-in-Residence at the University of Denver’s Sturm College of Law, her alma mater. Watson is on the board of the Buffalo Bill Center of the West, a five-museum complex in Cody, Wyoming, where she recently moved.

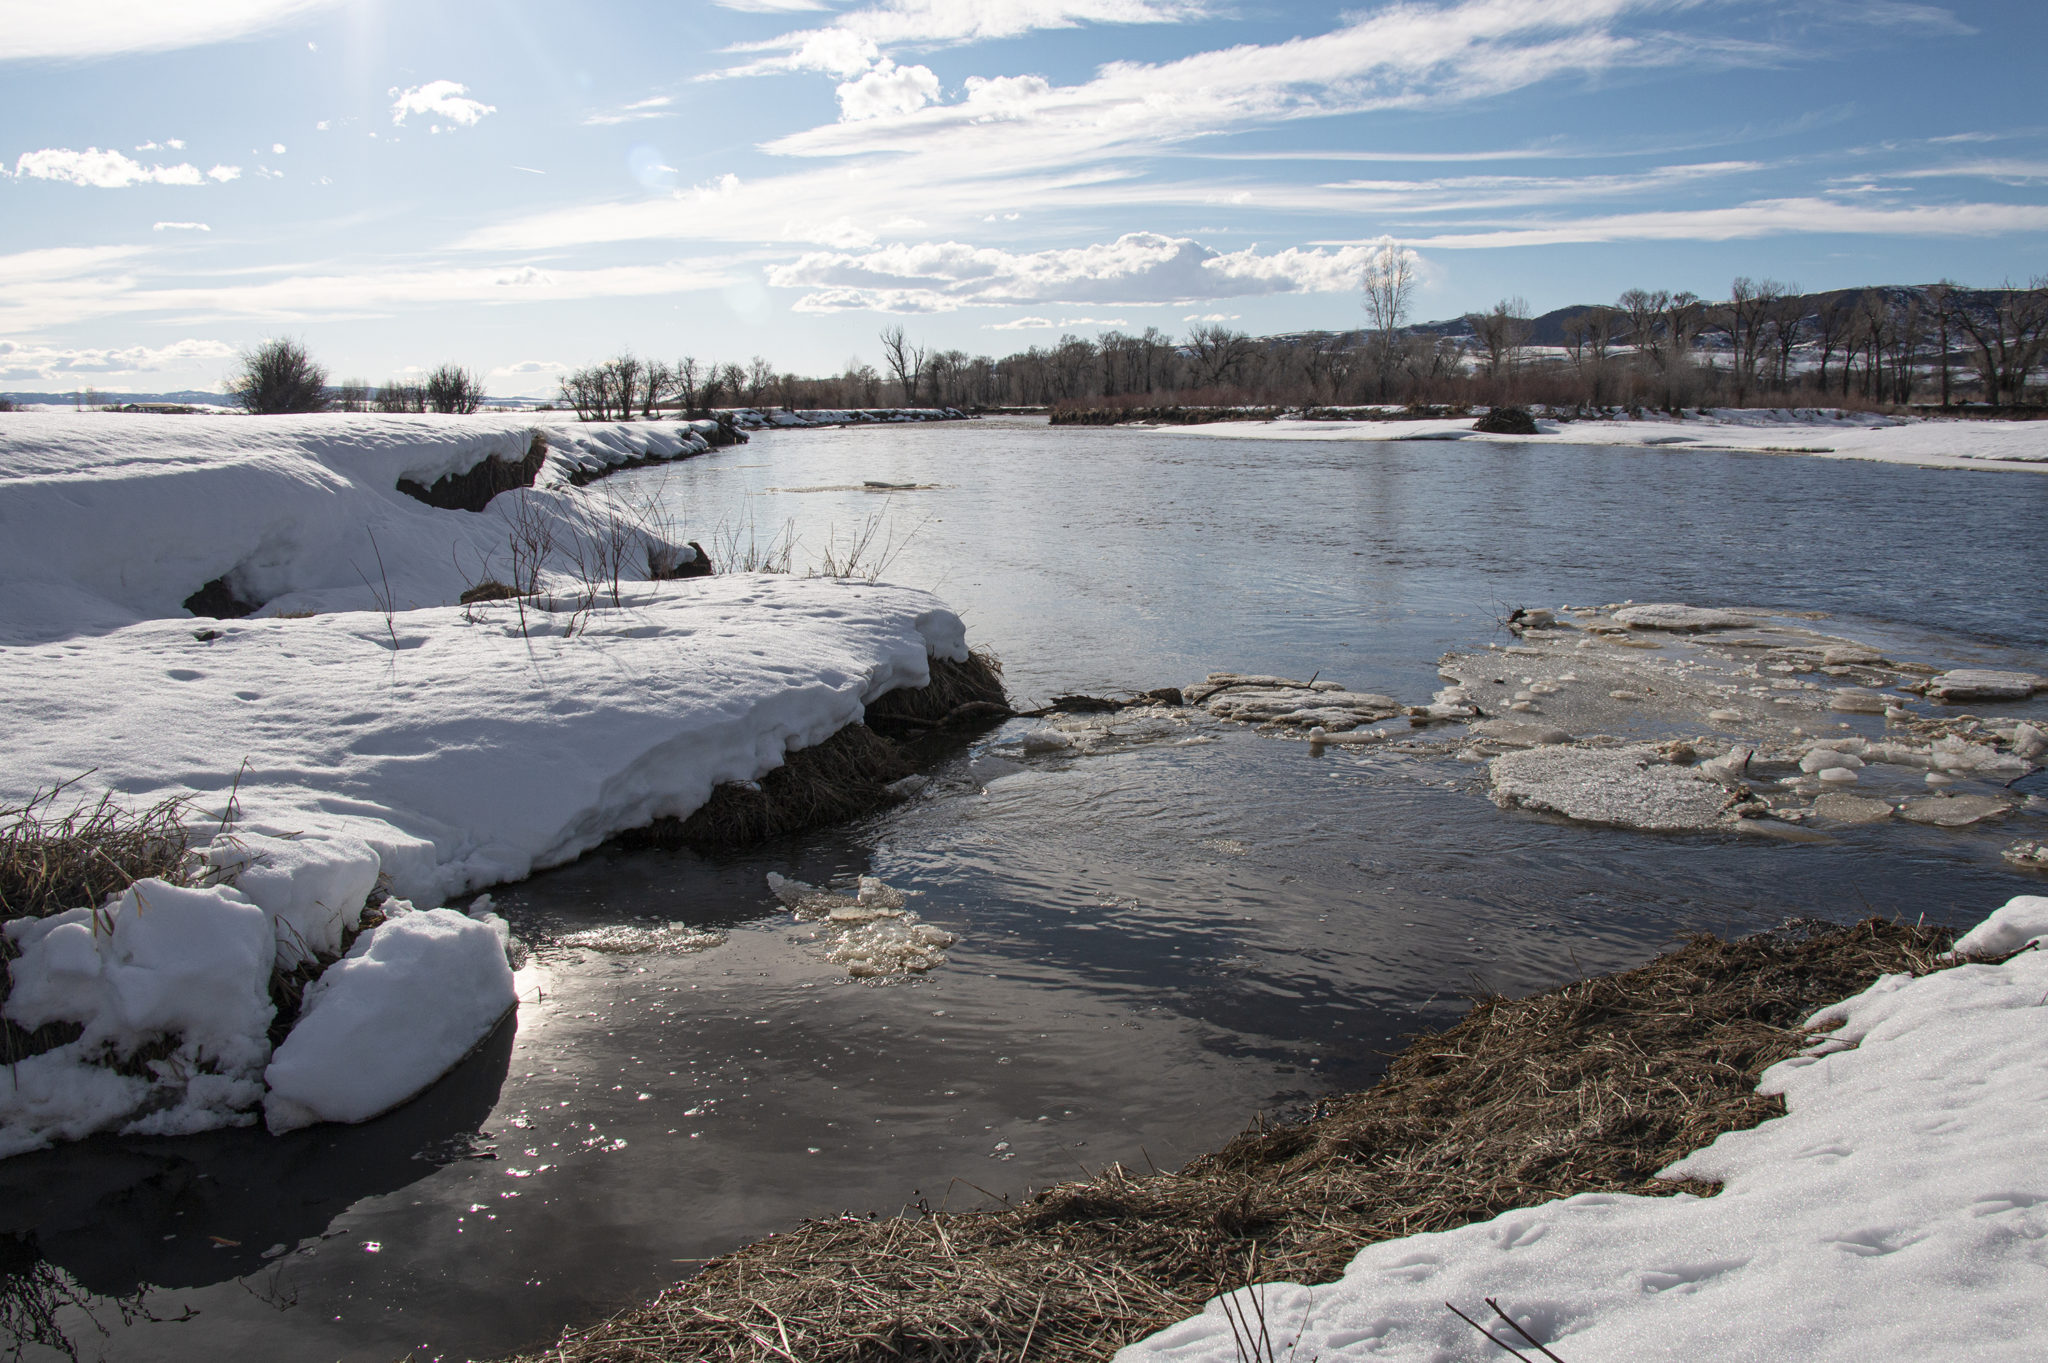

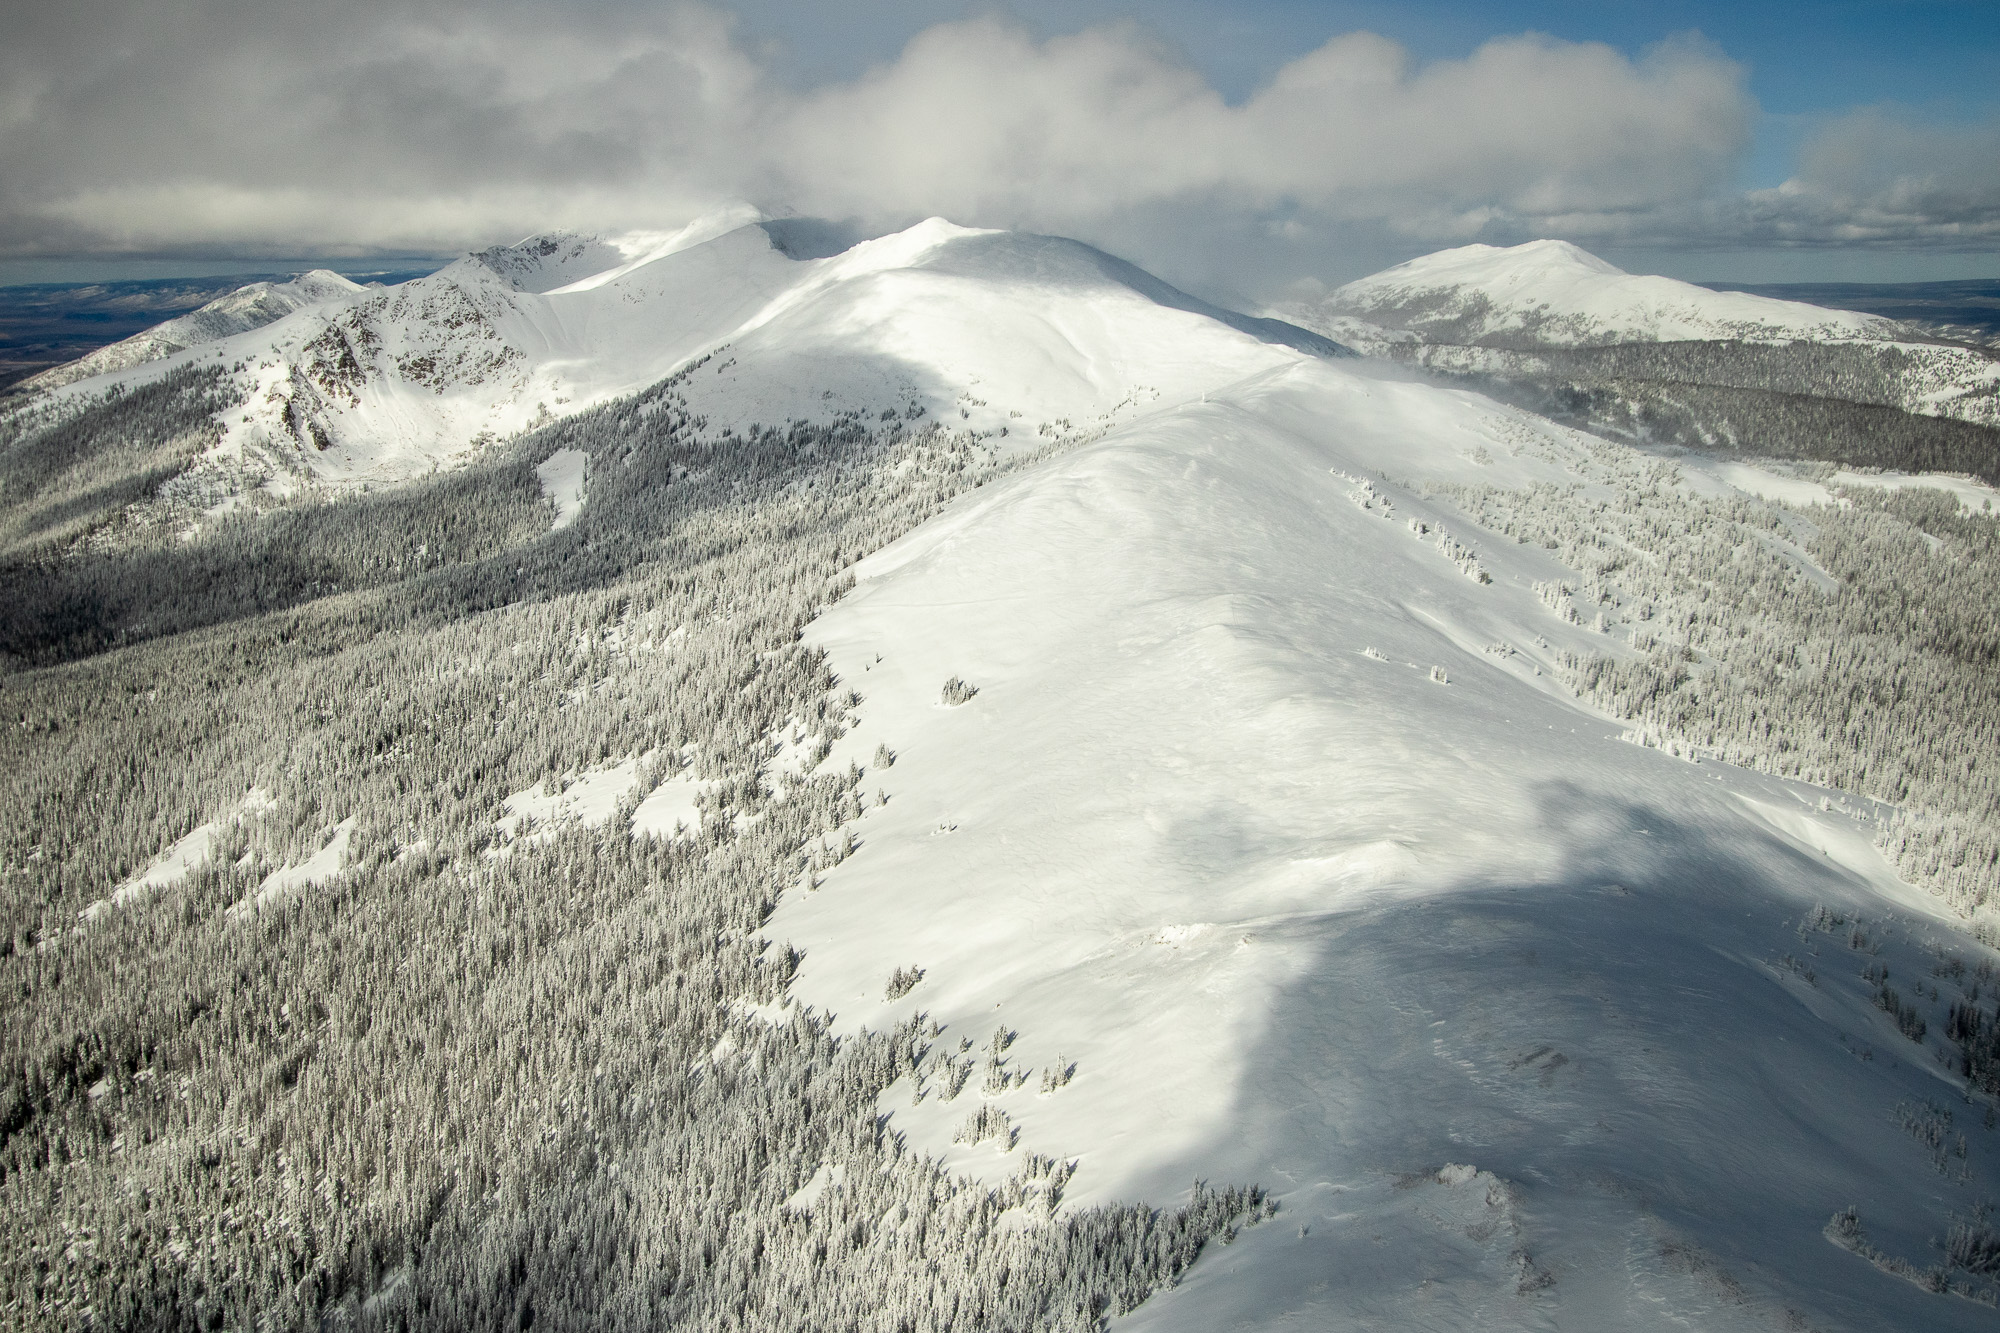
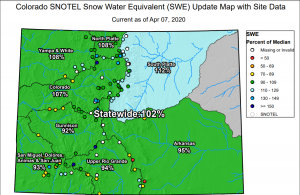

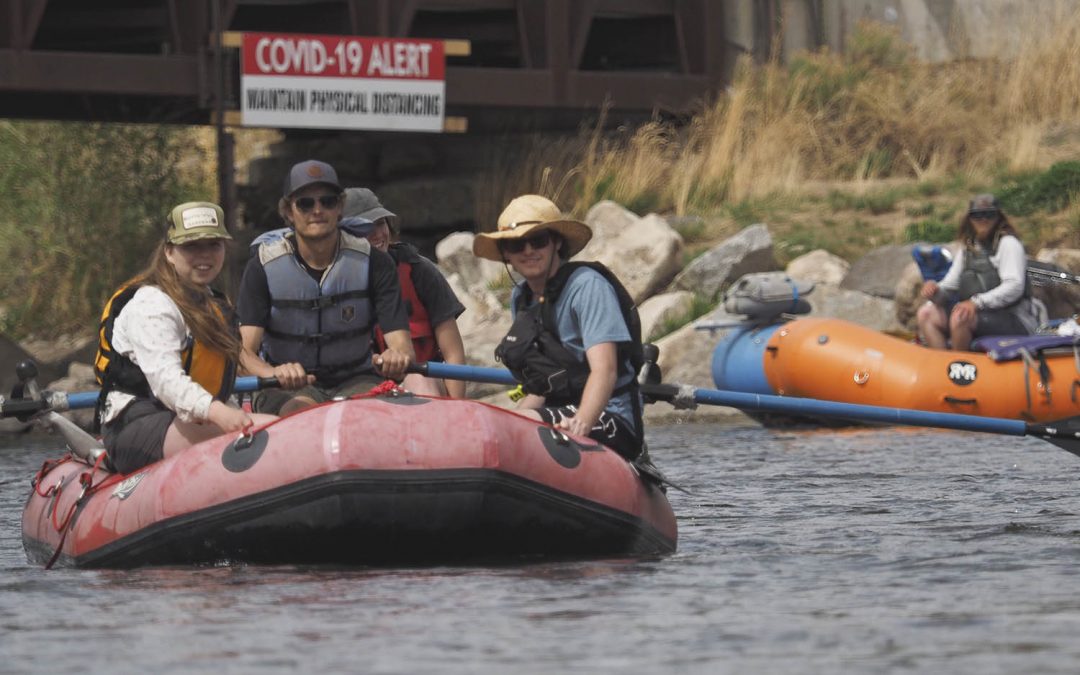
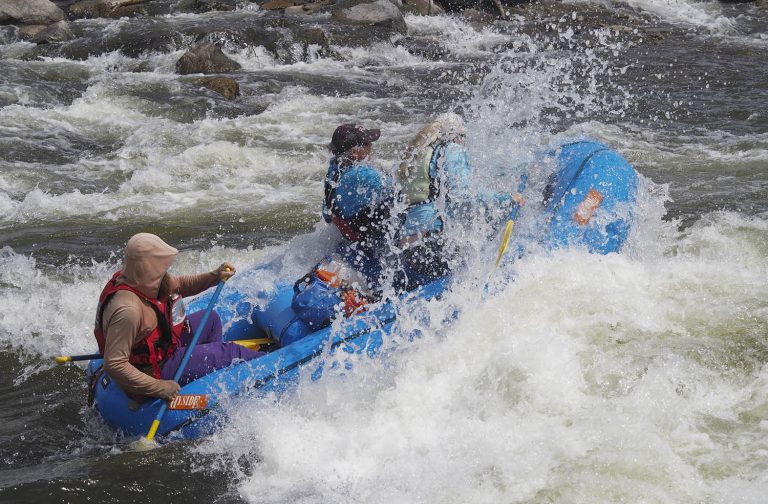
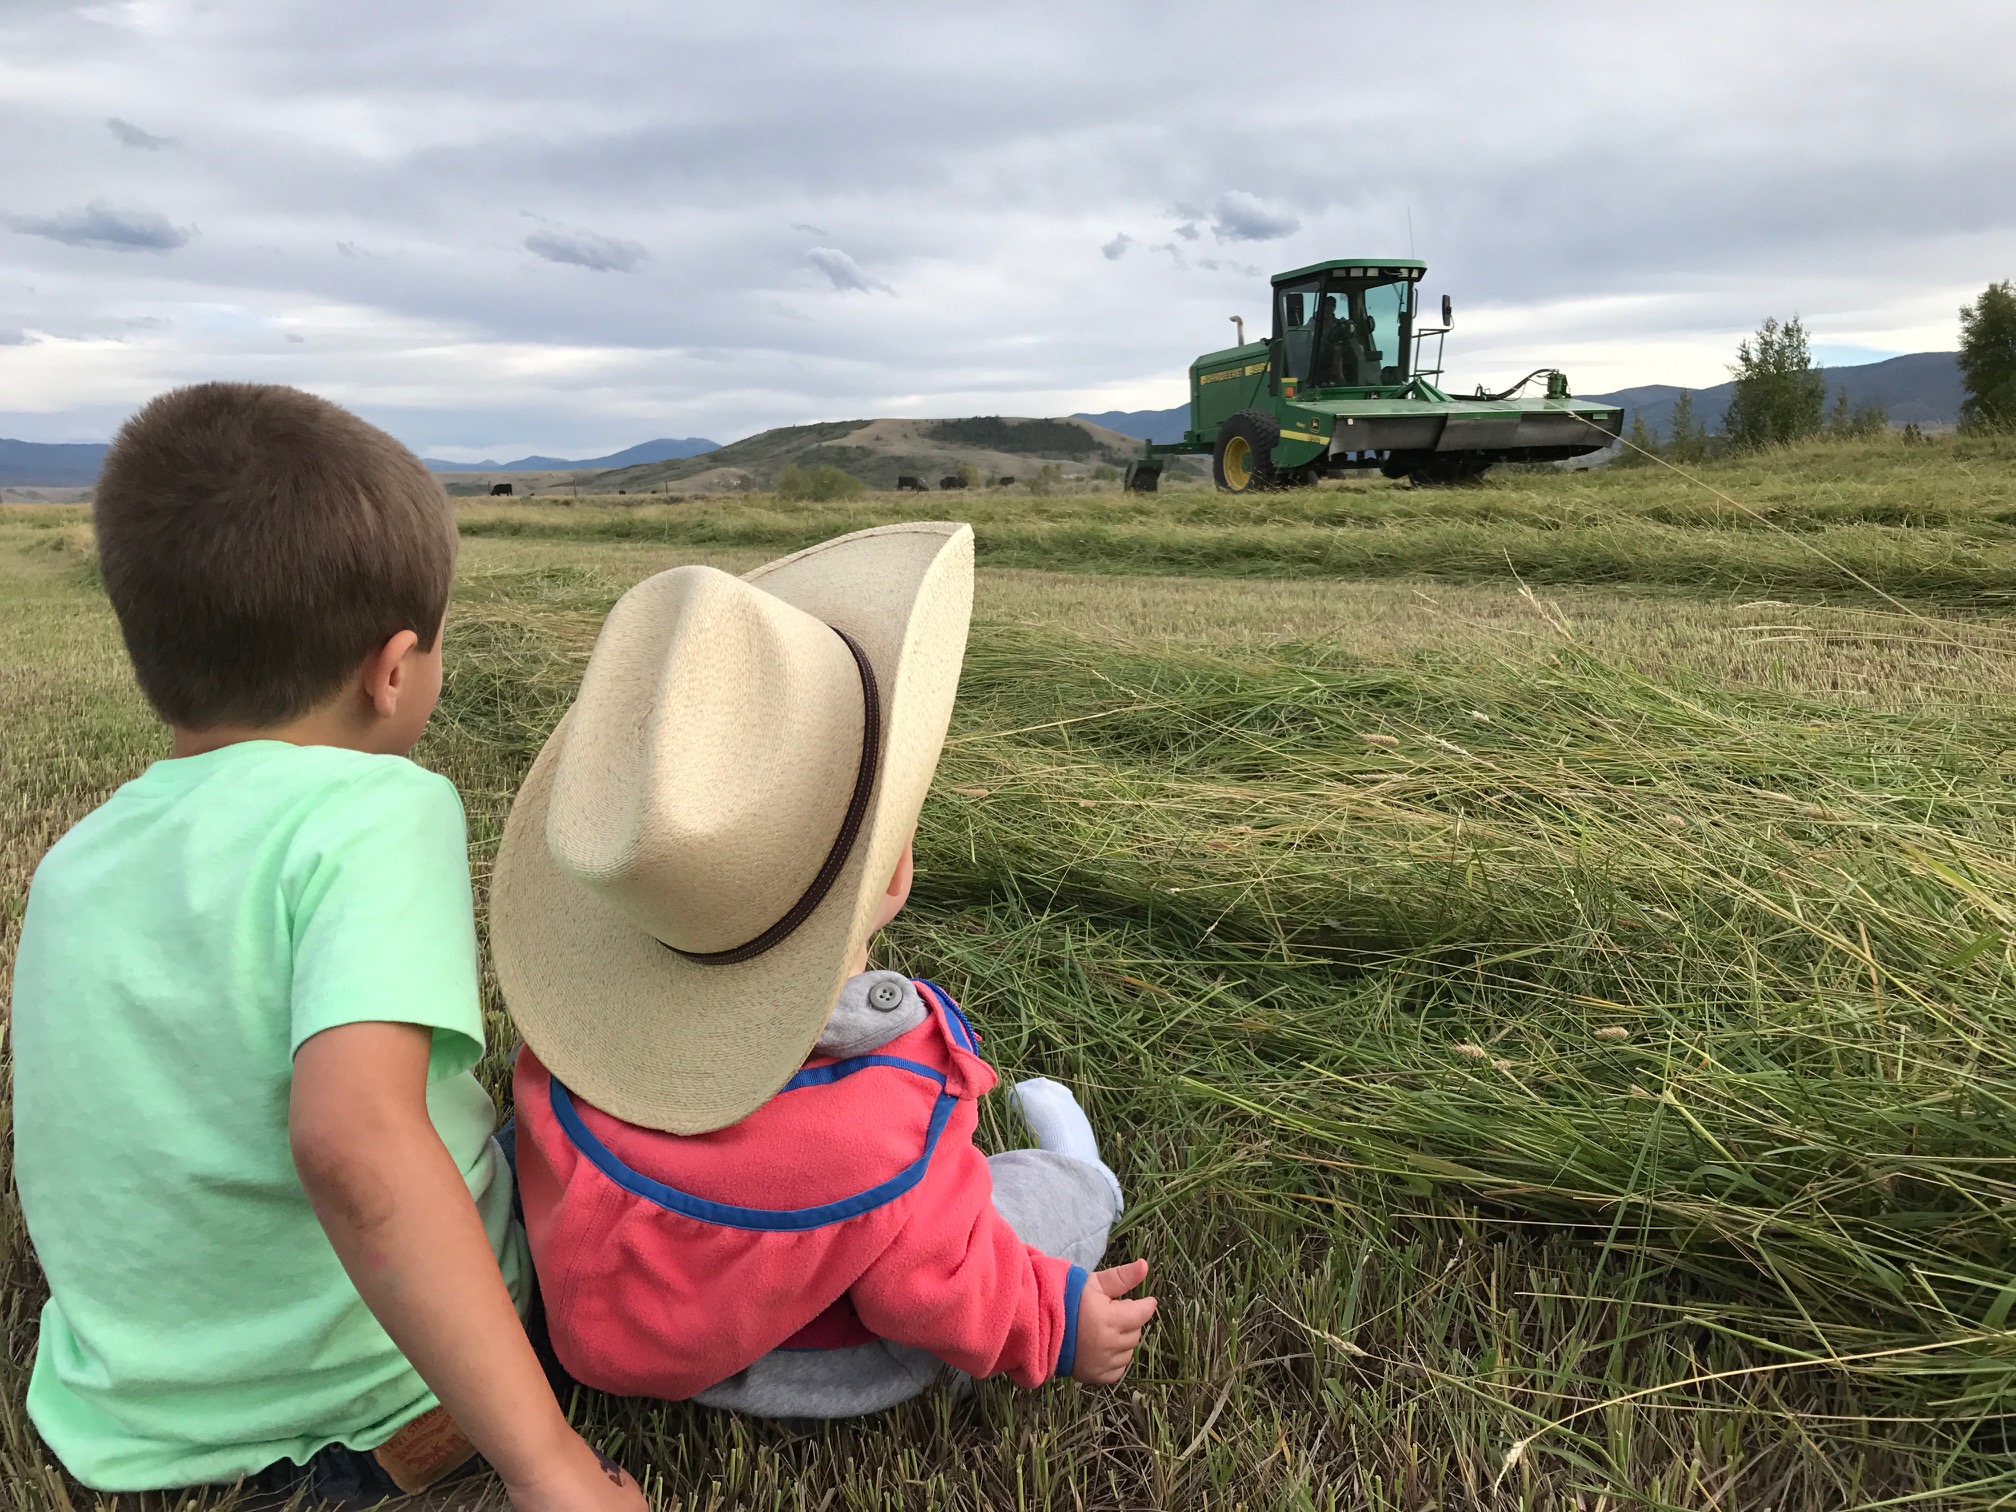
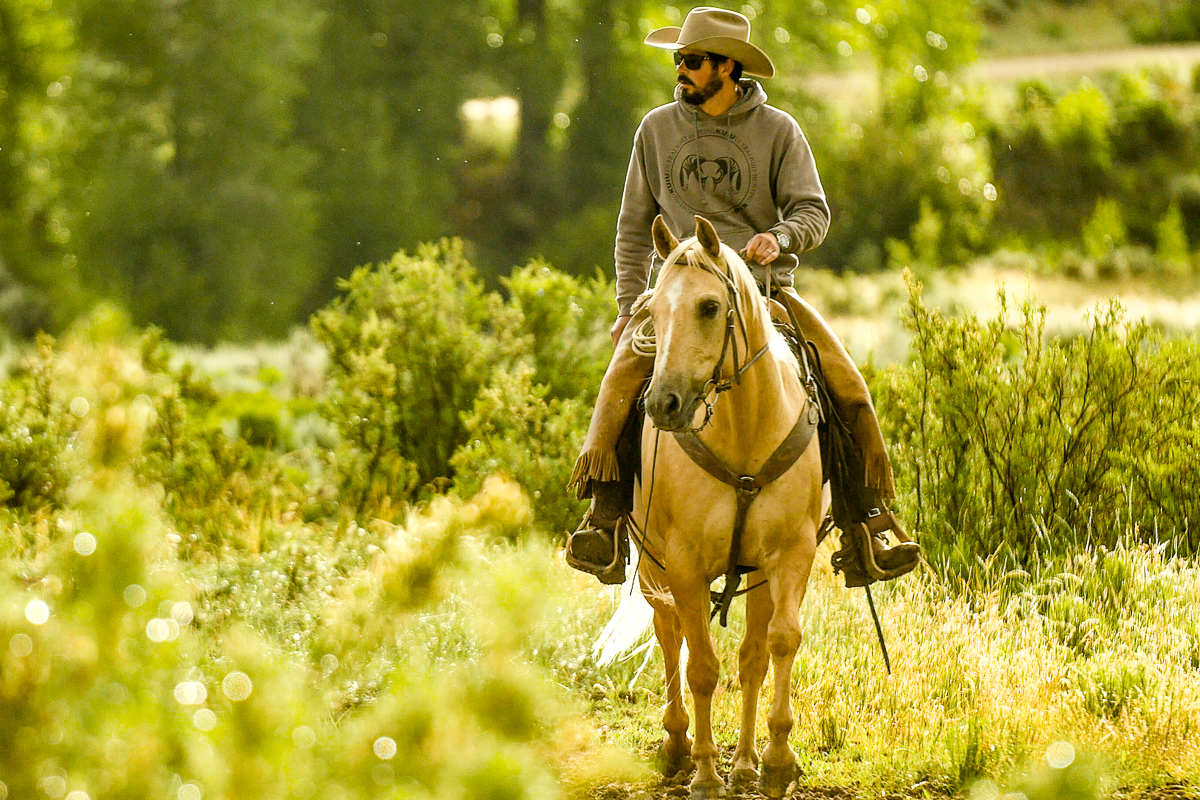
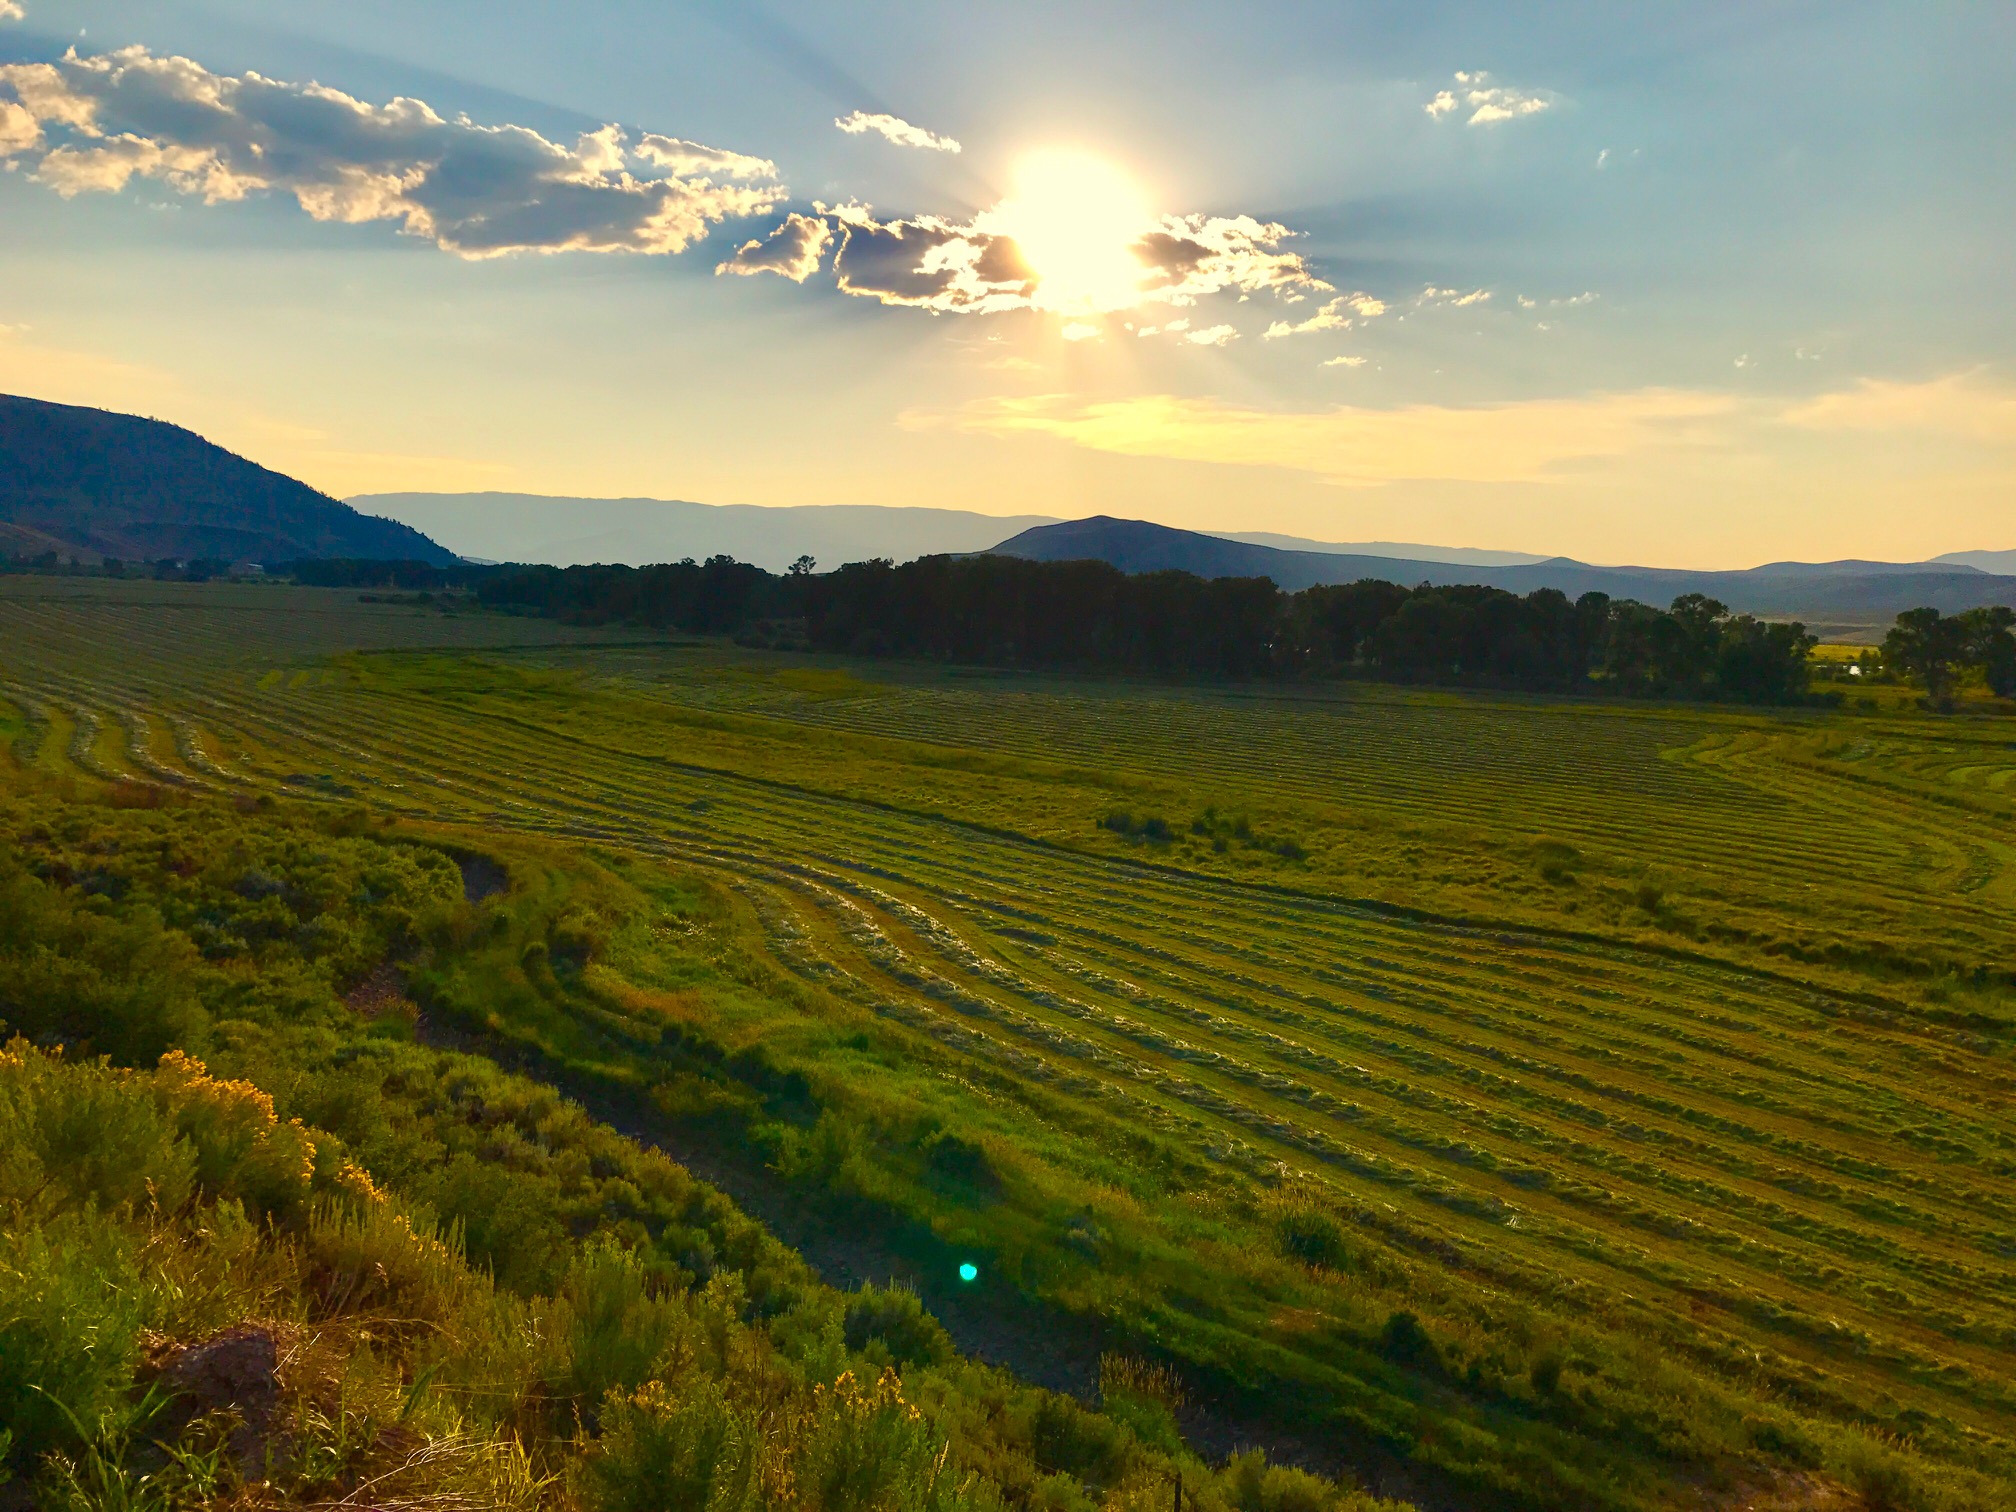
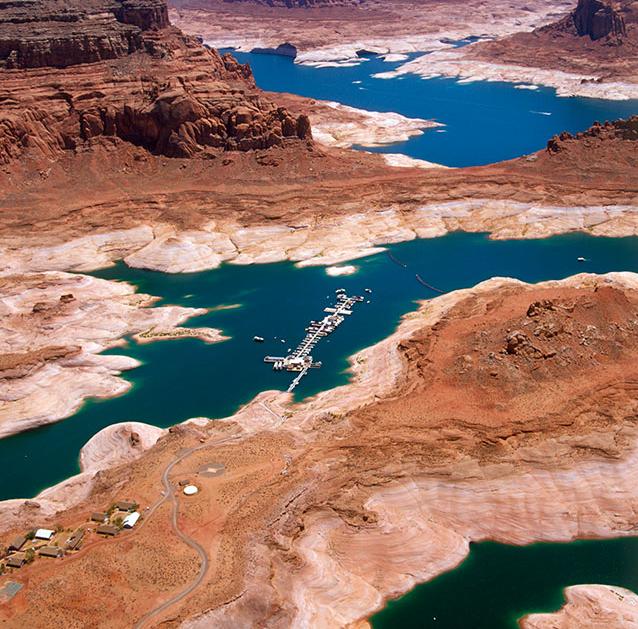
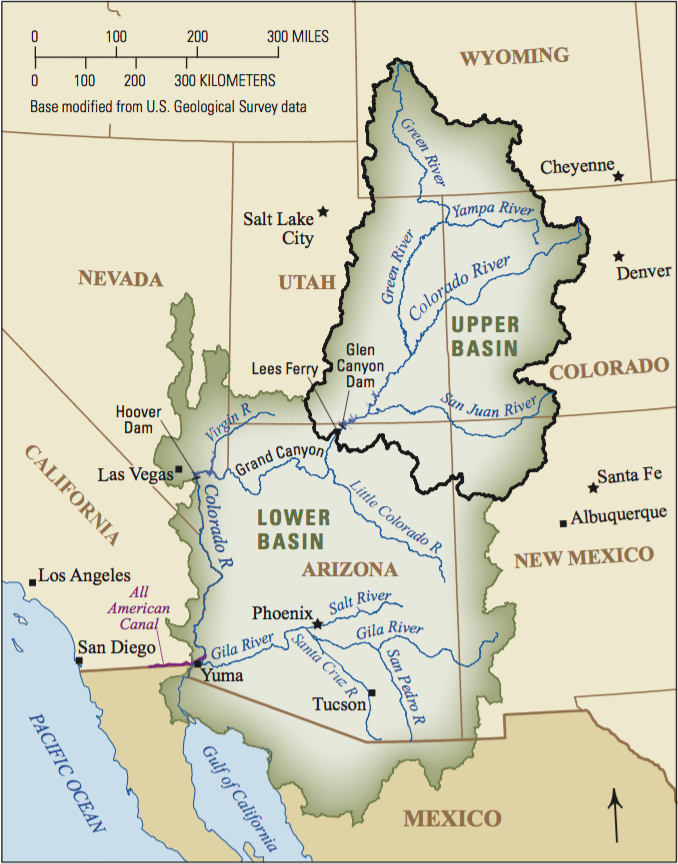
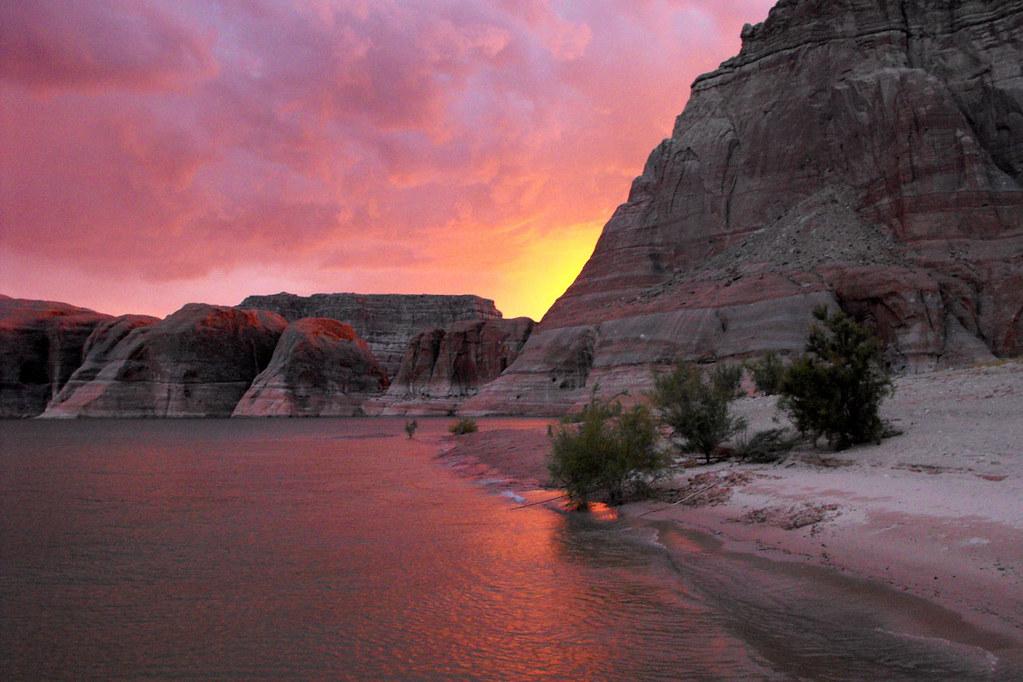


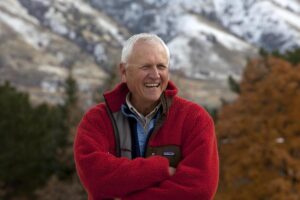
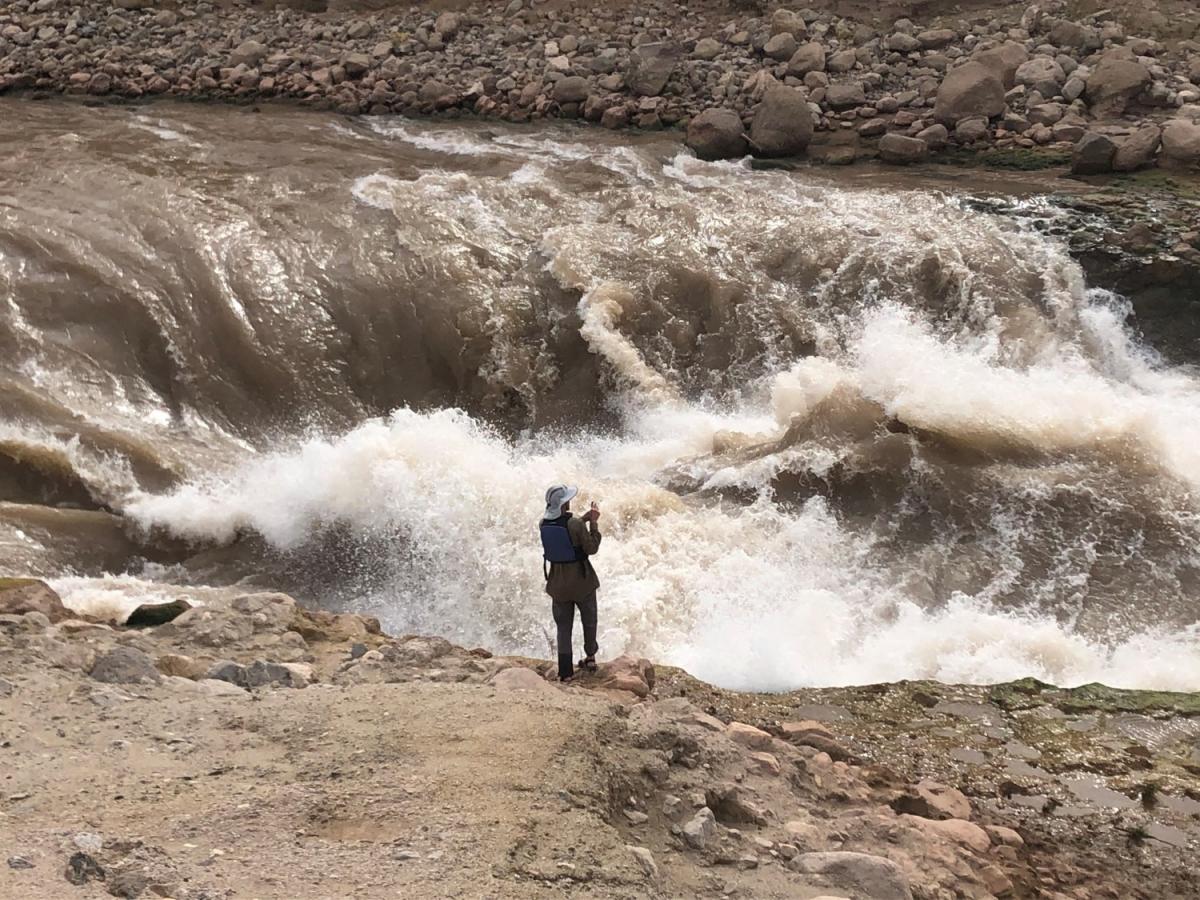
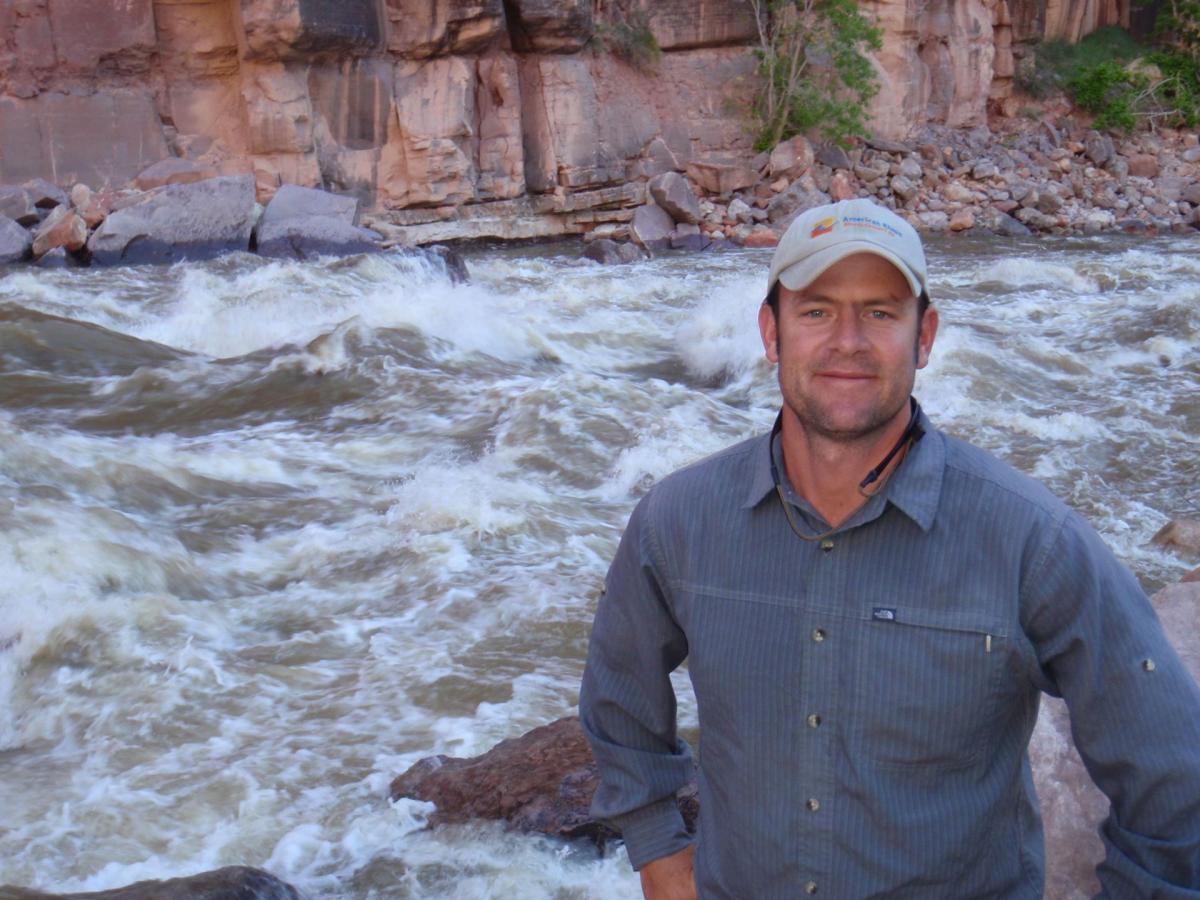


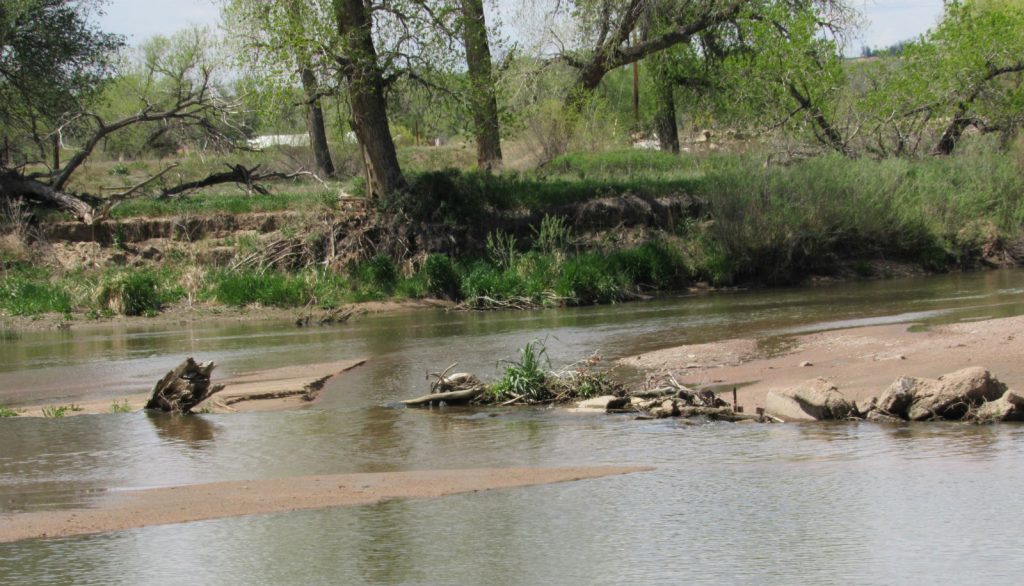


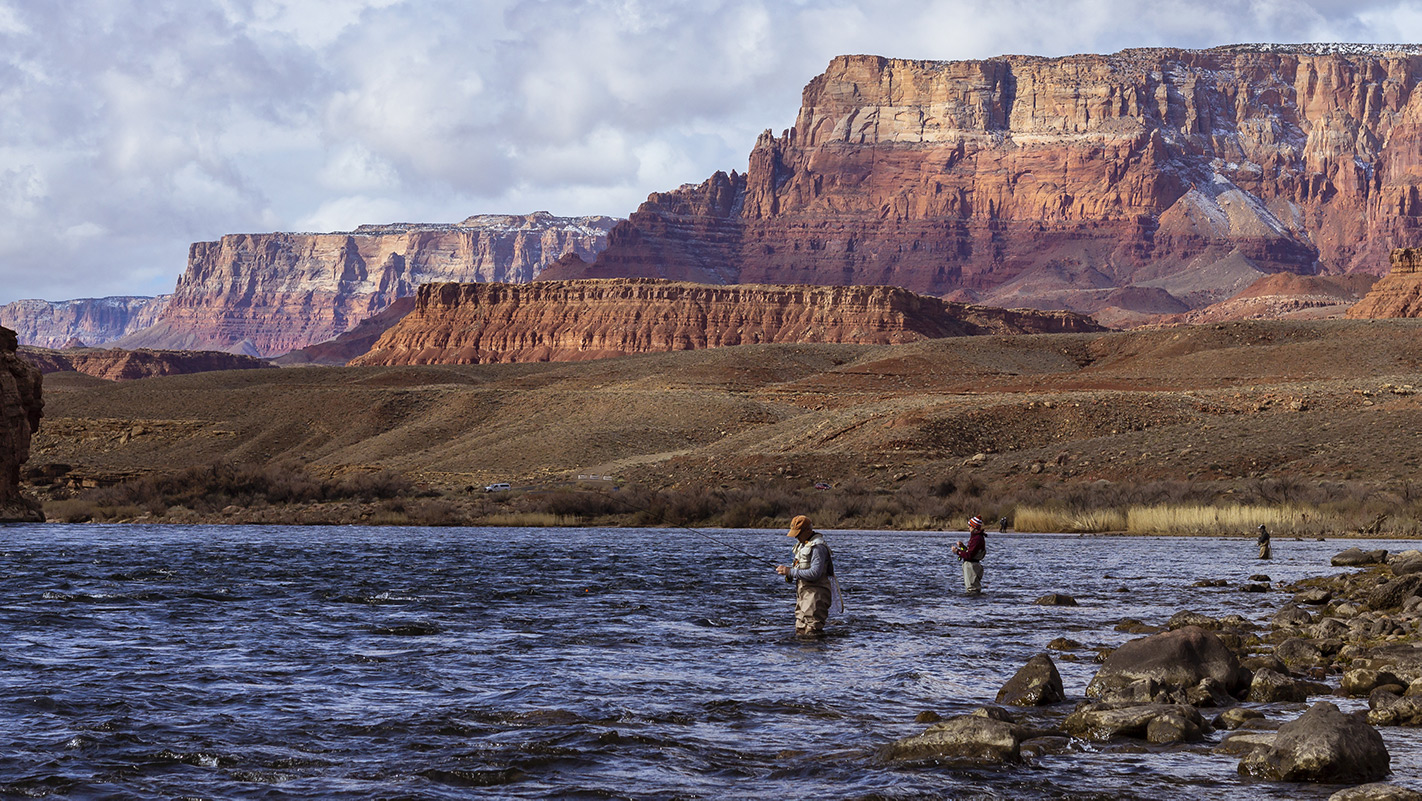
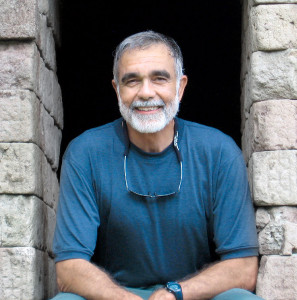


