

Consistent, widespread testing of the community’s wastewater for COVID-19 has been long-awaited as traditional public health metrics have struggled to fully capture the spread of the virus in the community’s transient population. Now, sanitation districts throughout the valley are participating in a state-sponsored tracking program, but local public health officials are grappling with interpreting the relative highs and lows, and how they compare to the picture captured by other metrics.
“Since April, we’ve seen a disconnect between our incidence rates, our positivity and our wastewater measurements,” Pitkin County epidemiologist Carly Senst told county commissioners July 26. “The wastewater is showing much higher prevalence than what we’re seeing come through.”
Wastewater testing can detect the presence of the SARS-CoV-2, the virus that causes COVID, as people infected with COVID can shed RNA — the genetic material from the virus — in their feces long before they show symptoms or get tested. This metric can help local public health departments better understand the spread of the virus in their communities, which has become more challenging with people increasingly using at-home tests, and especially in a tourism-oriented community such as Aspen where traditional metrics have often fallen short. Incidence rate, for example, counts cases among only county residents, who may comprise just a slice of the total daily population including workers and visitors.
But wastewater data can be challenging for local public health departments to evaluate because it is a new and imperfect tool and has its share of shortcomings.
“We are still in the process of collecting data to determine if we can be more specific with the relationship between wastewater levels and our incidence rate,” Senst said.
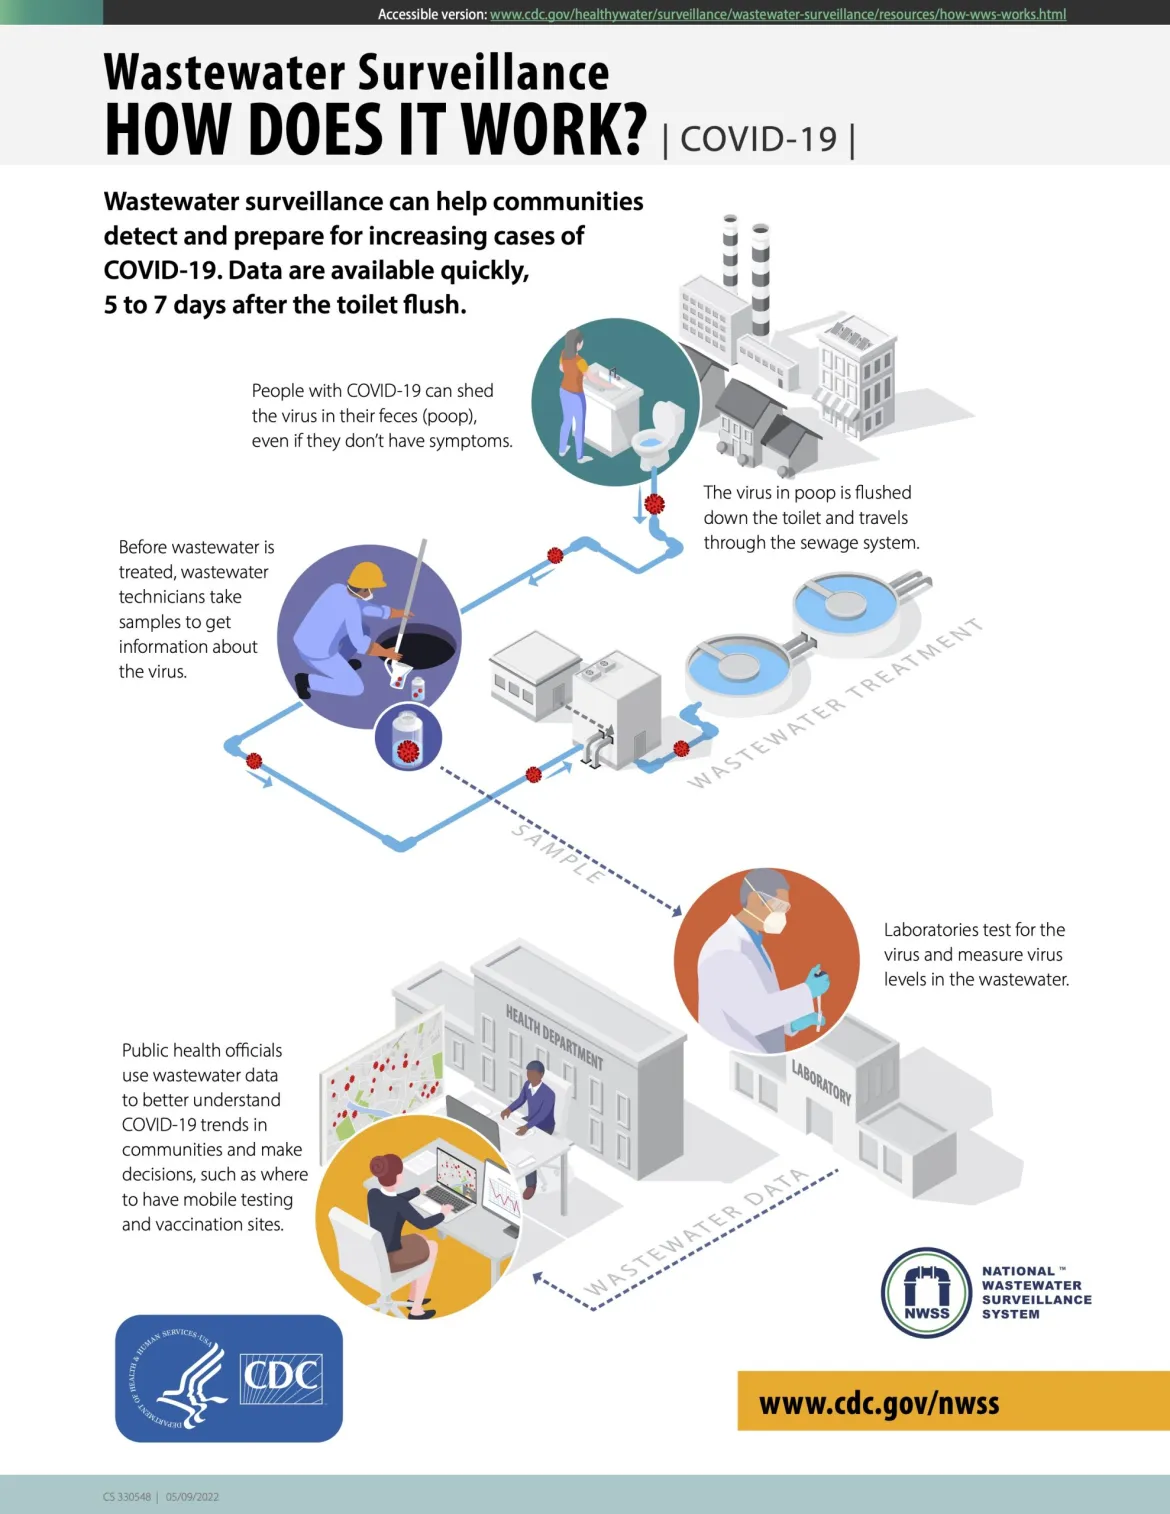
This infographic from the C.D.C explains how the wastewater monitoring program works.
A statewide window into wastewater
Pitkin County has been sending wastewater samples to a Colorado Department of Public Health and Environment (CDPHE) lab in Denver since December, when the Aspen Consolidated Sanitation District (ACSD) became the first wastewater treatment facility in the valley to participate in the state’s COVID-19 Wastewater Monitoring Project. The project, launched in August 2020, is a collaboration between Colorado State University and CDPHE. It now incorporates data from 55 wastewater utilities across the state, including Aspen, Snowmass Village, Basalt and Glenwood Springs. (Carbondale doesn’t participate in the state’s program but sends samples to the U.S. Centers for Disease Control and Prevention.)
Besides knowing whether the virus is present, wastewater data has proven useful in informing public health departments quickly of when new variants are circulating in the community, according to Senst. The omicron subvariant BA.5 was first detected in the Snowmass’ sewage May 16, and it has since been found in Aspen’s wastewater since May 30, Glenwood Springs since June 6 and Basalt since July 11.
A CDPHE courier comes twice a week to each of the four participating utilities in the valley to collect the samples and bring them to a lab in Denver. That lab then analyzes the samples and reports the data on the CDPHE wastewater dashboard typically within four business days from when the state lab receives the samples, according to state officials. Courier times can vary across the state and analysis can take longer, which may result in reporting delays.
Relative heights of peaks leave officials scratching their heads
This data shows that about 2.8 million copies of the virus were detected per liter at the Aspen treatment plant Jan. 6 — the highest detection level recorded at the Aspen facility since the monitoring program started.
This coincides with the highest case counts recorded locally as COVID spiked in Aspen with the omicron wave during late December and early January. According to CDPHE’s data, an average of 121 new cases per day (based on the three previous days) were reported in Aspen on Jan. 5 within the sanitation district’s boundaries, which extend roughly from the airport to Smuggler Mountain. This dropped slightly to 117 new cases on Jan. 6. Pitkin County’s seven-day incidence rate at the time was about 3,000 per 100,000 — the highest rate the county has ever recorded.
Senst noted that Aspen has a relatively small community with a large transient population of tourists and the commuting workforce. “So spikes don’t always mean that there is a higher incidence rate among the community (although it could),” she wrote. “It could also mean that there was a large event that brought a lot of people into the Aspen area.”
Glenwood Springs also saw its highest case counts of the pandemic during the winter omicron surge, according to incidence-rate data based on new infections among the resident population. The number of daily cases spiked to its highest level in the sewershed — the community area served by a wastewater-collection system — with about 70-72 cases Jan. 5 and 6, based on the average of the three previous days. The number of virus copies in the Glenwood Springs wastewater system also climbed, to a high of 300,000 copies per liter — well short of the concentration experienced by Aspen during its concurrent peak.
More recently, the sanitation district in Glenwood reached its record level, with 481,000 copies per liter July 28, while the number of reported new cases was low, hovering around a three-day average of 10 cases in mid-July.
Although the late July number was the highest level of copies the county has seen since January, when Glenwood Springs started sending samples, Garfield County public health specialist Carrie Godes said she didn’t think they could accurately say what caused that spike.
Garfield County epidemiologist Mason Hohstadt agreed with Senst that it’s still early in the process to draw any conclusions, but he also noticed a disconnect between the dropping number of reported positive tests and the recent spike in copies of virus in Glenwood Springs’ wastewater samples.
Wastewater measurements are only a guiding tool to know where we’re standing with the virus. “We are using it as a way of being able to give people information at this point, especially going into the third year (of the pandemic),” Hohstadt said.
The four participating valley treatment plants all recorded high levels of virus copies about mid-July. Aspen and Snowmass recorded more than 1 million copies, Glenwood Springs was just shy of 500,000 copies, while Basalt spiked to 2.8 million copies per liter, or as much as Aspen during January’s omicron tsunami.
“We can’t always pin down why these types of peaks in the wastewater surveillance data occur, but the theory is that there was a higher level of disease burden during that ‘peak,’” Senst wrote in an email. “Was it from tourism or another source? We are not able to tell.”
Although an increase in COVID presence in wastewater may not be surprising as more tourists are coming into town and variants such as BA.5, which allows reinfections, keep spreading, the data collection is still new and requires more time for local public health to make heads or tails.
Since early this month, Glenwood Springs’ number of copies has ranged from about 20,000 to about 60,000. Aspen’s recent number of copies has varied between 301,000 and 386,000 so far this month, while between 242,000 and 305,000 copies have been detected in Snowmass Village’s sewershed.
In Basalt, a week after the 2.8 million peak in mid-July, wastewater data dropped to 371,000 copies on July 21.
Senst added that the data being collected now will help them better understand the peaks and valleys in future trends. “The more data we have, the better picture we are able to see,” she said.

Limitations of sampling the valley’s transient population
Wastewater measurement is only a snapshot of the presence of the virus in wastewater. One data point doesn’t necessarily indicate a trend as does a seven-day incidence rate.
The valley’s transient population remains an obstacle to determine disease burden on the community. When the lab publishes data after analyzing samples, a new wave of tourists may have already arrived and those who were in the valley the week before may have already left.
CDPHE officials confirmed that tourism and other factors may impact single spikes in smaller communities. “For example, a special event or a tour bus depositing waste into the sewershed can impact a sample. We’ll get occasional spikes, and this is why we recommend looking at trends rather than single data points,” state officials said.
Wastewater data is best used in combination with other metrics, including case numbers and incidence rate.
It is also worth noting that any residences or buildings with their own sewer system will not be recorded into the data, because wastewater measurements include only flow being processed through a participating municipal treatment facility.
Wastewater samples are not collected daily, the Pitkin County’s COVID update said Aug. 2. CDPHE may sometimes face delays in sample collection or data reporting, which can affect the ability of local public health departments to interpret accurate information from the wastewater monitoring program. “It takes a few weeks for everything to be processed, and sometimes the ‘peak’ has already passed by the time we get the data,” Senst wrote.
Even though Aspen wastewater treatment was the first in the valley to be part of the state’s program, facility manager Nathan Nelson wishes it had happened before people were vaccinated and boosted. “By the time they actually started testing in Aspen, very few people seemed to care.”
A more burdensome process for smaller sanitation districts
Although the wastewater collection process hasn’t impacted the operations of larger sanitation districts such as Aspen or Glenwood Springs, the task has been more time consuming for smaller districts with limited personnel such as Basalt, which has been collecting samples since May.
If a facility has only one operator, that person may get busy and may not be present for the sample collection and has to cancel the pickup, resulting in no sample being sent to the lab. Smaller districts sometimes struggle to keep up with the sampling frequency and find entering information both on paper and online redundant and time consuming for staffers.
CDPHE officials said twice-a-week sampling is necessary to establish a trend and has always been a requirement of the program. The state is also working on modernizing their systems and transitioning to an online-only sample submission form. In the meantime, utilities still have to submit both a paper and an online form.
The testing process doesn’t cost anything to the districts, because it’s fully covered by CDPHE, which has received and budgeted approximately $9.4 million in federal funds to support COVID wastewater surveillance testing from January 2021 through at least July 2023, state officials said.
CDPHE also shares its data with the CDC’s National Wastewater Surveillance System. Colorado has been actively participating in the NWSS since January 2021, and the Carbondale Wastewater Department has been sending samples twice a week directly to the CDC since June 20.
This story ran in the Glenwood Springs Post-Independent, Vail Daily and Aspen Times.
The Water Desk’s mission is to increase the volume, depth and power of journalism connected to Western water issues. We’re an initiative of the Center for Environmental Journalism at the University of Colorado Boulder. The Water Desk launched in April 2019 with support from the Walton Family Foundation. We maintain a strict editorial firewall between our funders and our journalism.


