This spring, headlines proclaimed that Colorado was drought-free for the first time since 2017, according to the U.S. Drought Monitor.
The welcomed proclamation came after the state’s waterways and reservoirs swelled thanks to abnormally high snowpack levels, a cooler-than-average spring and an unusually rainy summer. But while the drought monitor is good for identifying overall drought conditions in the short-term––which scientists define as a period of less than six months––it’s not as useful for evaluating long-term trends.
The term drought implies a temporary state––precipitation will eventually return to normal; reservoirs will recharge; streams will continue to flow as expected. But some scientists are now using the term aridification to describe the long-term drying out of the West.
The weekly U.S. Drought Monitor map, which is compiled by dozens of scientists at a handful of organizations, is used by researchers, water managers, farmers and others for short-term planning. It provides a snapshot of drought conditions by comparing historic conditions to current data.
“It’s not a completely mathematical product,” said Becky Bolinger, a climatologist at Colorado State University. “It’s actually a human being who’s looking at all these different things and assessing how bad each of those different indicators are compared to their normal.”
David Miskus, a scientist at the National Oceanic and Atmospheric Administration, prefers the phrase “convergence of evidence” to describe the melange that makes up the Drought Monitor.
He said they use more than 40 indicators, including soil moisture, precipitation, streamflow and other observational data from a network of over 400 individuals. Once compiled, researchers determine a region’s drought intensity, which is delineated on the weekly map through a color-coded system.
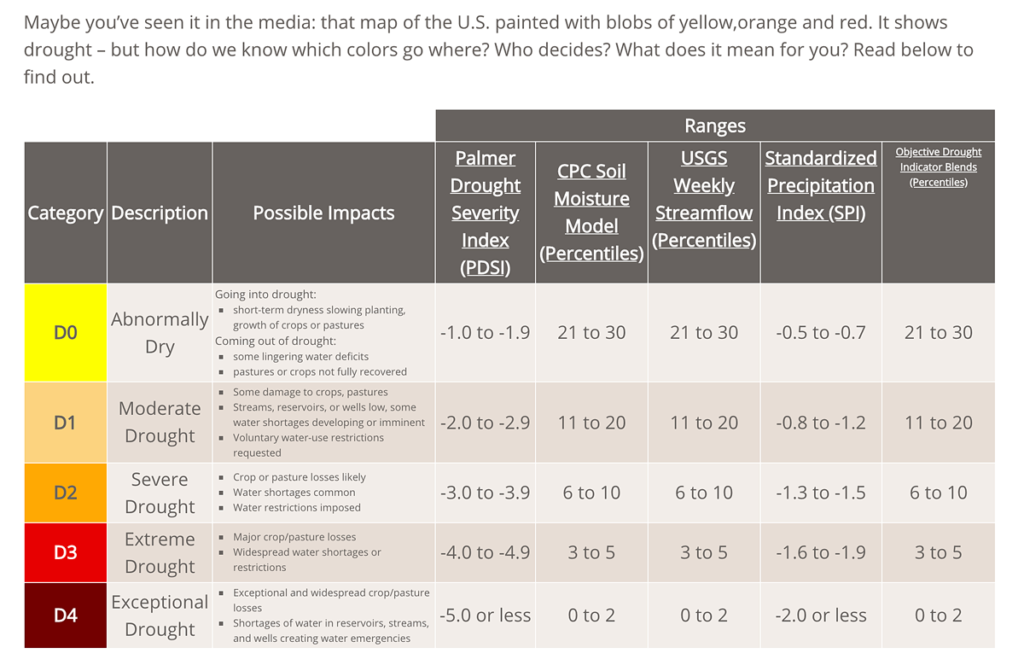
Source: U.S. Drought Monitor
“We try to keep it simple, because believe me, this is a very complex procedure,” Miskus said of putting the Drought Monitor together every week. “We take a lot of evidence into account, both the data and the impacts that are out there.”
Making things more complicated is the fact that there are four different types of drought: hydrologic, meteorologic, agricultural and socioeconomic.
There are four different types of drought: hydrologic, meteorologic, agricultural and socioeconomic.
For example, when media outlets report that the Colorado River basin is experiencing a 20-year drought, what they are referring to is hydrologic drought – defined by shortages in streamflows and reservoir levels. However, some may confuse that with meteorological drought, which is an overall decrease in precipitation.
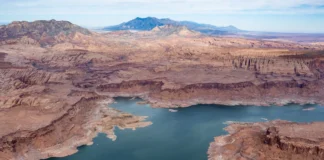
During the prior drought, the Four Corners region and Southwest Colorado were experiencing exceptionally dry conditions, which abated due to a wet winter only to start creeping back this summer. The hydrologic drought, however, remained in place, which is not evident from looking at the Drought Monitor, but which is obvious at Lake Powell. The reservoir created by Glen Canyon Dam was 56 percent of full capacity at the end of August.
“We’re still in a drier climate and we still need to be aware of the water we use,” Bollinger said. “We still need to be aware that there are issues with the future of our water long-term in the Colorado River Basin, which affects all of the southwestern states.”
Explore our dashboard with weekly reports from the U.S. Drought monitor dating back to 2000:


