April 1, the midpoint in the water year, is an important milestone for scientists, water managers, and others who track the American West’s snowpack.
Each watershed has its own typical peak date for the snowpack, but in many places, April 1 has been a traditional moment for taking stock of how the spring snowpack is stacking up.
Accordingly, I’ve collected a variety of maps and charts below that illustrate the state of play on April 1.
Snowmelt accounts for the majority of the flow in many Western rivers, so the current status of the snowpack has major implications for the runoff that will supply downstream ecosystems, agriculture, and communities.
That said, the weather over the next couple of months will play a crucial role in the story of this year’s snowpack. There’s still plenty of time for more flakes to fall in the high country—snow is in the forecast for the next few days—while warm, sunny, and dry conditions could accelerate the meltout.
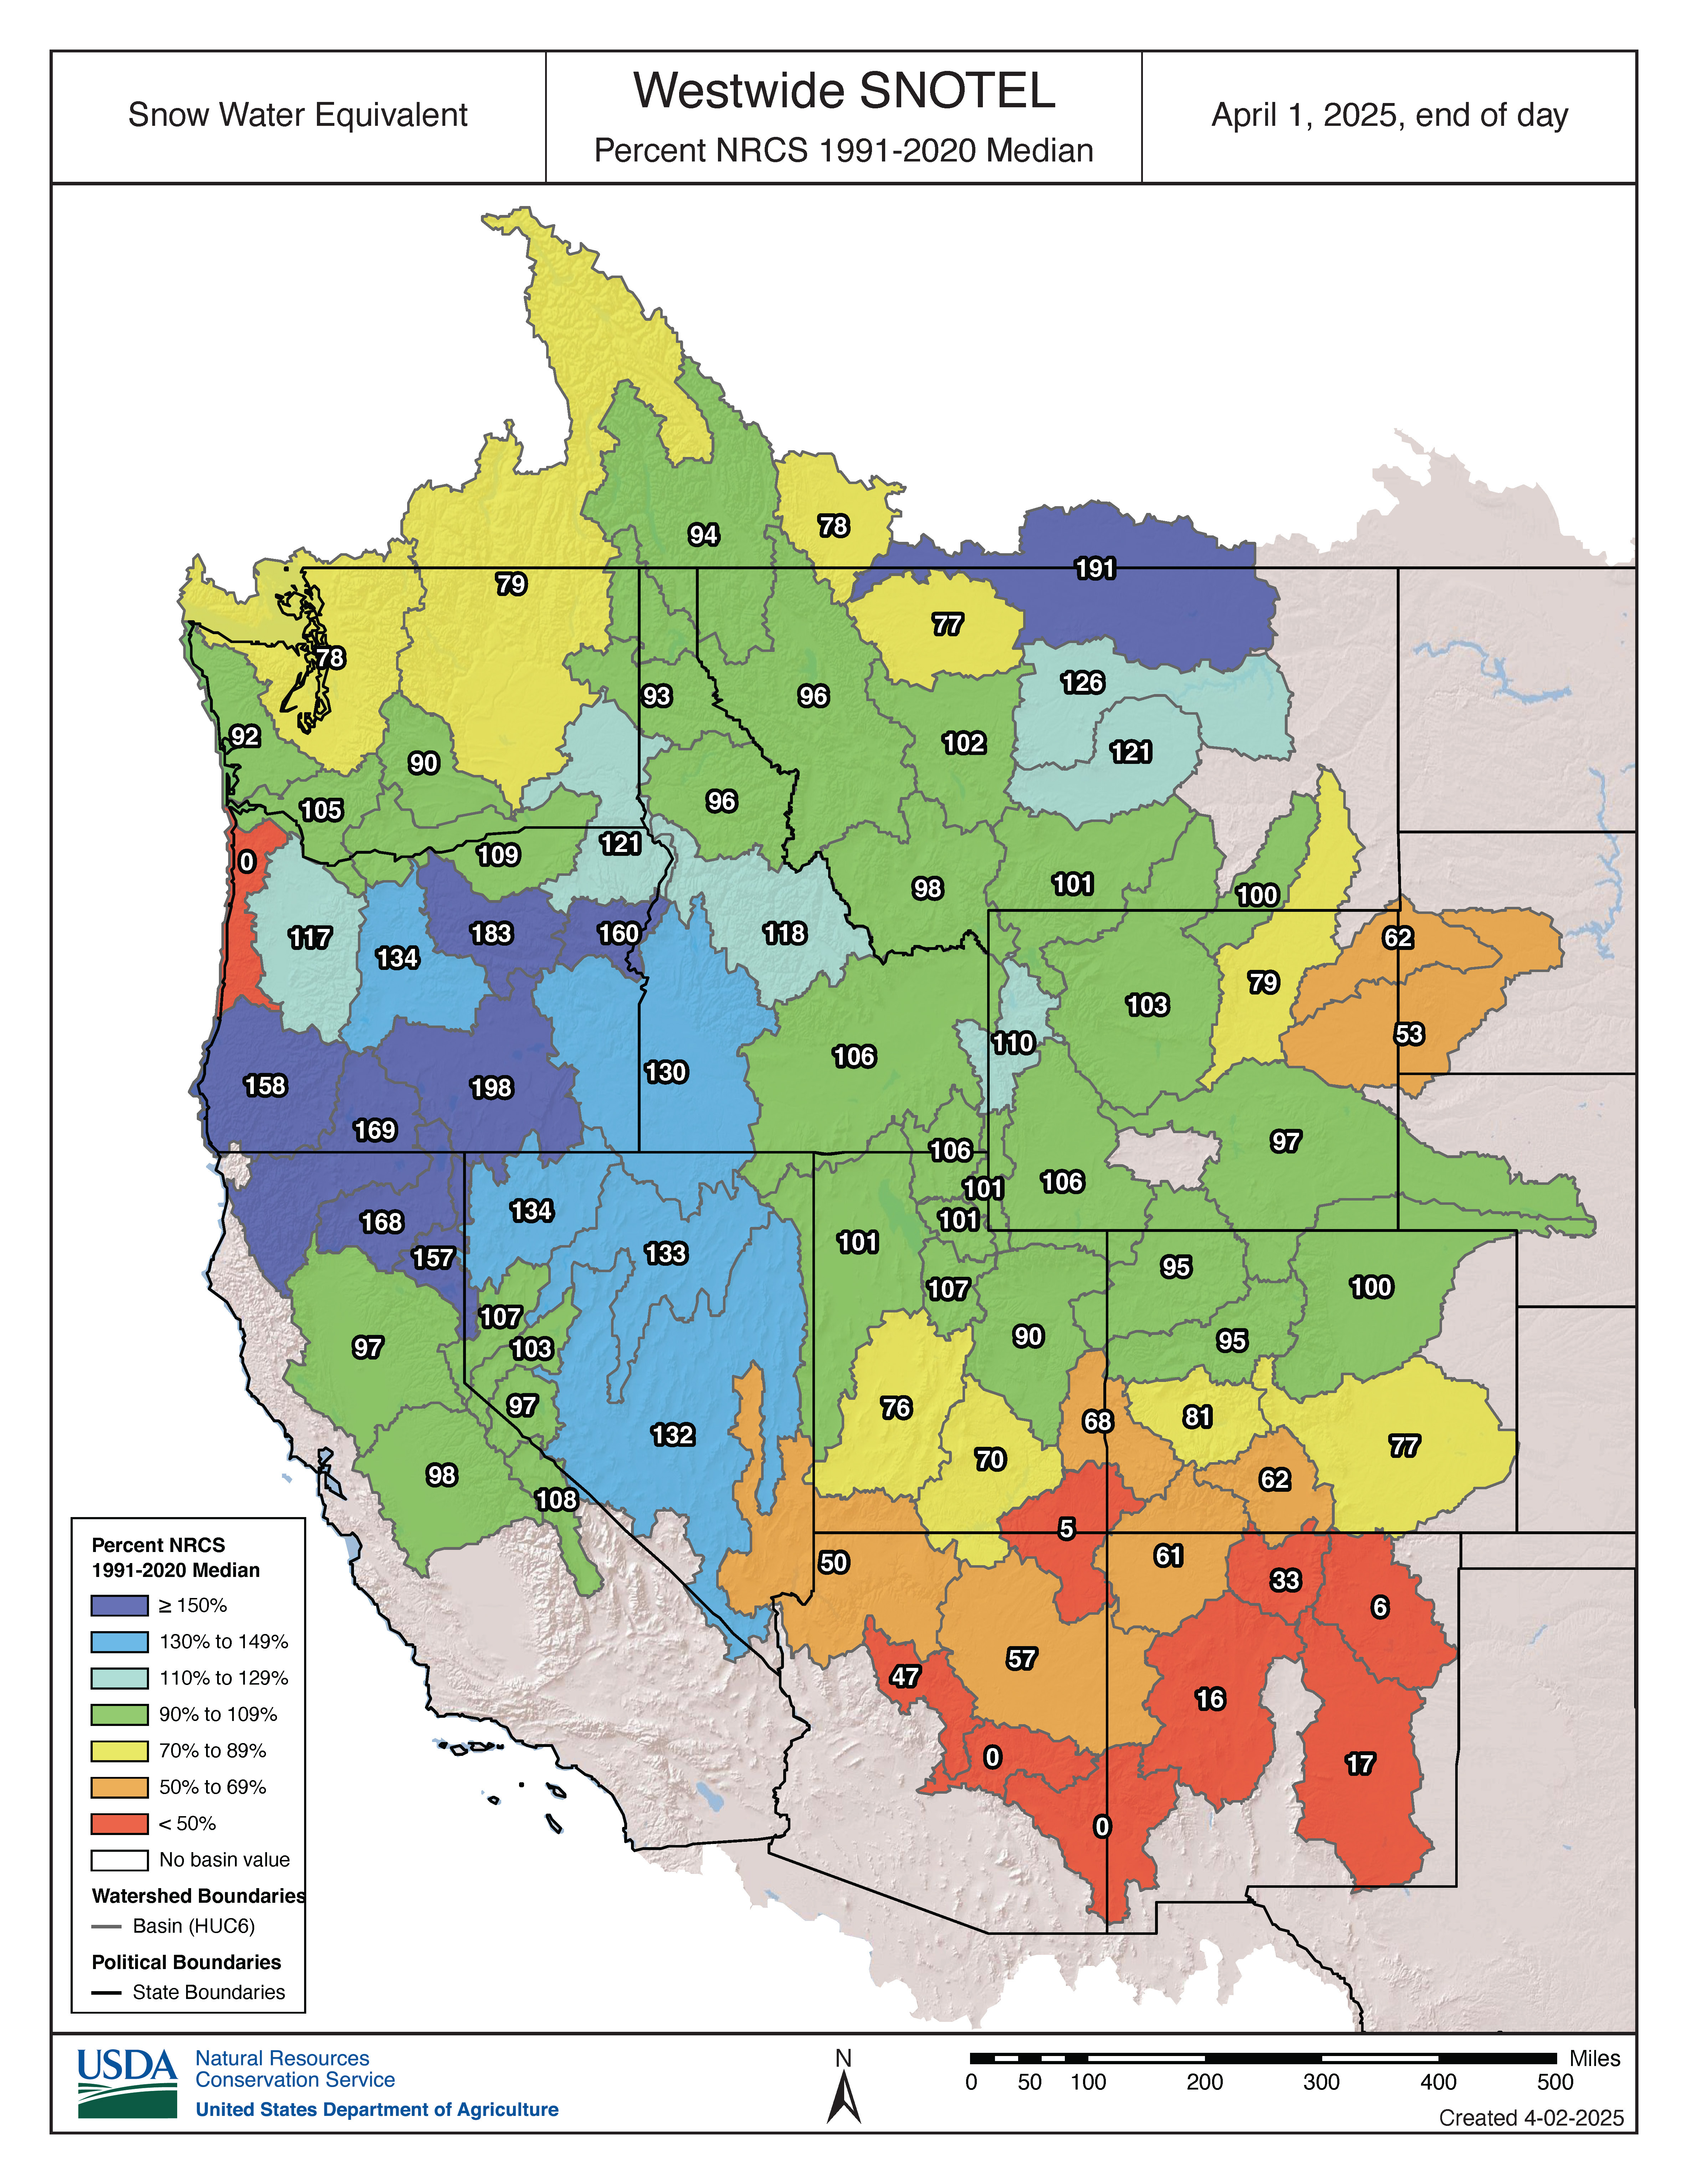
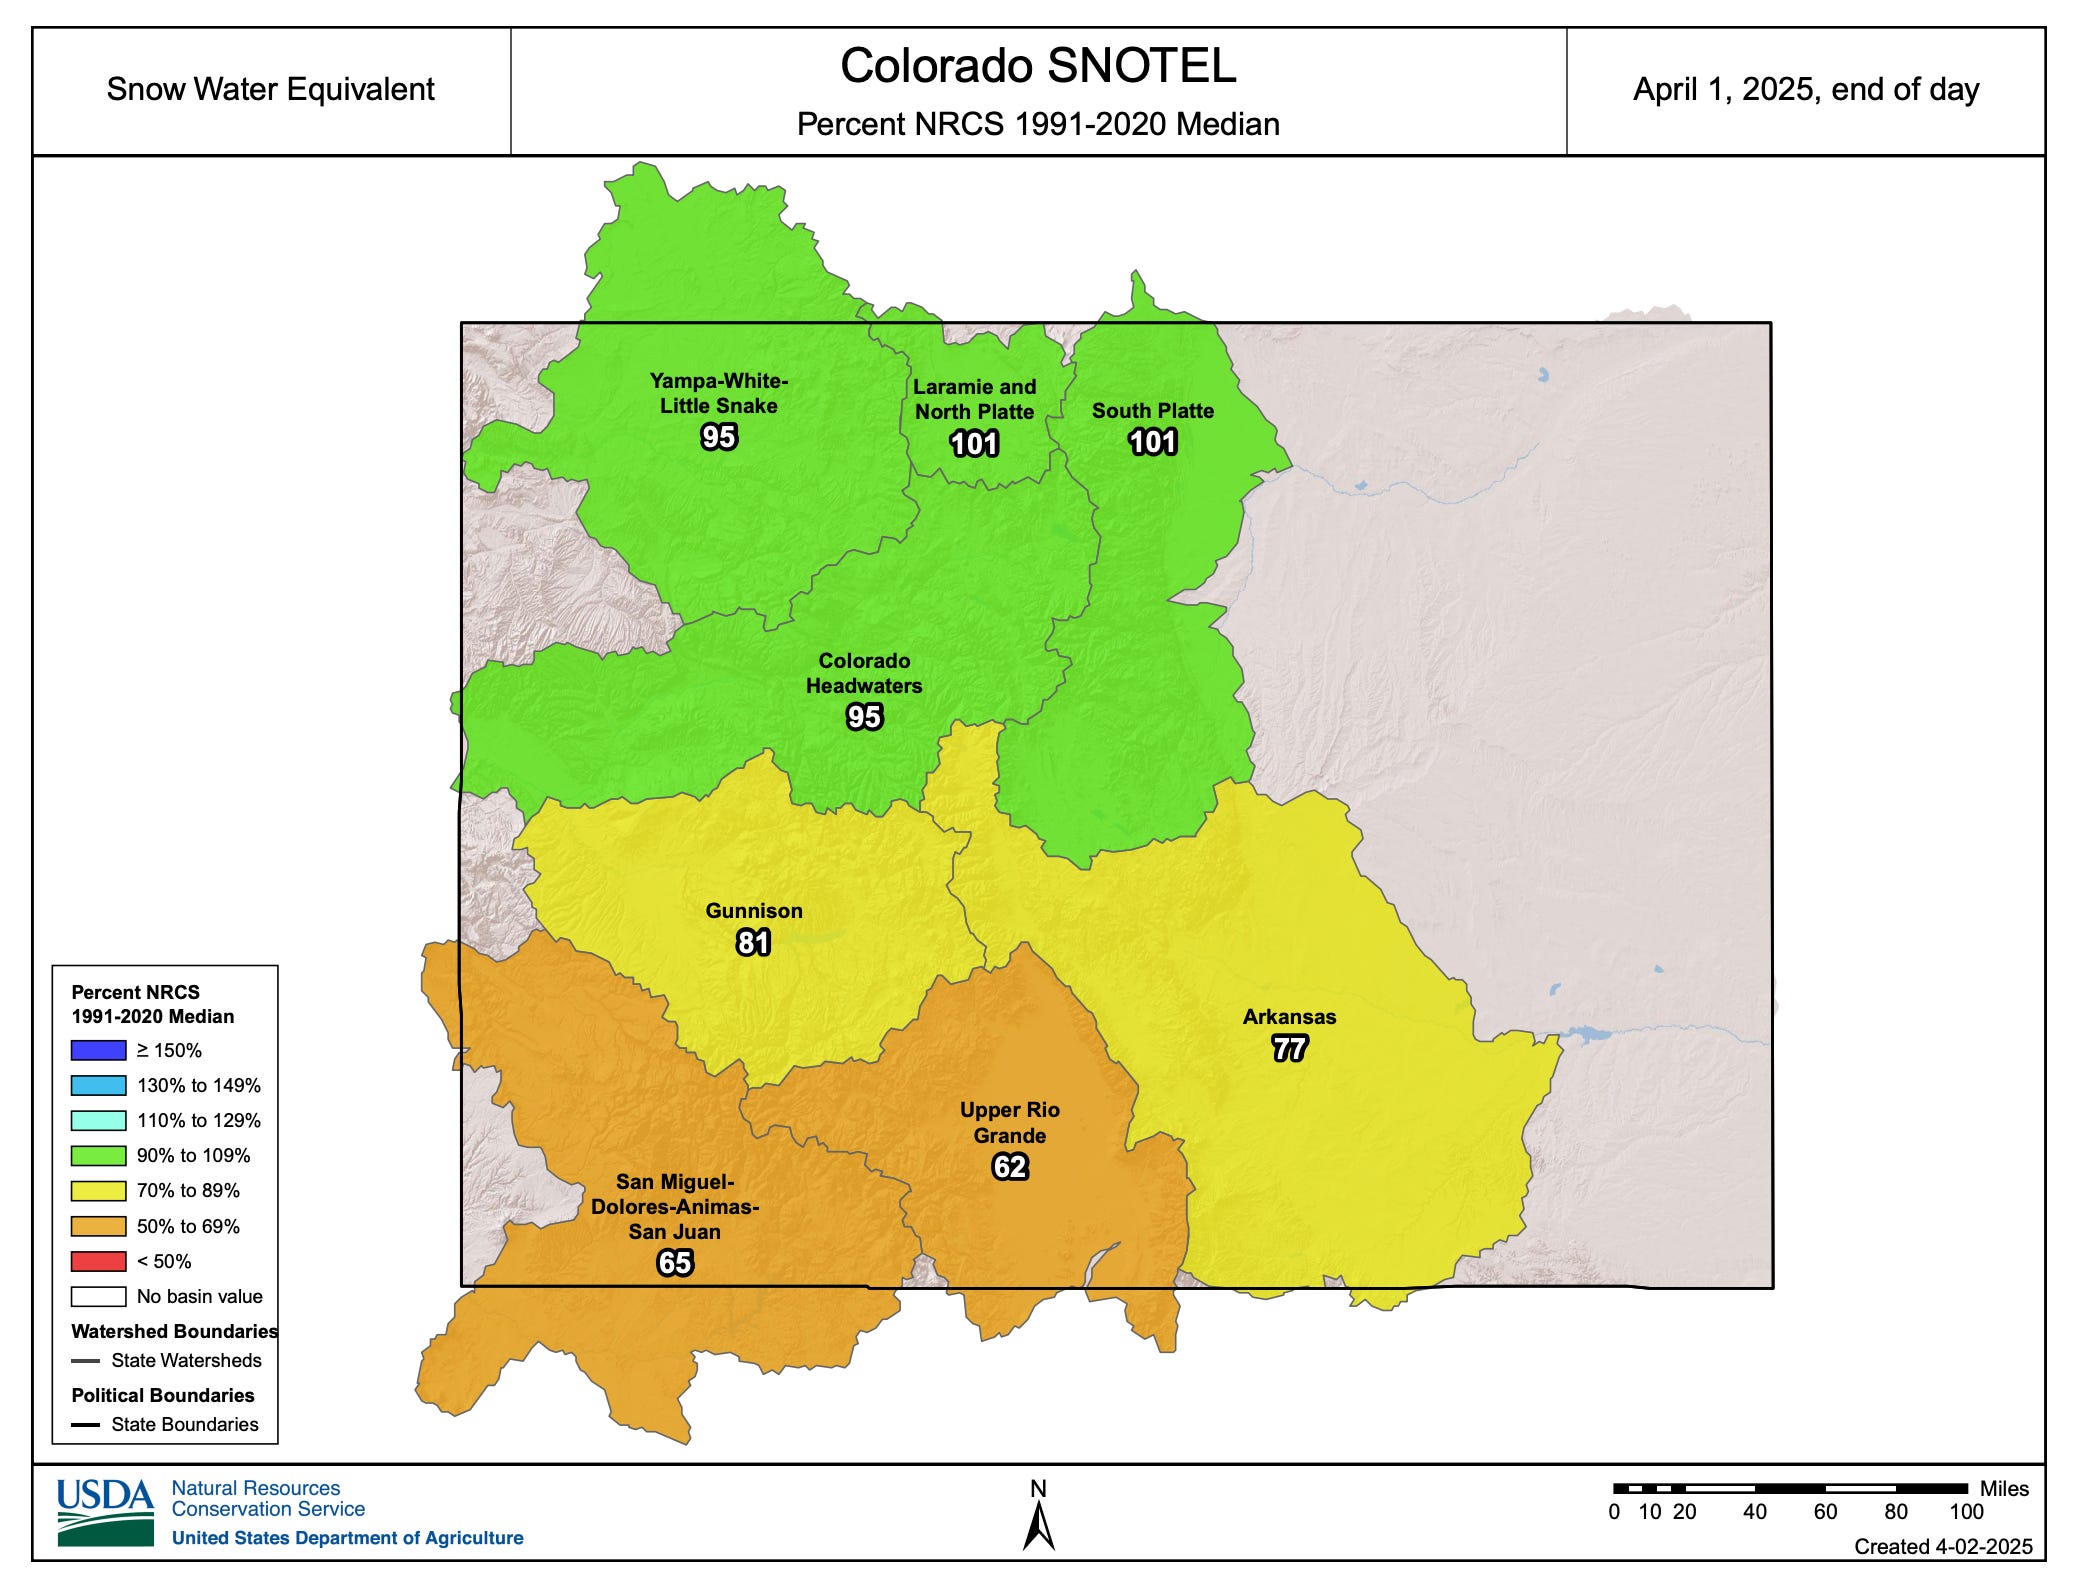
The map I shared at the top of this post shows a summary of conditions across the West, and it paints a variegated portrait. All of those green areas are close to the 30-year median, but there are also basins with less than 50% of normal (red) or more than 150% of the median (deep blue).
Last year around this time, I did a similar update on the April 1 snowpack and included the graphic below, showing conditions for the last three seasons:

The map below shows precipitation since October 1. As with the snowpack, the Southwest has suffered while portions of Northern California, Oregon, Nevada, and Montana have done well.
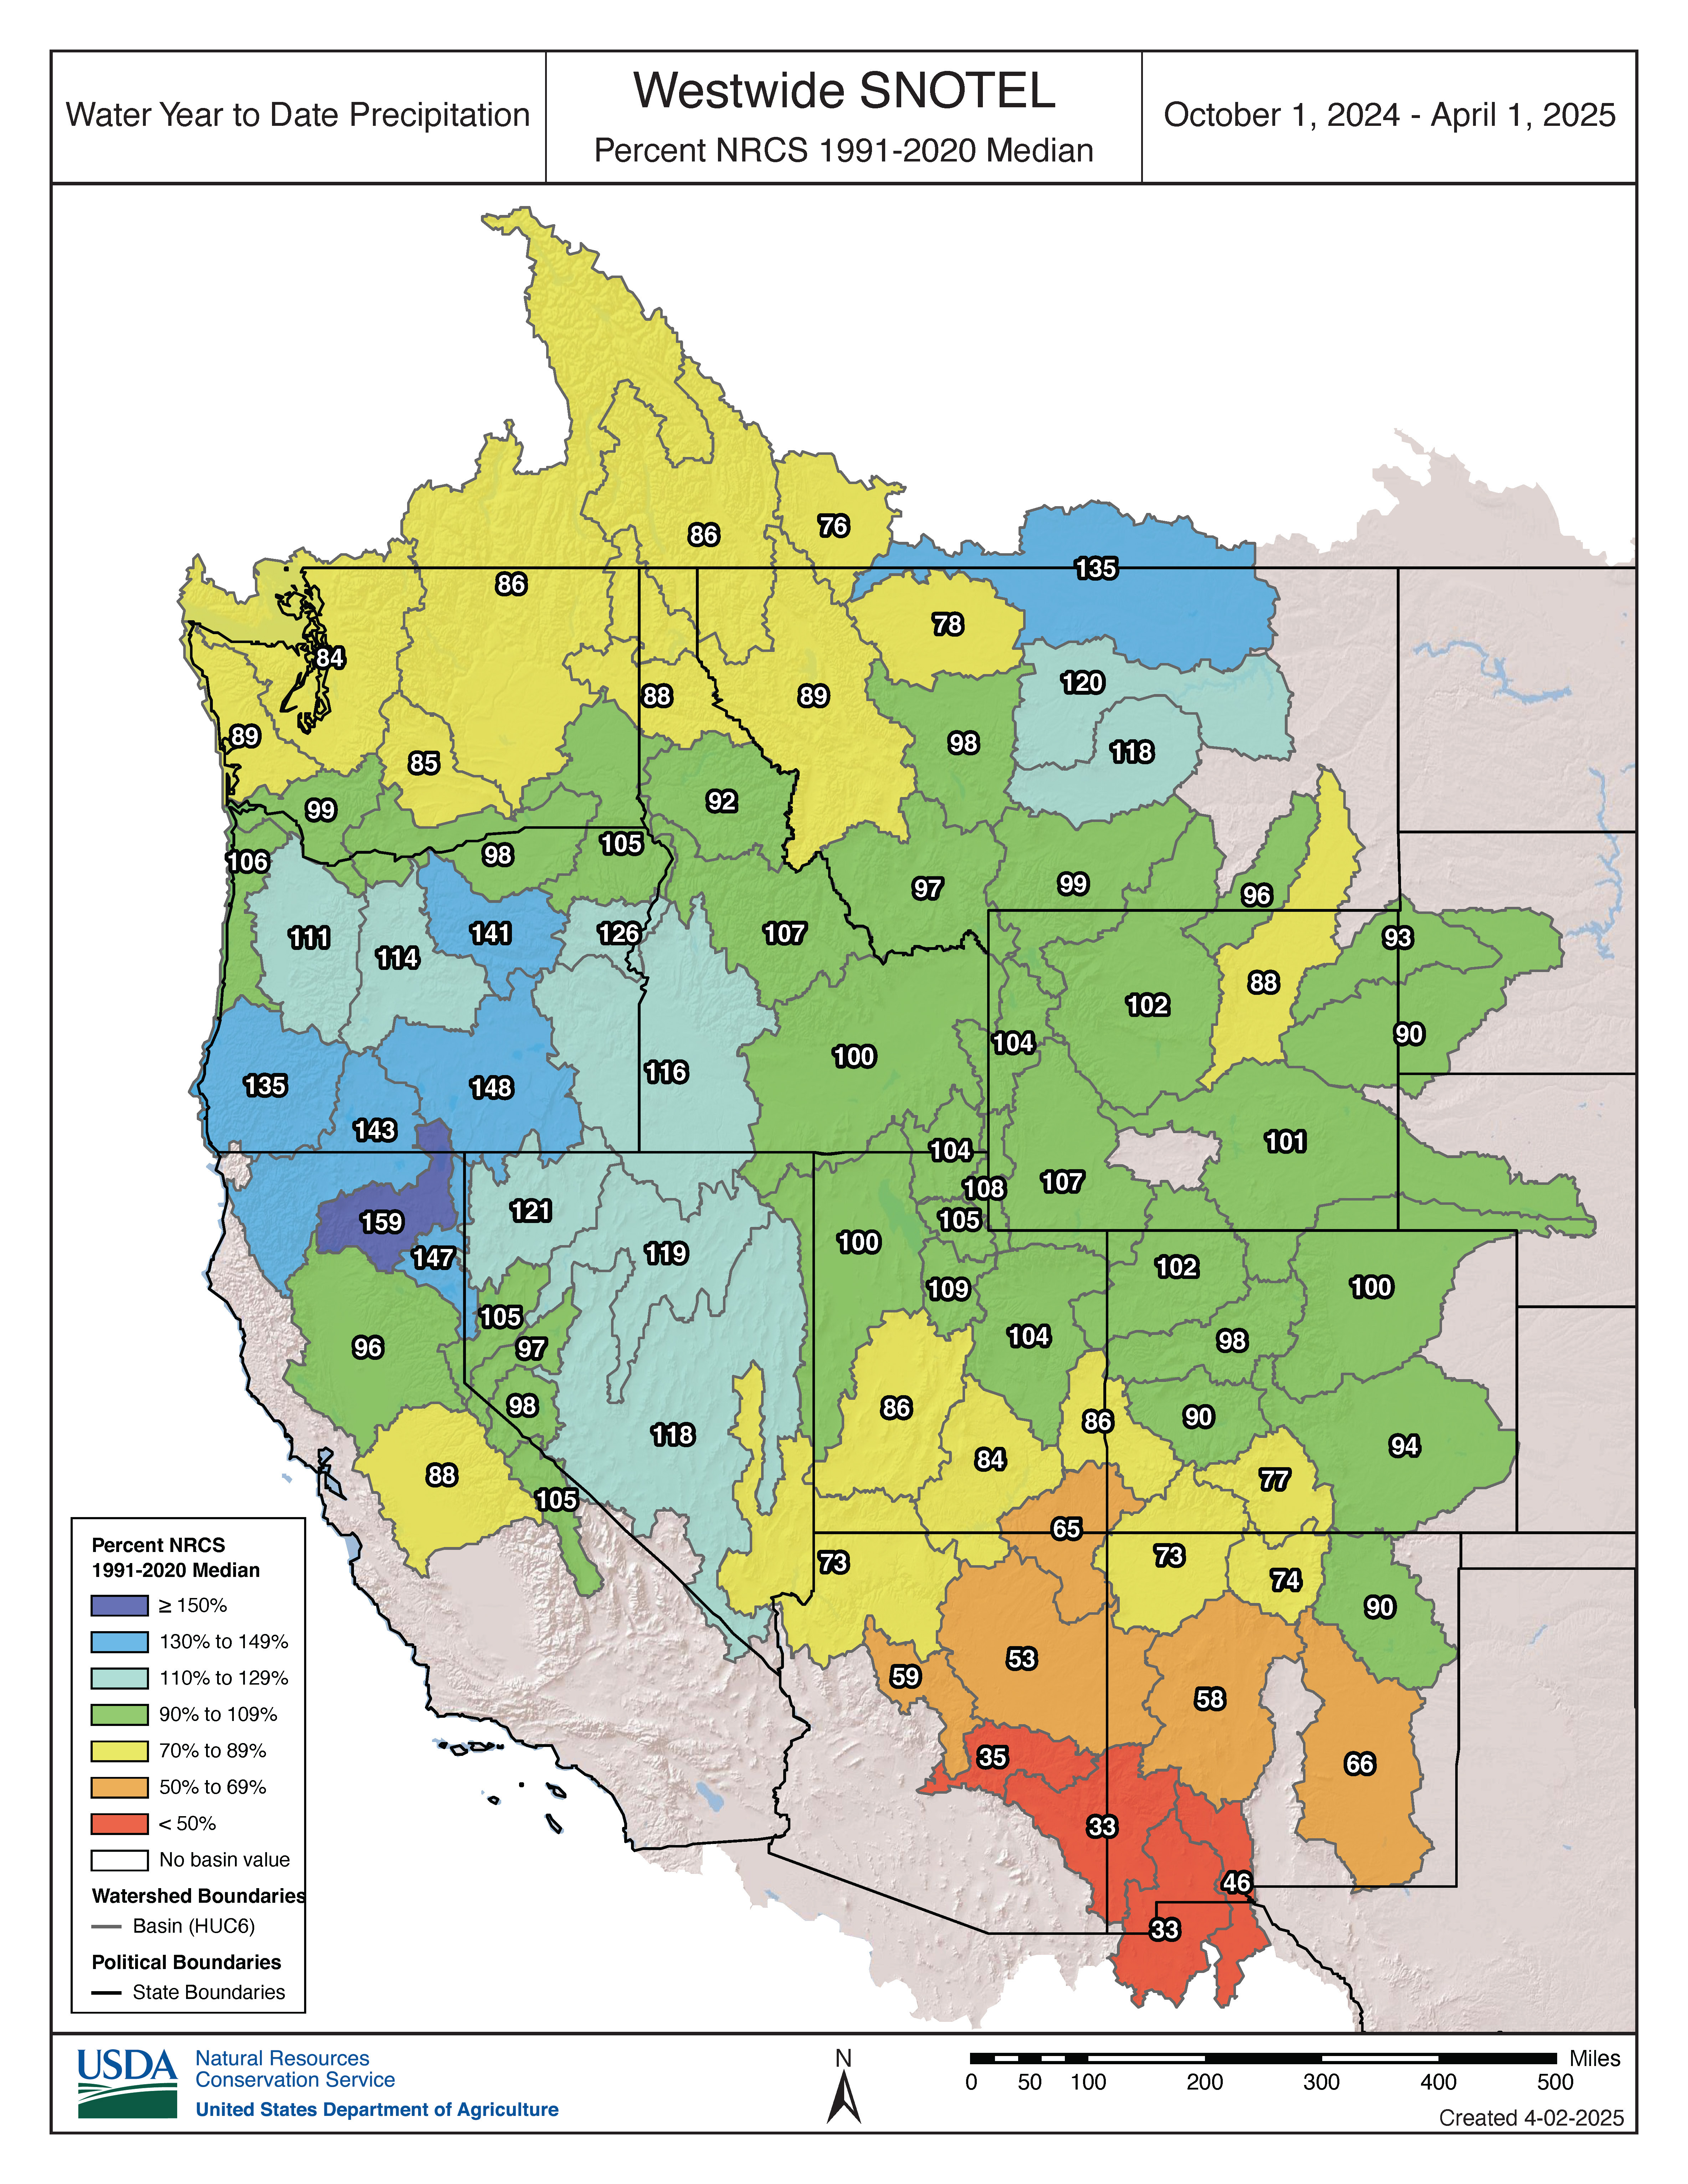
Overall, this season’s precipitation patterns “bore the telltale signs of a La Niña influence,” according to a recent post on NOAA’s ENSO blog:
“In particular, most of the southern U.S. and northern Mexico were predicted to be and turned out to be drier than average, with record-dry conditions in southern Arizona and parts of New Mexico. Wetter conditions were forecasted and did prevail over the northern part of the continent, particularly in Alaska and parts of the Pacific Northwest, as well as much farther south in Central America.”
Drilling down to the level of individual states, I looked through a slew of graphics and found a lot of places around average and not worth writing about. But below are a few different types of visualizations from the Natural Resources Conservation Service that caught my eye.
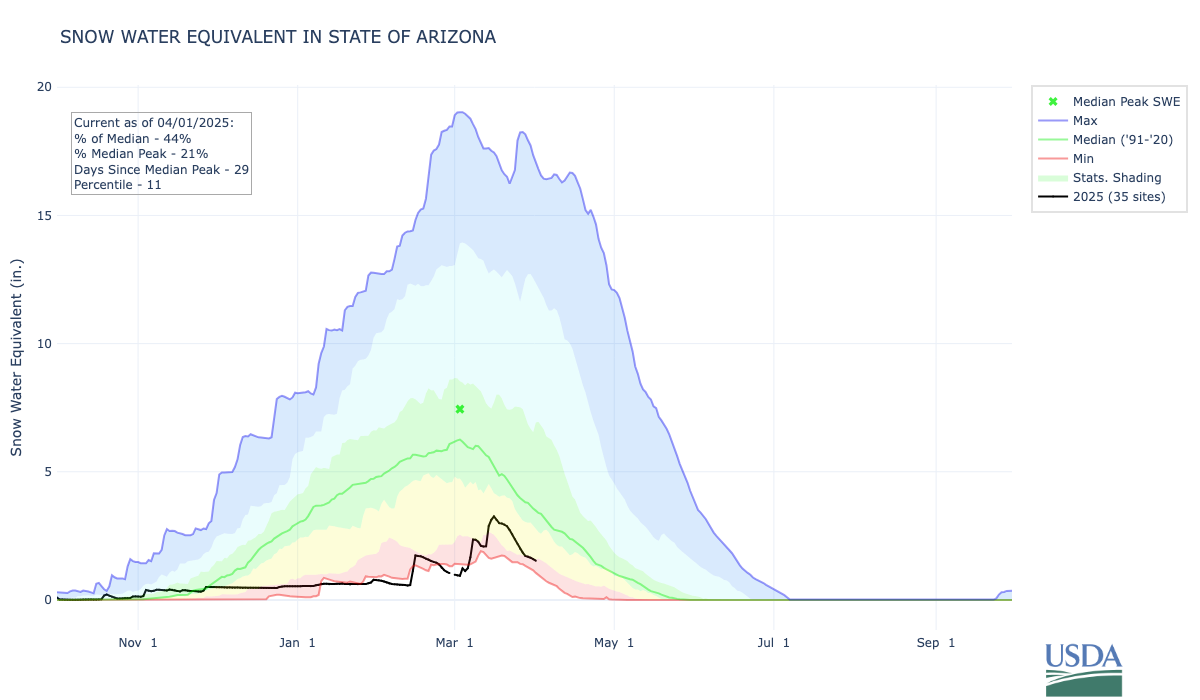
After a dreadful season, March storms were a blessing in Arizona, causing the black line in the chart below to spike upward, but the statewide snowpack was just 44% of the median (green line) on April 1.
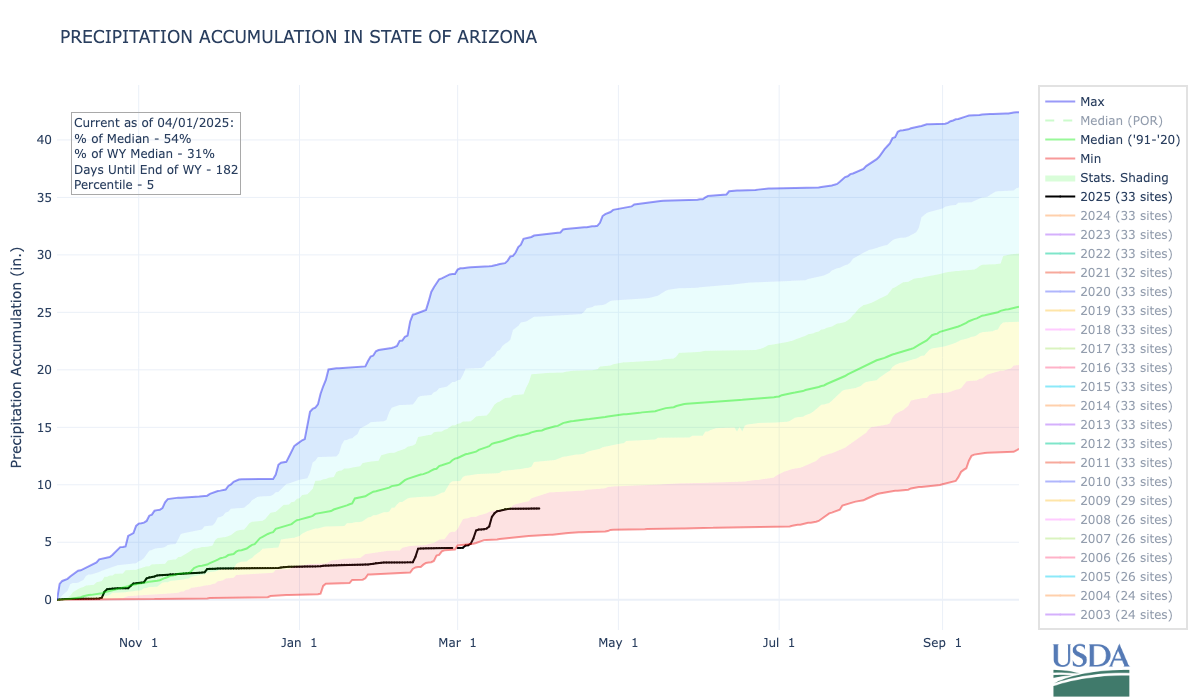
Shifting from snowpack to overall precipitation, Arizona was at the 5th percentile on April 1 with just 54% of the long-term median.
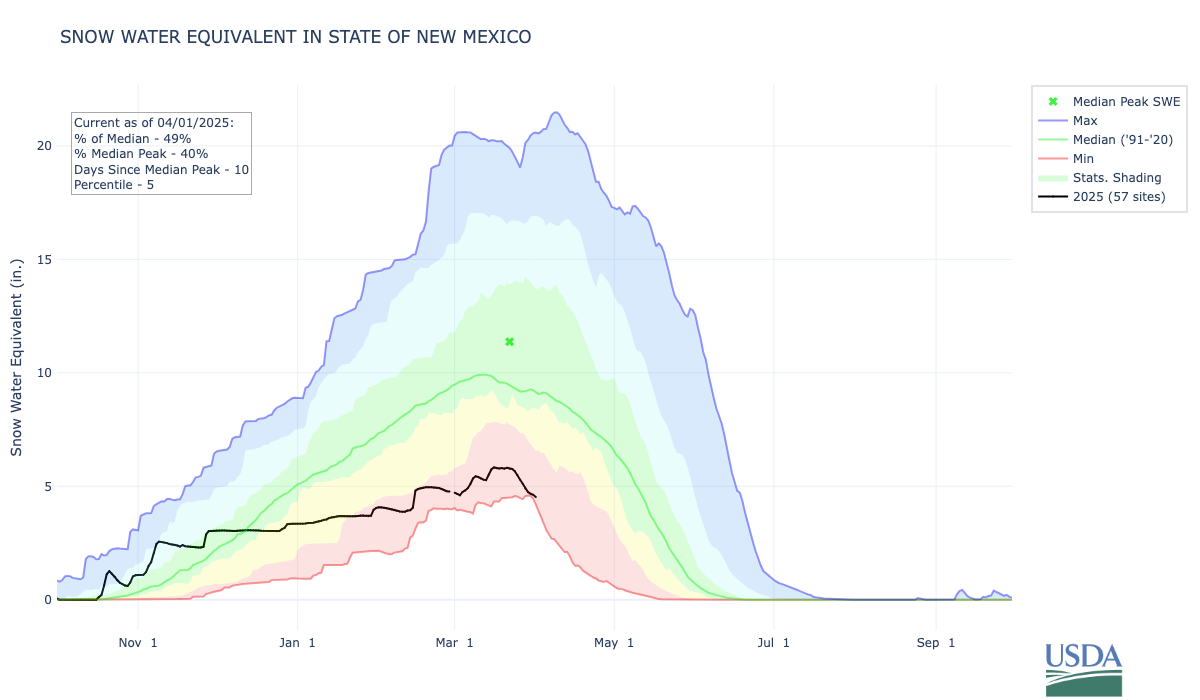
In New Mexico, the meltout is underway after a dismal winter, with the statewide snowpack on April 1 at just the 5th percentile and 49% of the median.
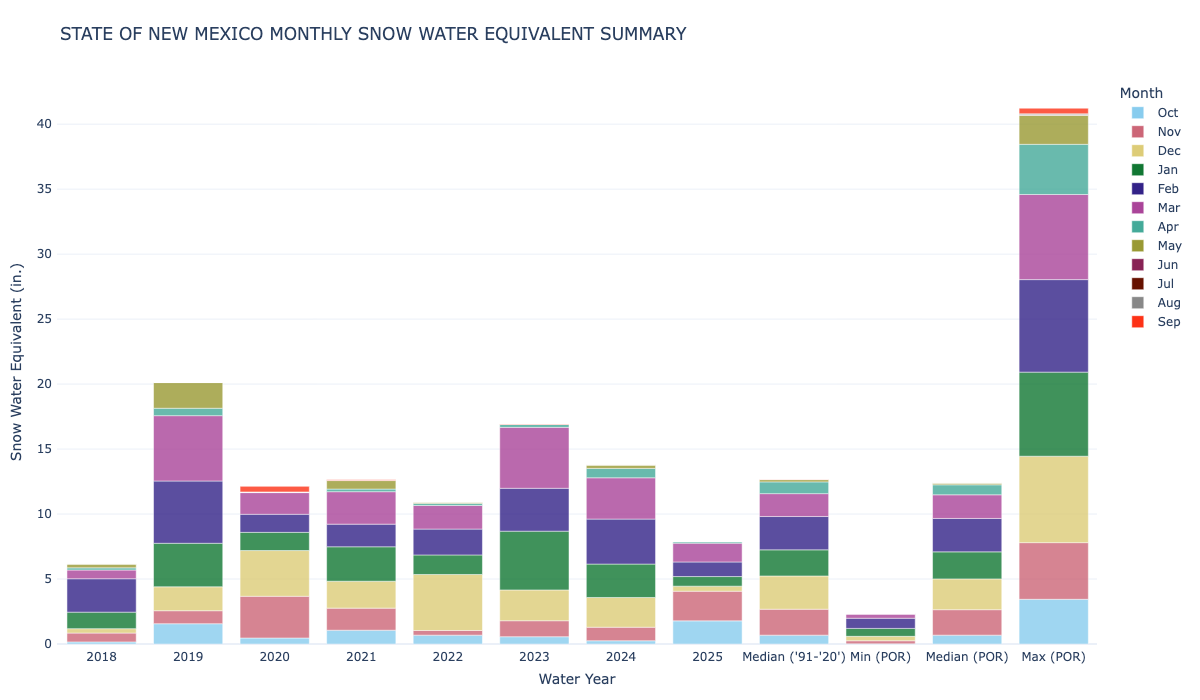
The chart below, which visualizes the snowpack’s growth by month, shows that 2025 is New Mexico’s worst year for snow since 2018.
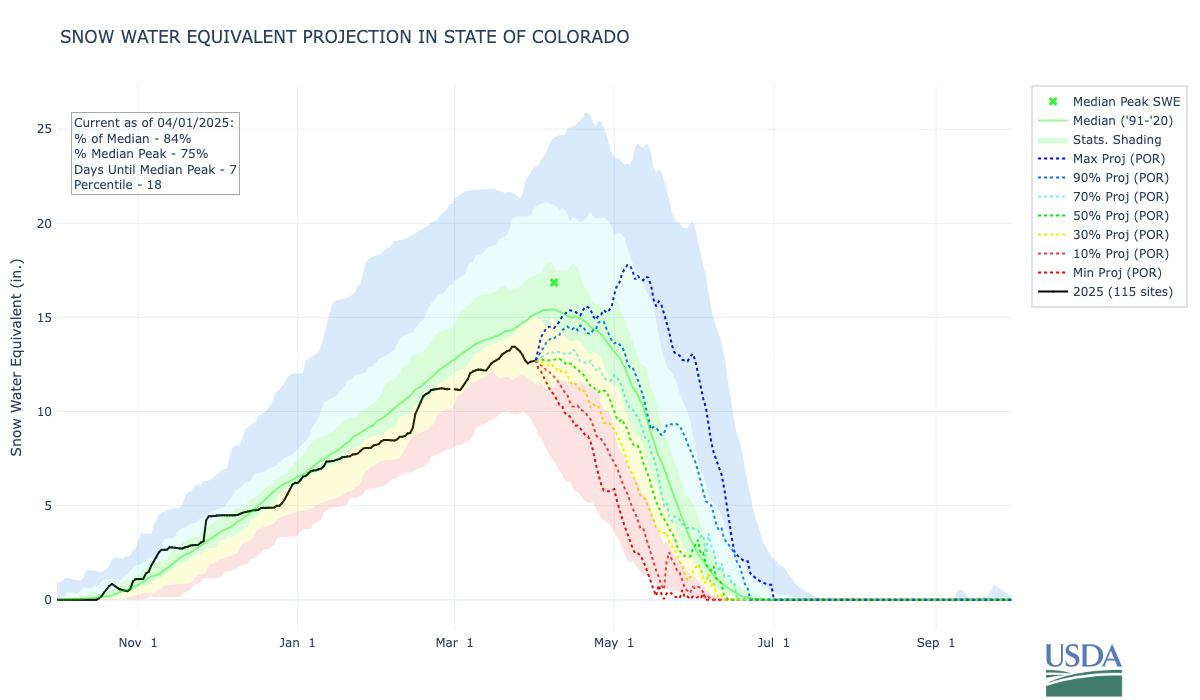
In Colorado, which supplies water to 19 states downstream, conditions in the northern portion of the state are near normal, but in the south, it’s a different story: the Arkansas, Upper Rio Grande, Gunnison, San Miguel, Dolores, and San Juan basins are all struggling.
The skimpy snowpack in southern Colorado has pulled the statewide snowpack into below-normal territory. In the chart below, the dotted lines indicate possible trajectories for the rest of the season—a reminder that spring weather remains a wildcard.
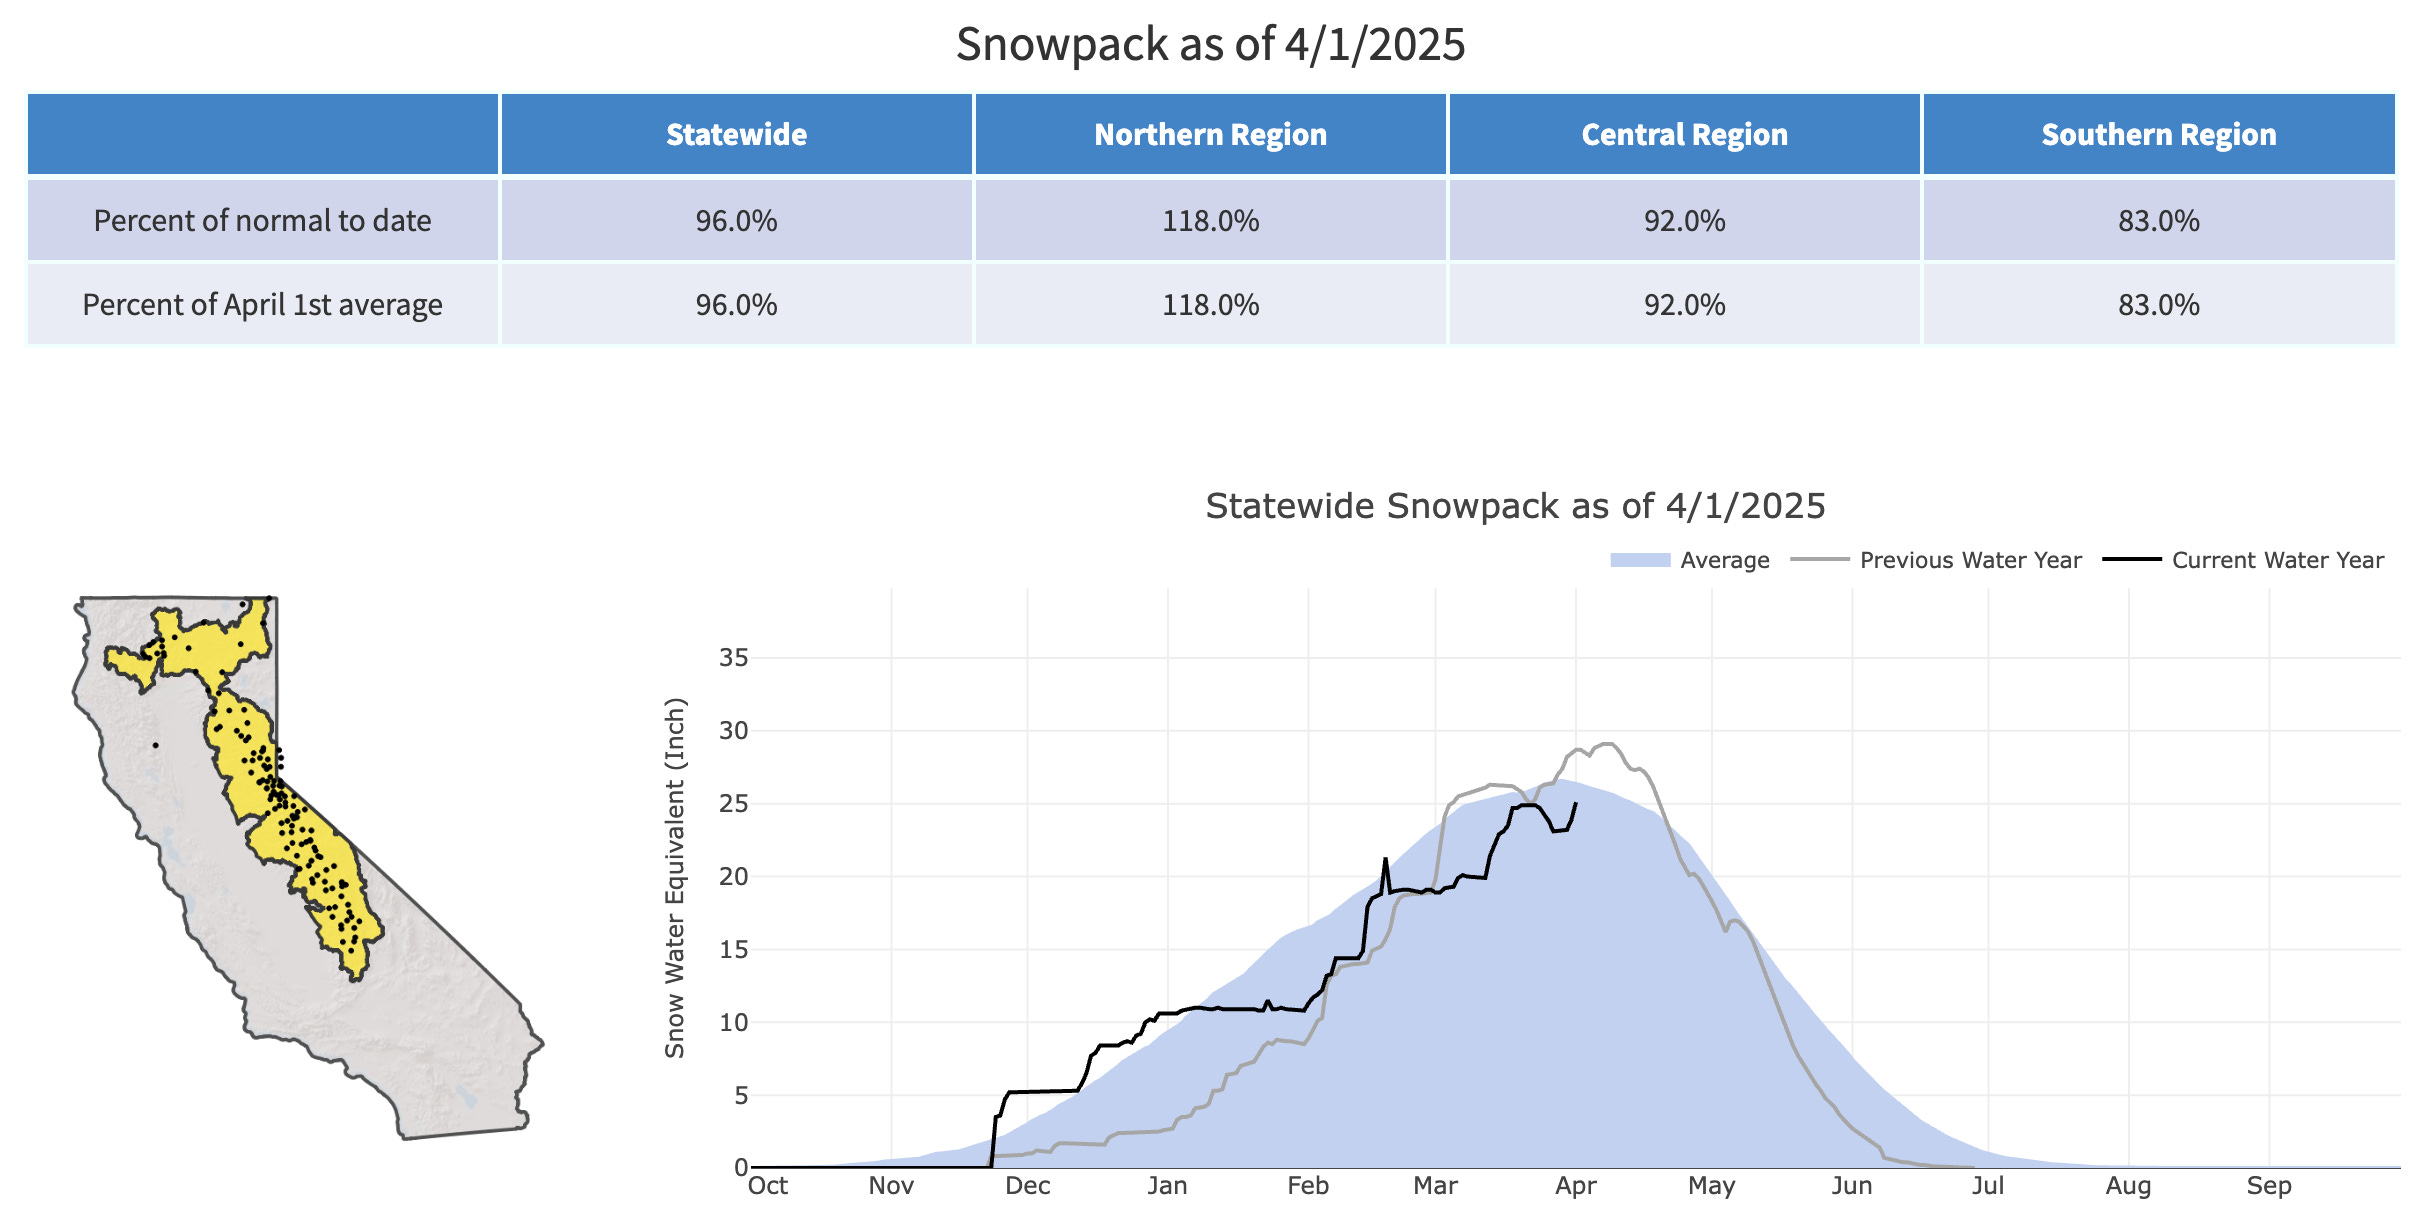
In California, where the state runs its own system for tracking the snowpack, conditions are close to normal, but there’s still the same north-to-south gradient that we’ve seen all season. The statewide snowpack was at 96% of normal on April 1, but the northern region was at 118%, and the southern region was at 83%. This is the third year in a row with near- to above-average snowpack in California—something that hasn’t happened in 25 years.
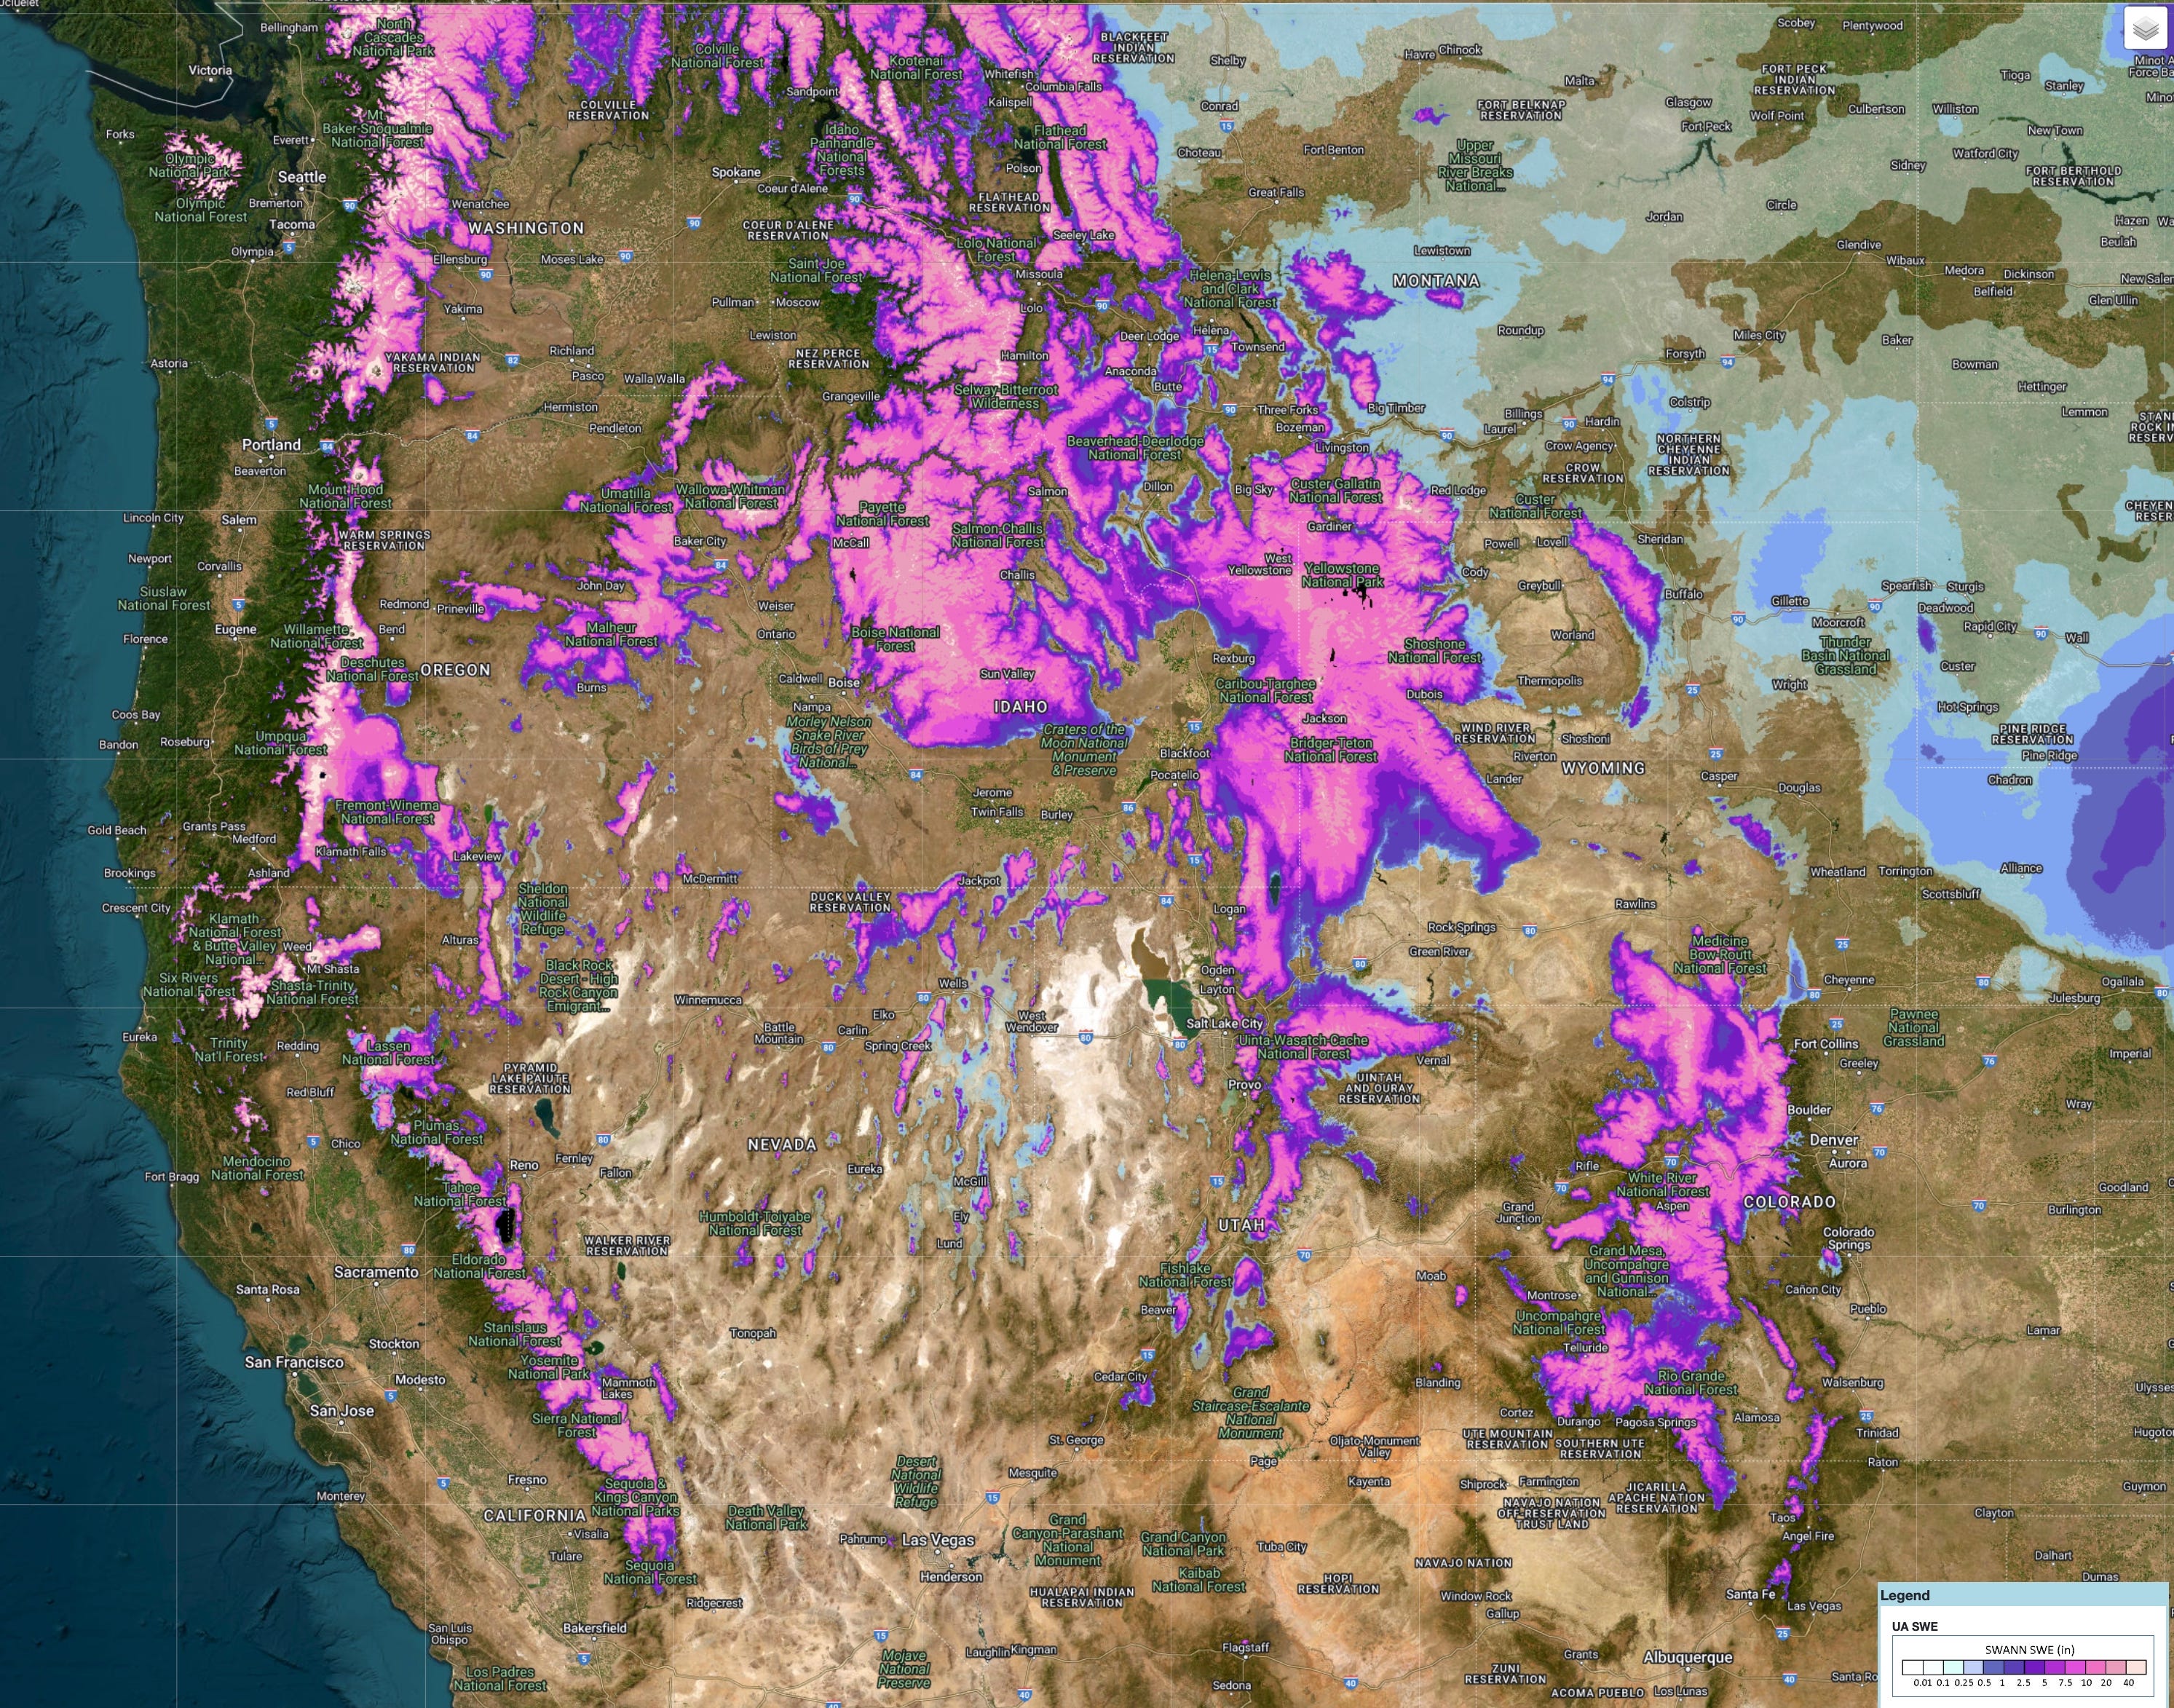
If you’re curious about where there’s still snow on the ground, the two maps below from the University of Arizona’s SnowView interactive show the estimated snow water equivalent across the country and around the West.
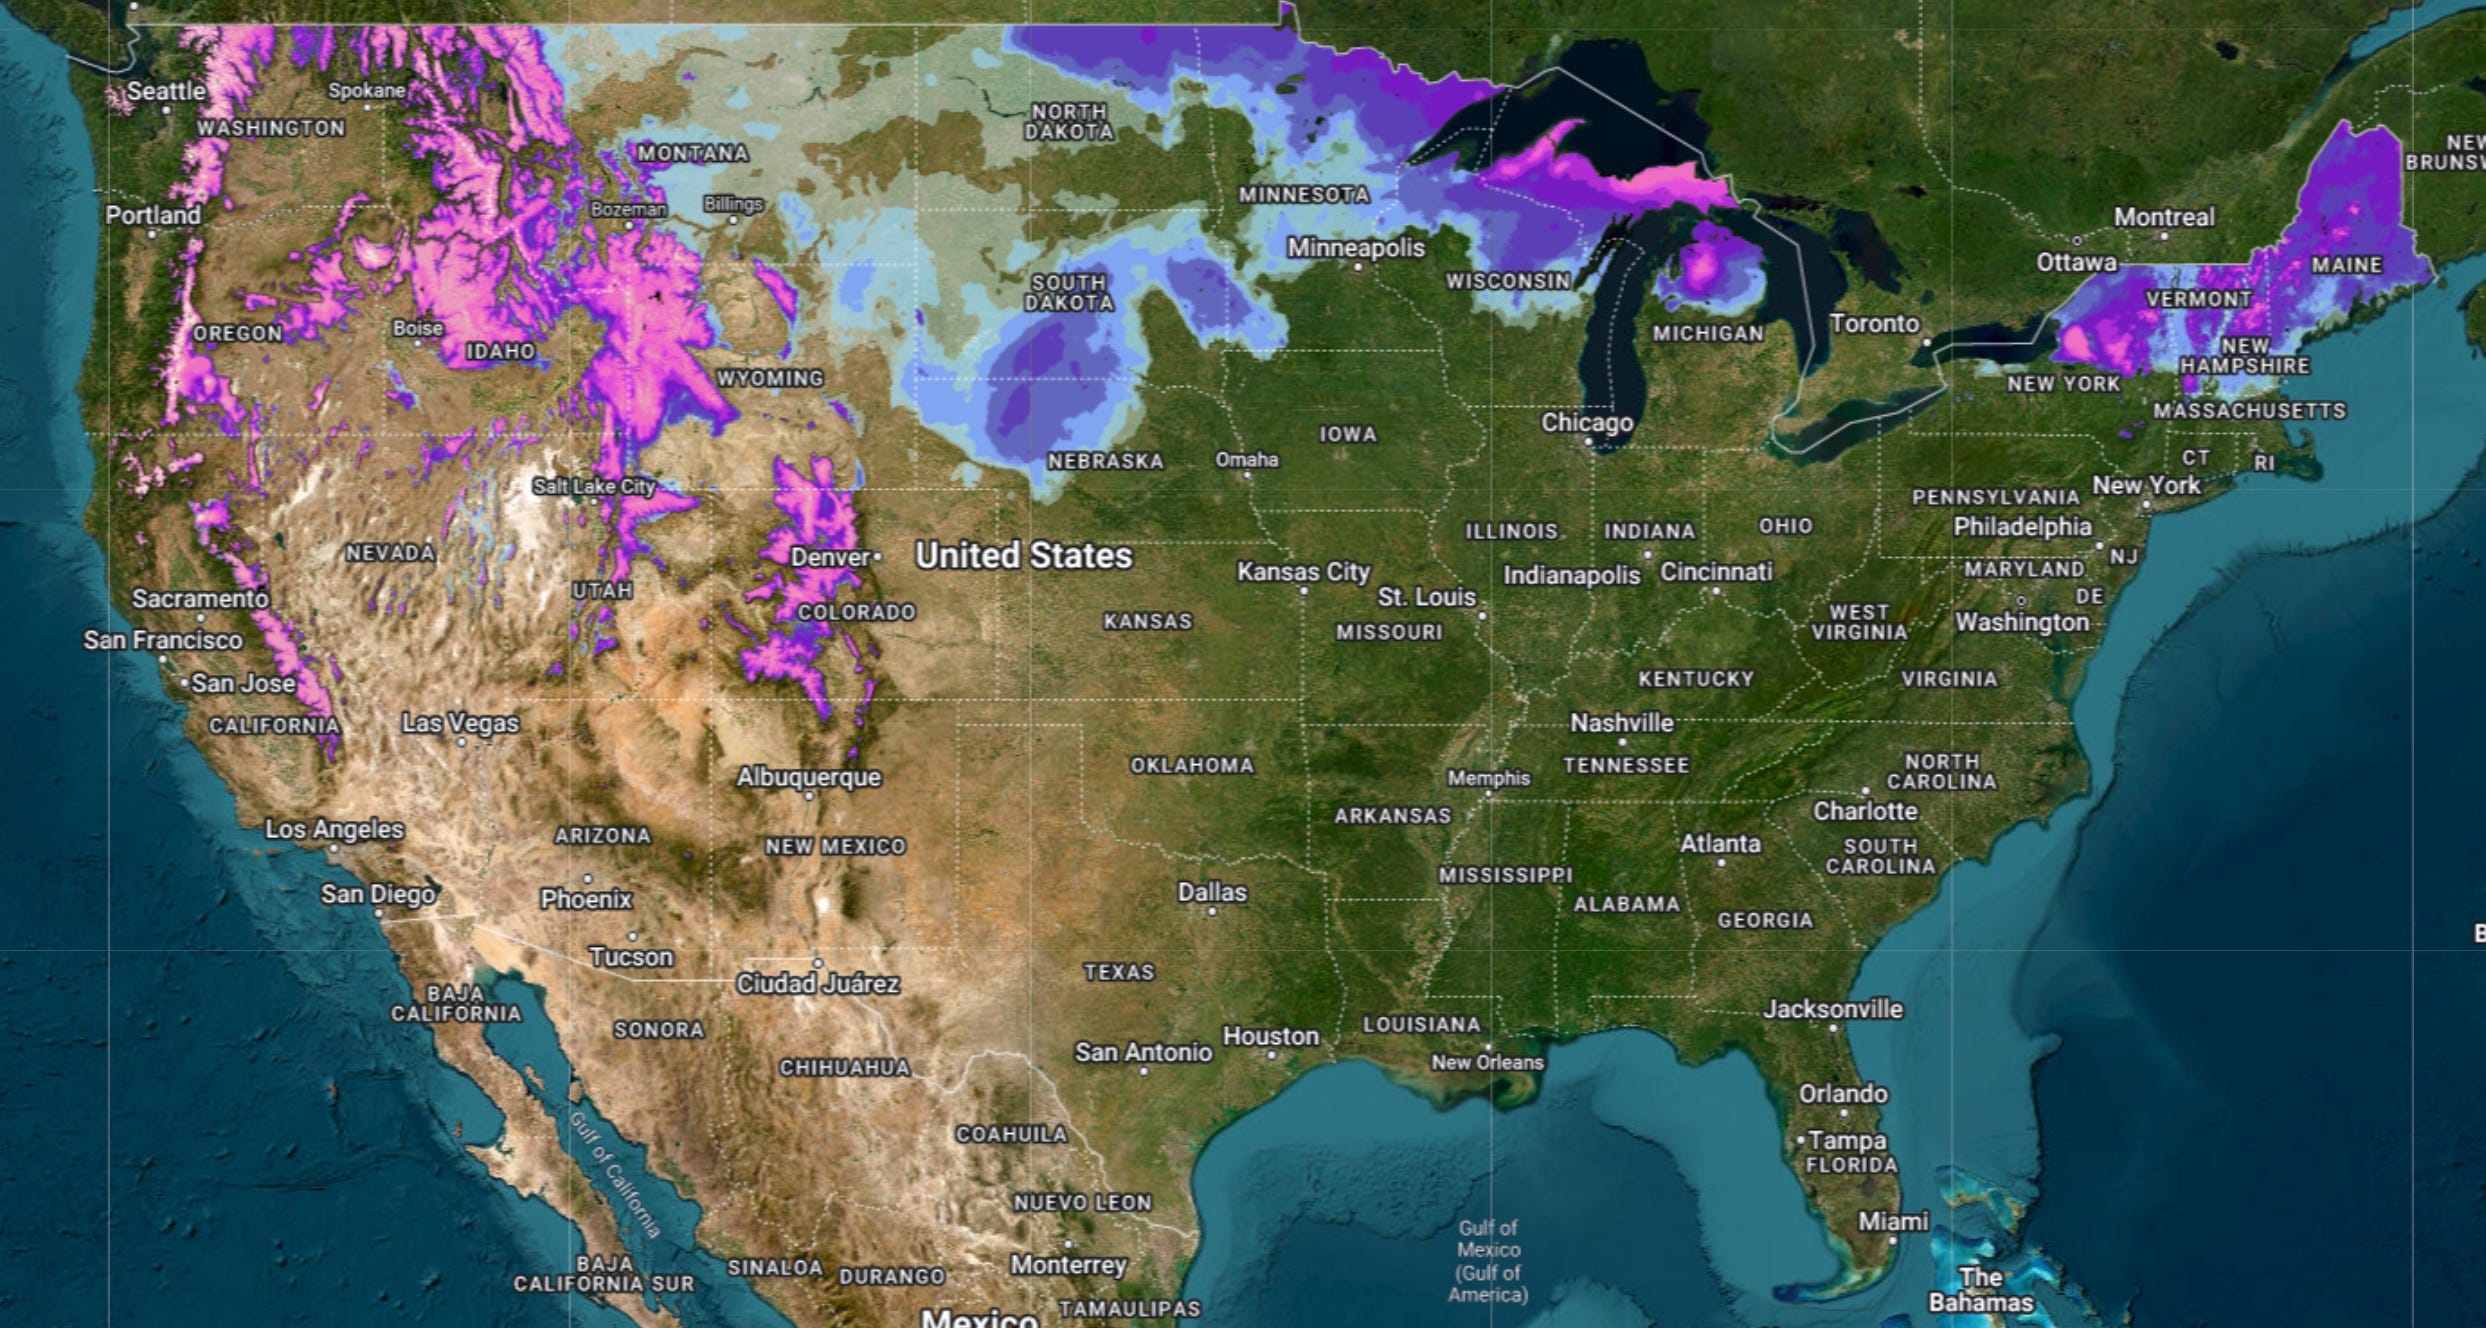
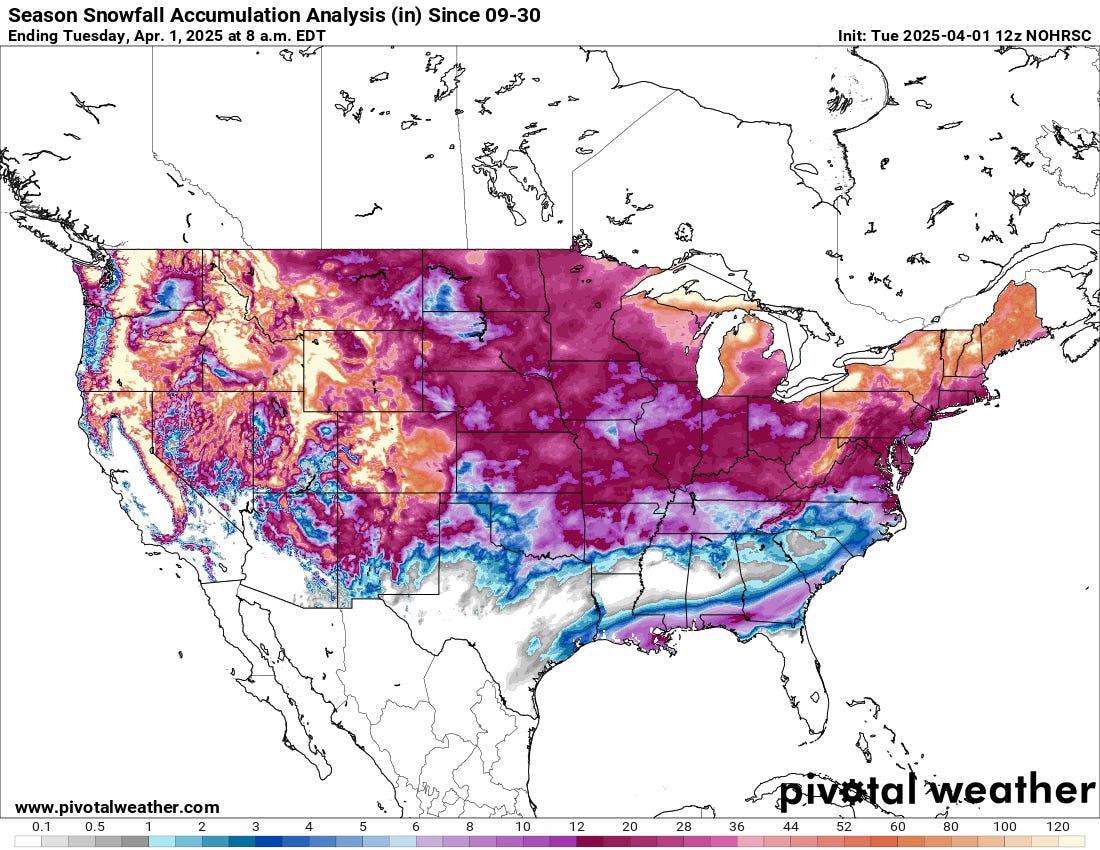
The map below displays snowfall accumulation since the start of the water year on October 1. What stood out for me was the unusual swath of snow that fell across the Southeast in January, including a major winter storm in New Orleans.
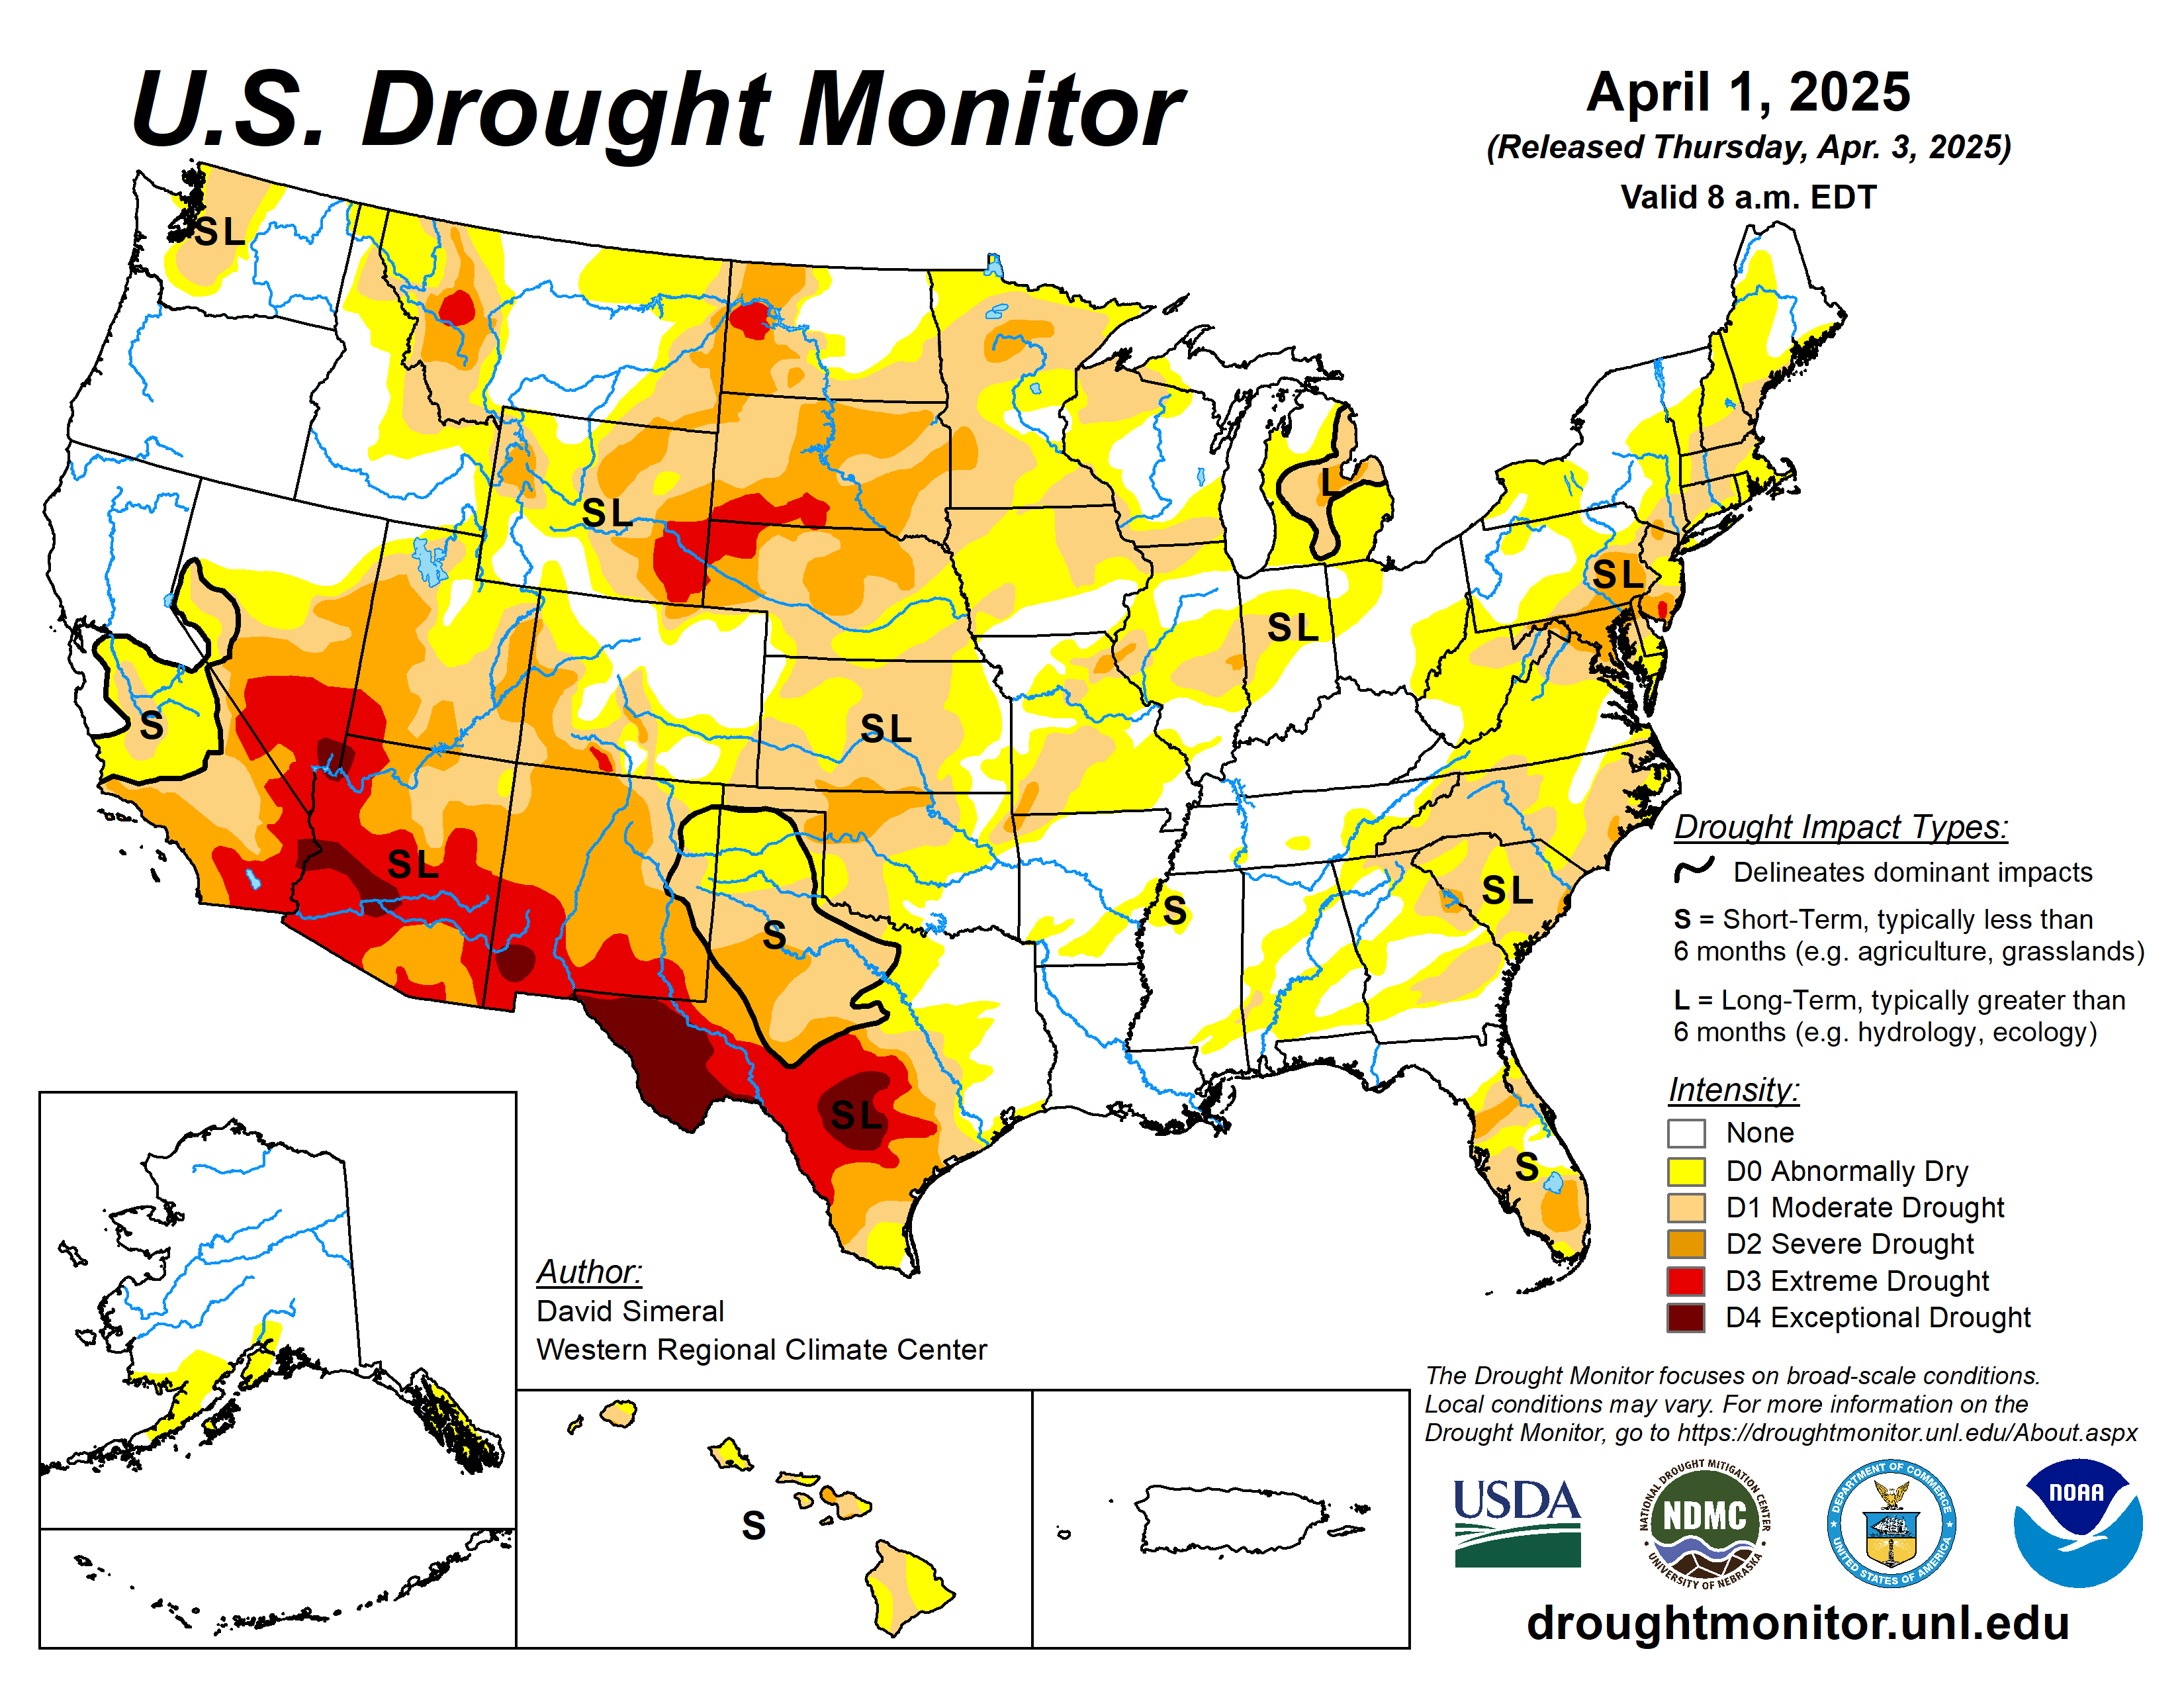
The map for the U.S. Drought Monitor shows that dry conditions prevail over a large portion of the lower 48 states, with some areas in the West now recording “extreme” and “exceptional” drought.
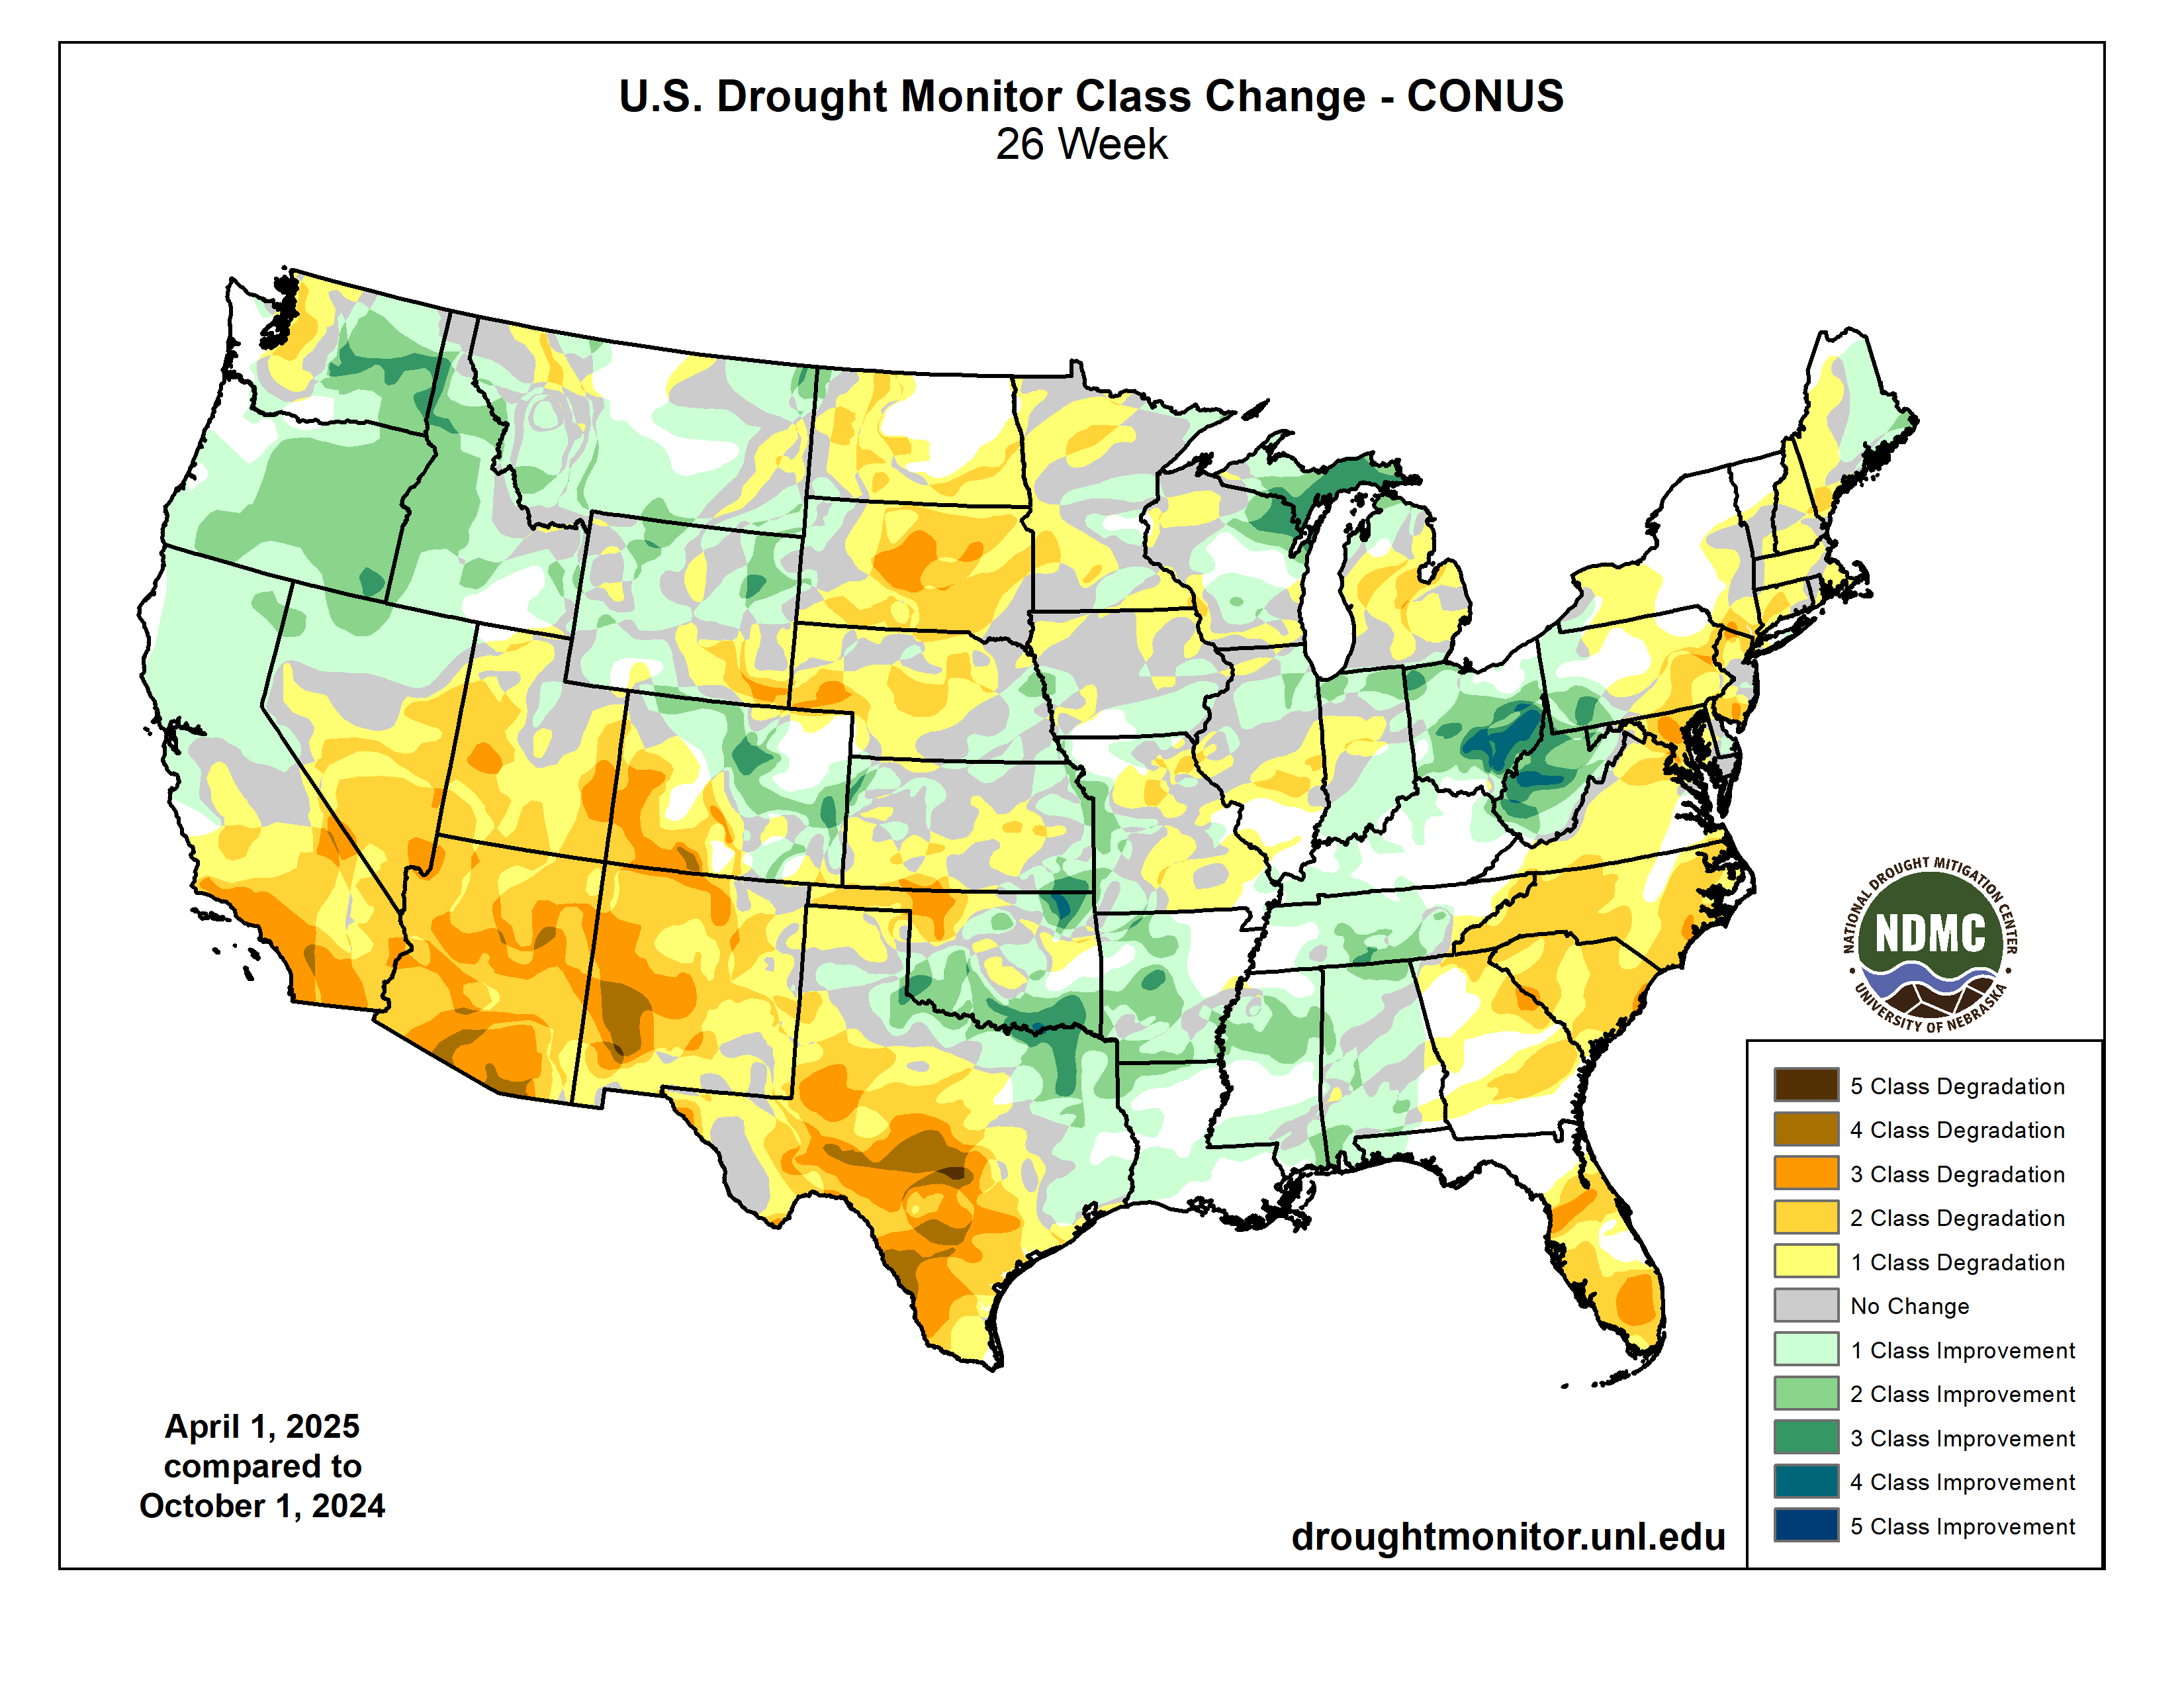
The graphic below shows how the U.S. Drought Monitor has changed over the past six months. All that yellow, orange, and brown in the Southwest indicates that conditions have degraded so far this water year.
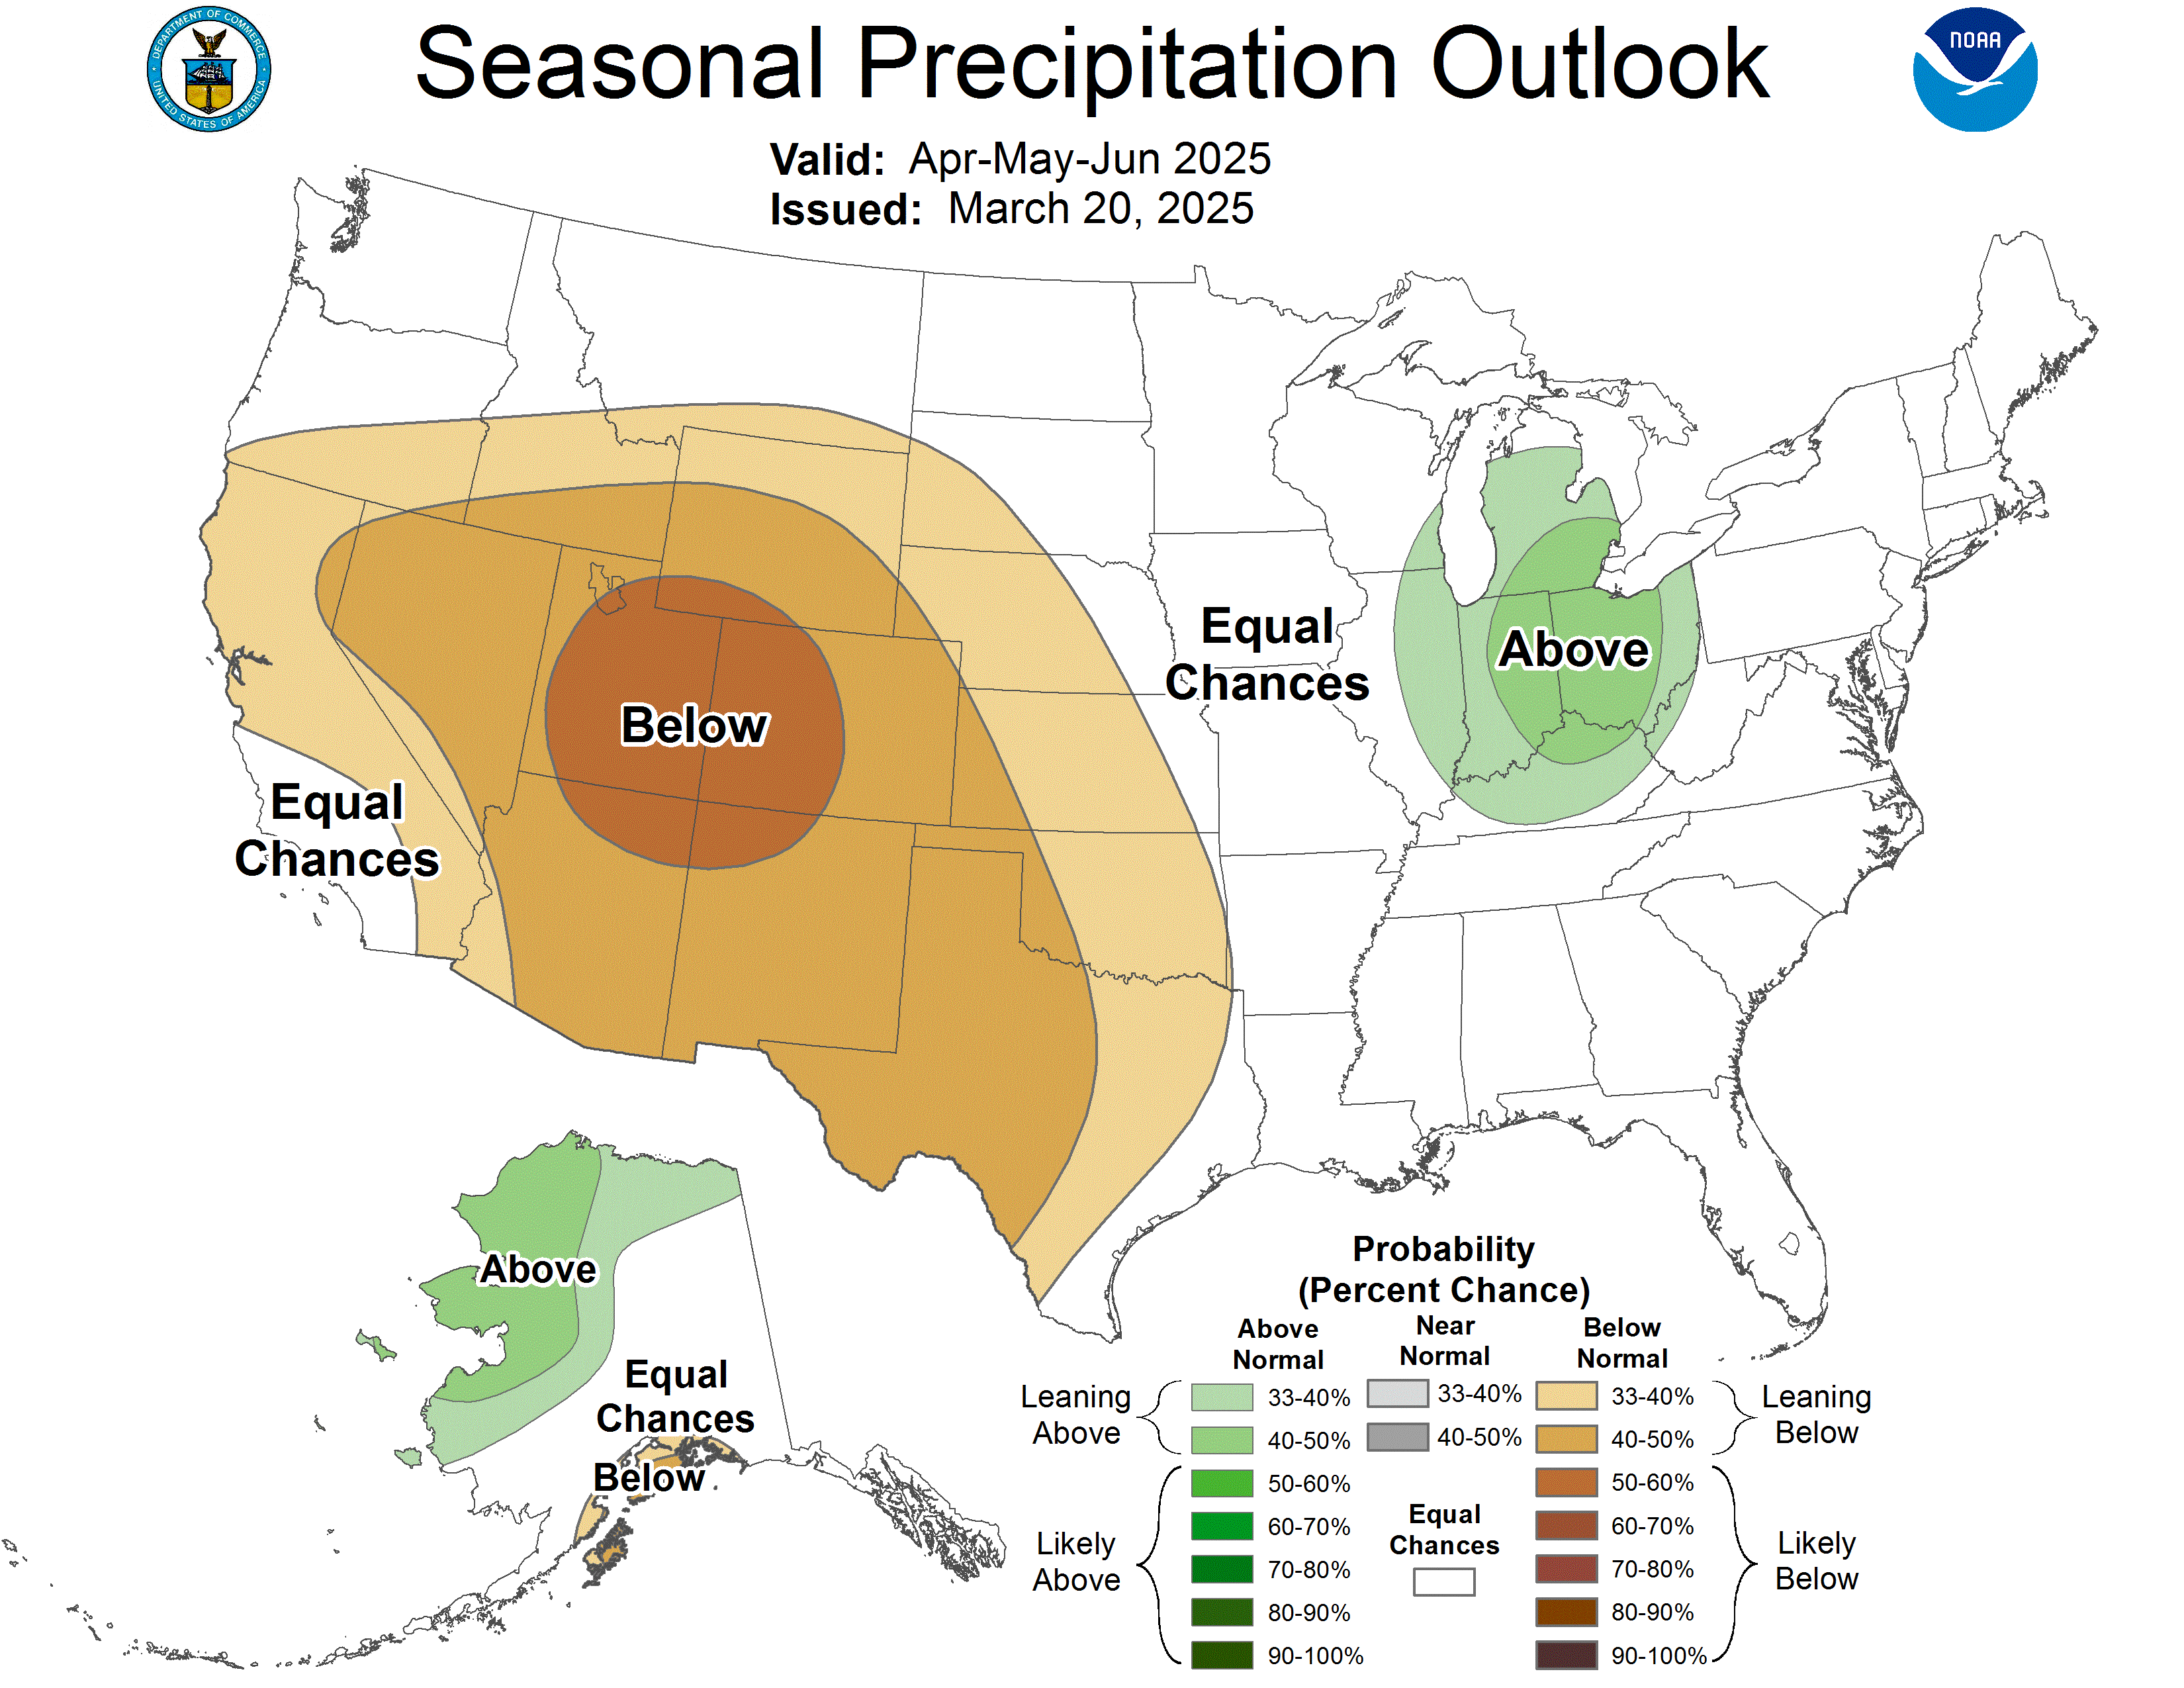
Looking ahead, the Climate Prediction Center says the odds are titled toward drier weather across much of the West during the April-June timeframe.