
I’ve been a generalist most of my career, sometimes even working as a “general assignment reporter,” so I frequently find myself trying to learn about new subjects and bodies of research.
After many self-imposed crash courses, I know that one of the most helpful steps is to understand the terminology used in an issue or field.
Snow science has been no exception, so as I’ve tried to educate myself about the West’s snowpack, I’ve encountered plenty of unfamiliar words and concepts—and realized that my understanding of some things was primitive or outright wrong.
To help me—and you—better understand snow, I’ve compiled a glossary below with definitions of key terms and explanations of important concepts. I begin with an overview of snow and the hydrologic cycle, then explain words and terms in alphabetical order.
I’ve drawn on several other existing glossaries and resources that I’ve listed at the bottom of this post.
Table of contents
Snow 101
The story of snowflakes
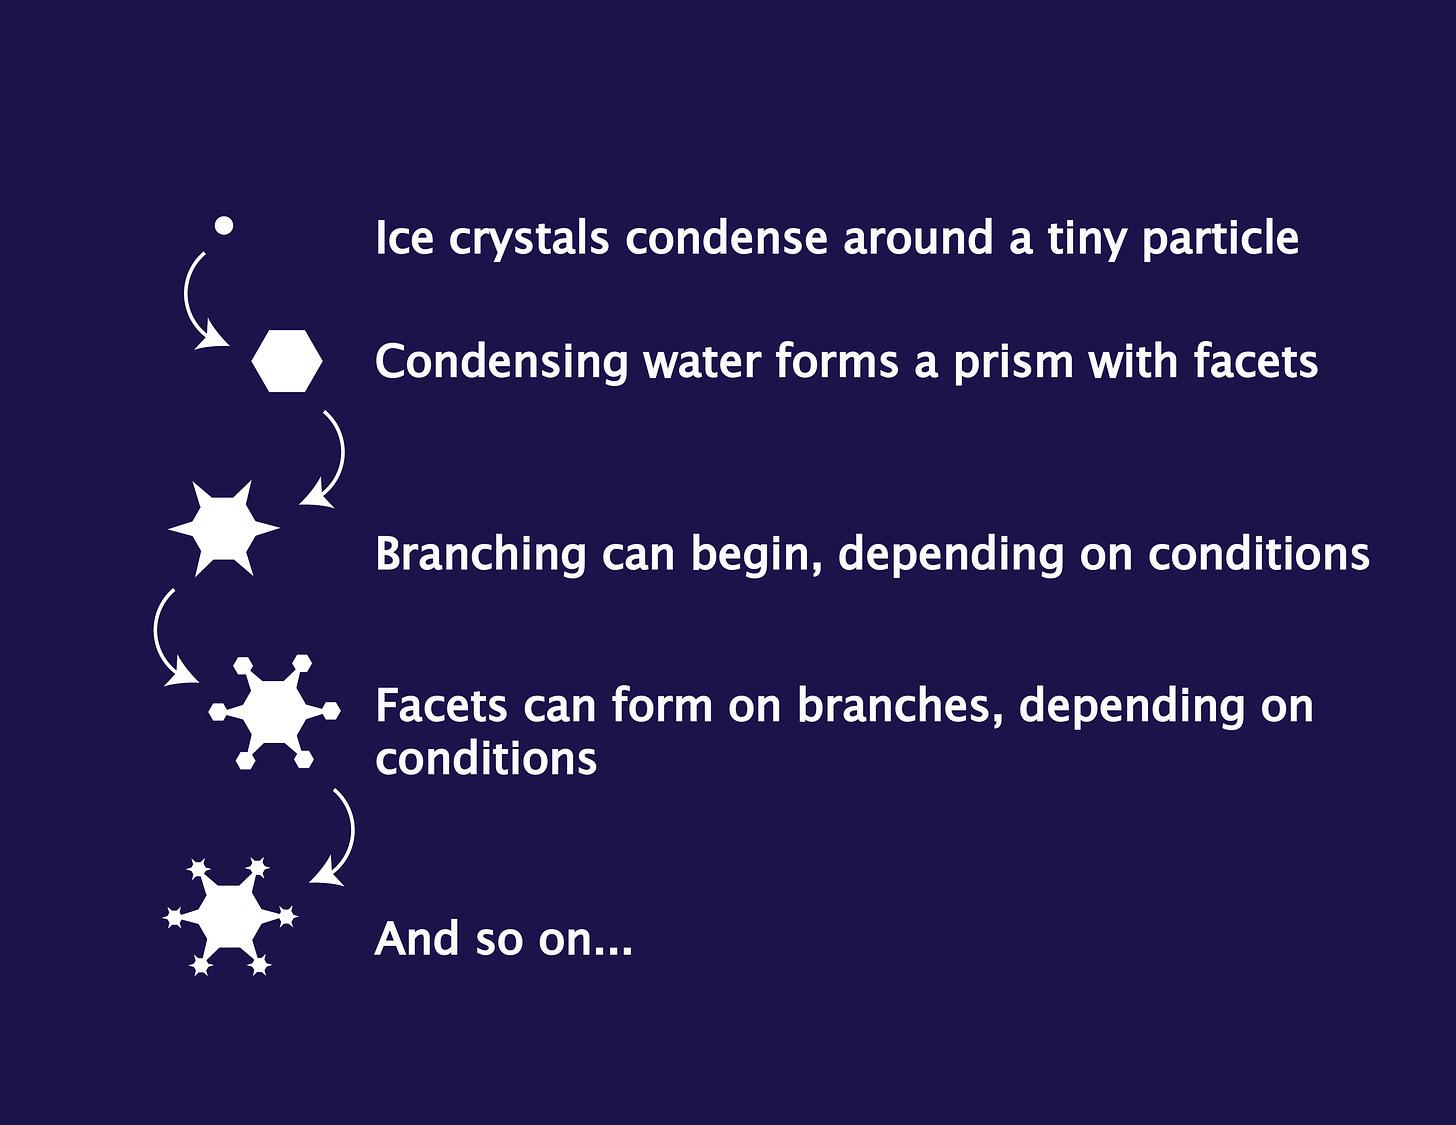
It all begins with snowflakes, which are formed in the atmosphere when water vapor in the air condenses into ice crystals around a particle, such as dust. As they fall, snowflakes may grow complex patterns that are determined by temperature and humidity.
Snow is one of several types of frozen precipitation, and there’s a difference between snowflakes and snow crystals. As Ken Libbrecht, a CalTech physics professor and one of the world’s leading experts on snowflakes, explains:
“When people say snowflake, they often mean snow crystal. The latter is a single crystal of ice, within which the water molecules are all lined up in a precise hexagonal array. Snow crystals display that characteristic six-fold symmetry we are all familiar with . . . A snowflake, on the other hand, is a more general term. It can mean an individual snow crystal, but it can also mean just about anything that falls from the winter clouds. Often hundreds or even thousands of snow crystals collide and stick together in mid-air as they fall, forming flimsy puff-balls we call snowflakes. Calling a snow crystal a snowflake is fine, like calling a tulip a flower.”
A freezing cloud laden with moisture is a prerequisite for snowflakes, but so are the tiny particles, known as nuclei, upon which the water will freeze. The gist of cloud seeding, a technology meant to boost snowfall, involves creating more nuclei in clouds by shooting chemicals, such as silver iodide and dry ice, into the atmosphere.
Once a snow crystal is born, it grows as more water vapor condenses through two main processes: faceting and branching.
Classifying snowflakes
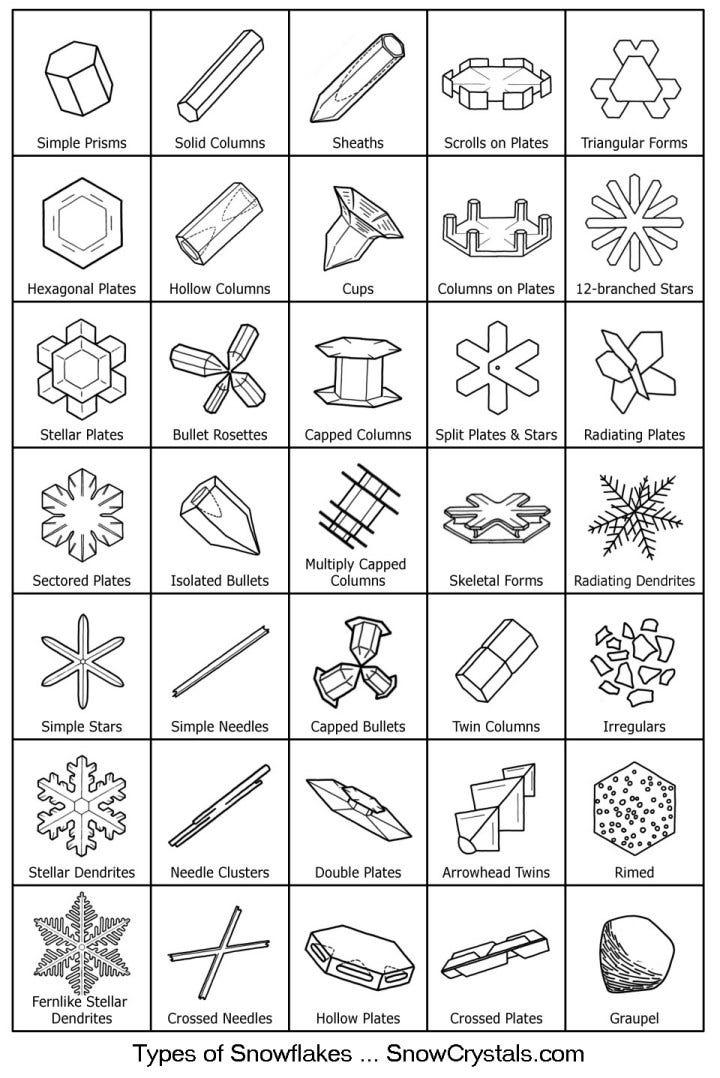
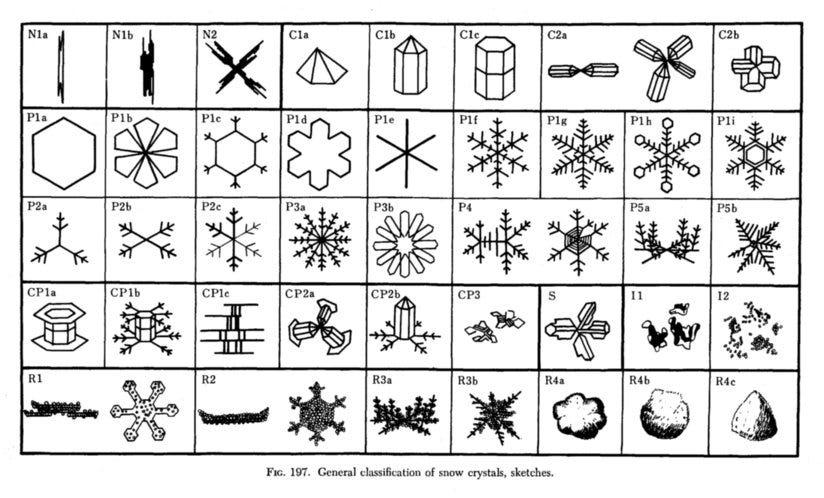
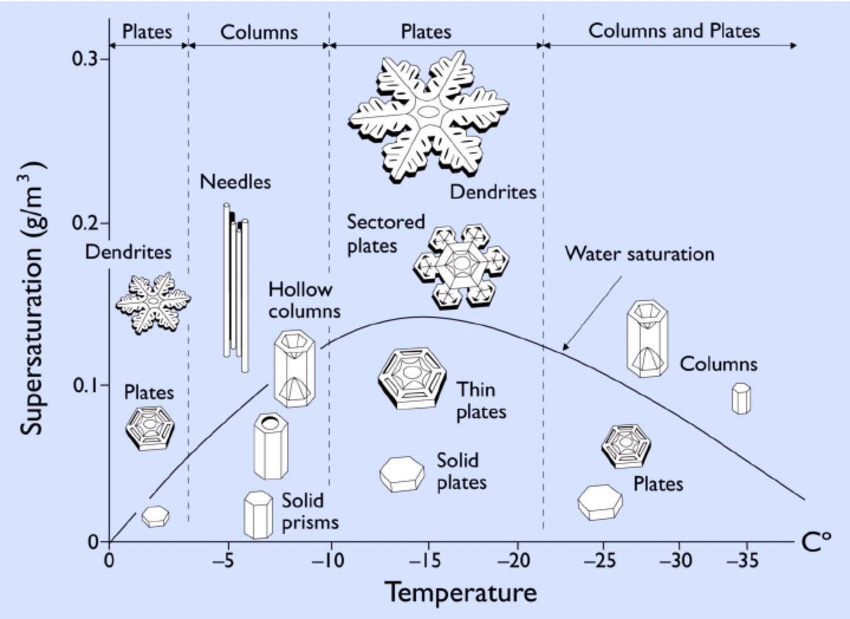
Not every storm will produce a menagerie of iconic crystals on your ski pants with those dendritic, radiating formations worthy of a holiday card. In fact, scientists like Libbrecht have come up with dozens of categories to describe the diversity of shapes. The graphic below, from Libbrecht’s SnowCrystals.com, shows his classification scheme.
The different shapes are due to varying conditions in the atmosphere when the flake forms and grows, which is summarized in Libbrecht’s diagram below.
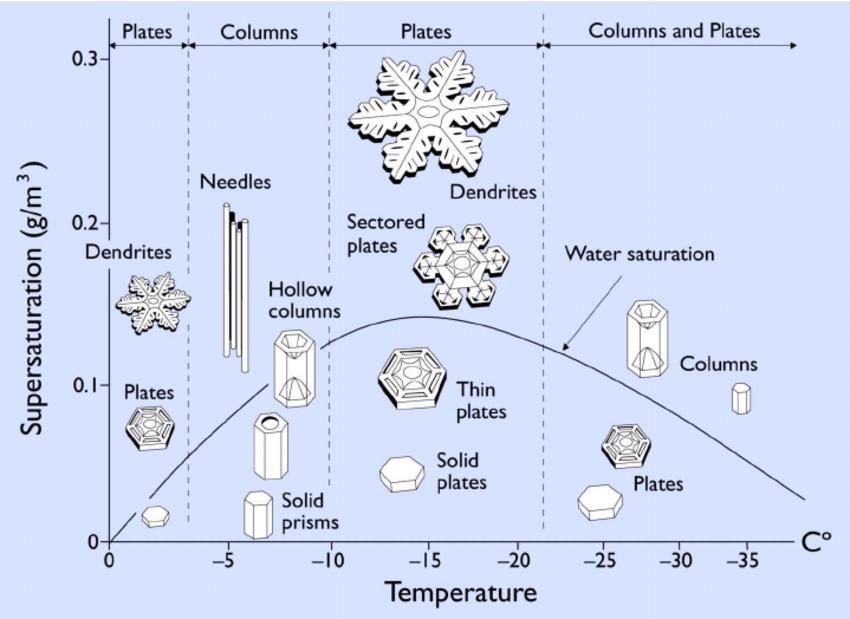
The horizontal axis at the bottom shows the temperature, while the vertical axis on the left is a measure of humidity known as supersaturation. These two factors—temperature and humidity—are different in every weather system and can change dramatically on a snowflake’s tumble through the sky.
The science behind the graphic above, known as a snow crystal morphology diagram, was “discovered in the 1930s by Japanese physicist Ukichiro Nakaya and his collaborators,” according to Libbrecht. The diagram below is a classification by Nakaya, who is credited with creating the first artificial snowflake.
“Nakaya used to say that snowflakes are like hieroglyphs from the clouds,” Libbrecht writes, “because you can infer the conditions in the clouds by examining the shapes of the falling snow crystals.”
Freezing rain, sleet and graupel
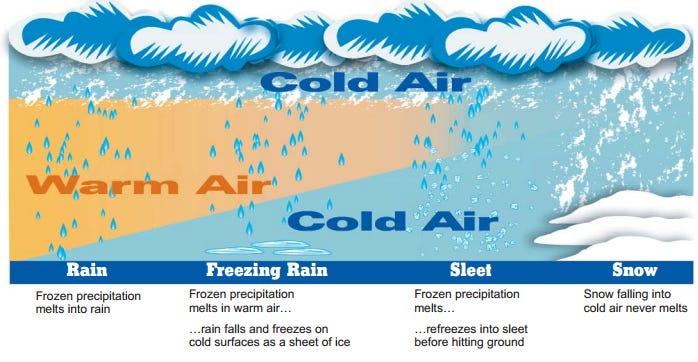
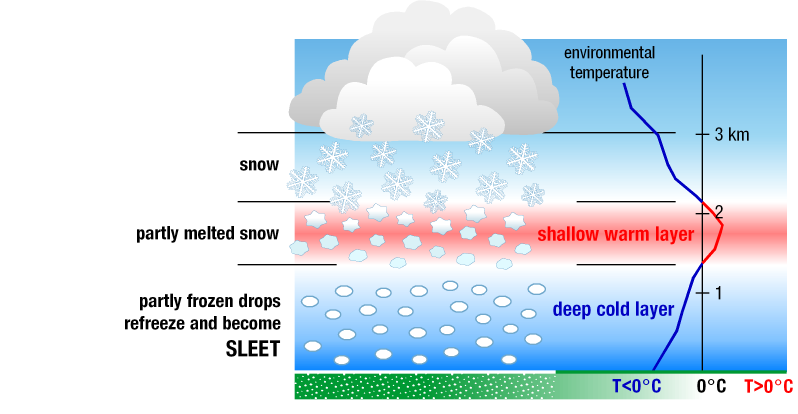
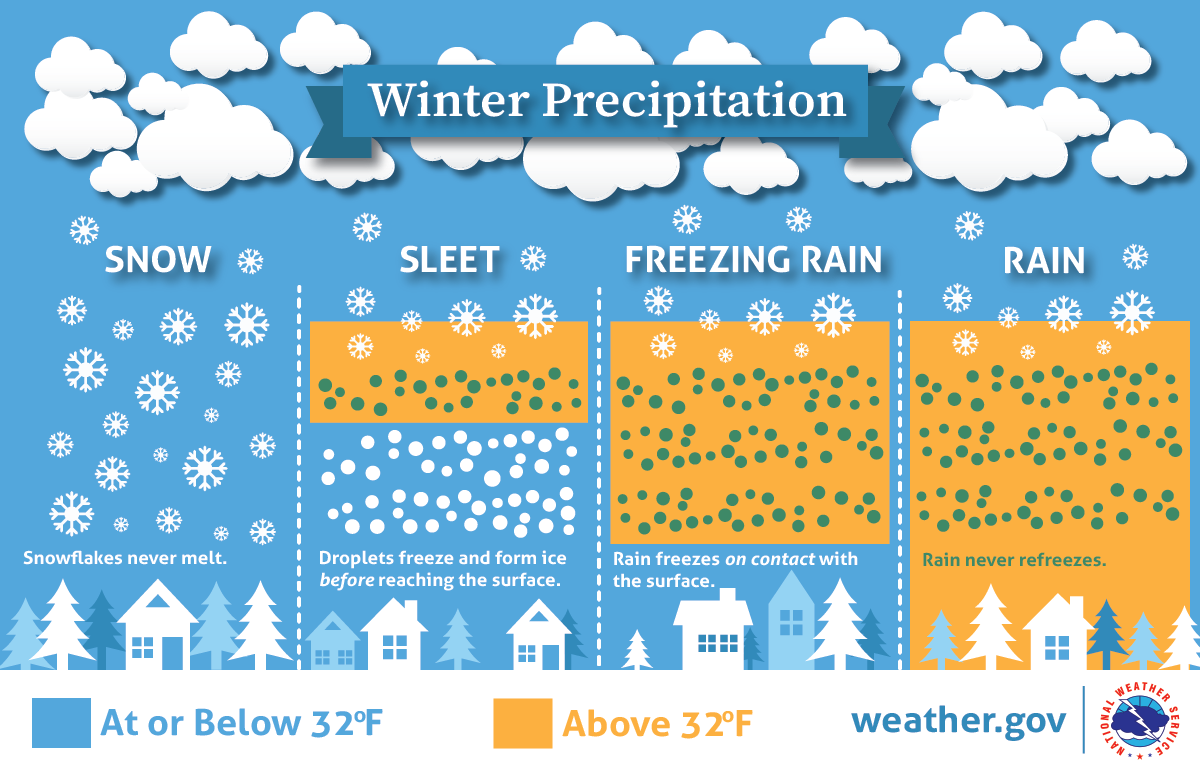
A precious, unique snow crystal high in the atmosphere may not survive in that state on its way to terra firma. As the flake falls, it may encounter warmer conditions that cause it to melt and turn into rain. Or the precipitation may be classified as the dreaded freezing rain if the drops turn to ice on cold surfaces at ground level. Another possibility is for the snow to melt on its way down, but then freeze again before reaching the ground, which is sleet. The graphic below from the National Weather Service summarizes how these types of precipitation differ.
There’s one more type of precipitation connected to snow worth mentioning. Graupel, which is also known as “soft hail” and “snow pellets,” begins as snow, but the flakes pick up an extra layer of moisture known as rime on their way to the ground as supercooled droplets adhere to the crystals.
Types of falling snow
The definitions below from NOAA’s National Severe Storms Laboratory describe different types of snowfall:
- Snow flurries. Light snow falling for short durations. No accumulation or light dusting is all that is expected.
- Snow showers. Snow falling at varying intensities for brief periods of time. Some accumulation is possible.
- Snow squalls. Brief, intense snow showers accompanied by strong, gusty winds. Accumulation may be significant. Snow squalls are best known in the Great Lakes Region.
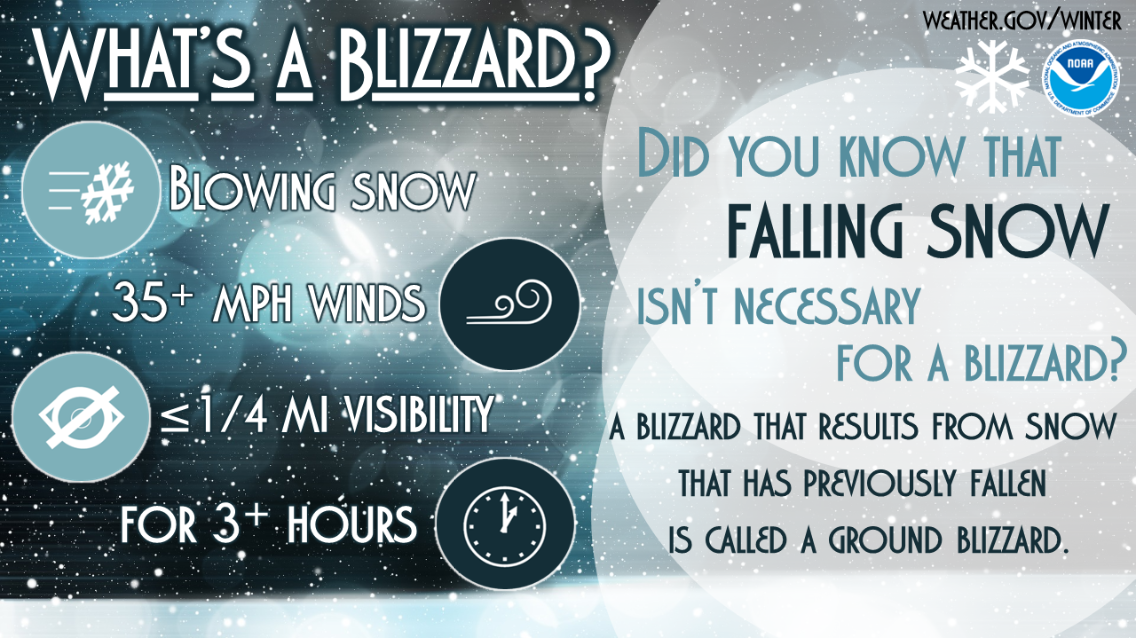
- Blowing snow. Wind-driven snow that reduces visibility and causes significant drifting. Blowing snow may be snow that is falling and/or loose snow on the ground picked up by the wind.
- Blizzards. Winds over 35 mph with snow and blowing snow, reducing visibility to one-quarter mile or less for at least three hours.
For blowing snow and blizzards, it doesn’t need to be actually snowing: the mobilization of snow on the ground can create treacherous conditions of low visibility.
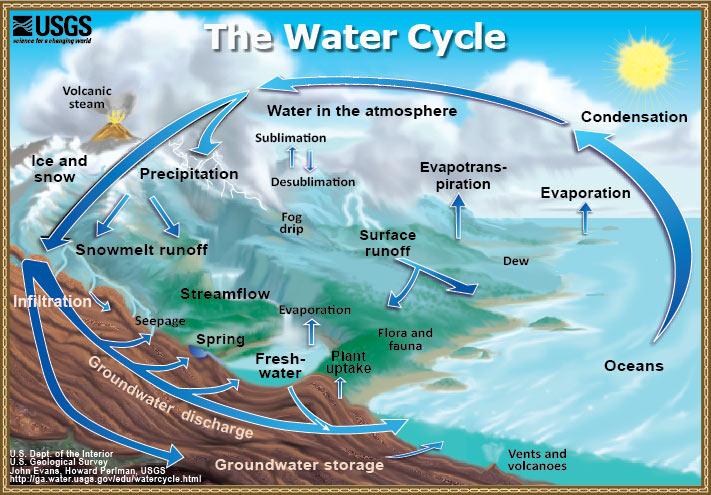
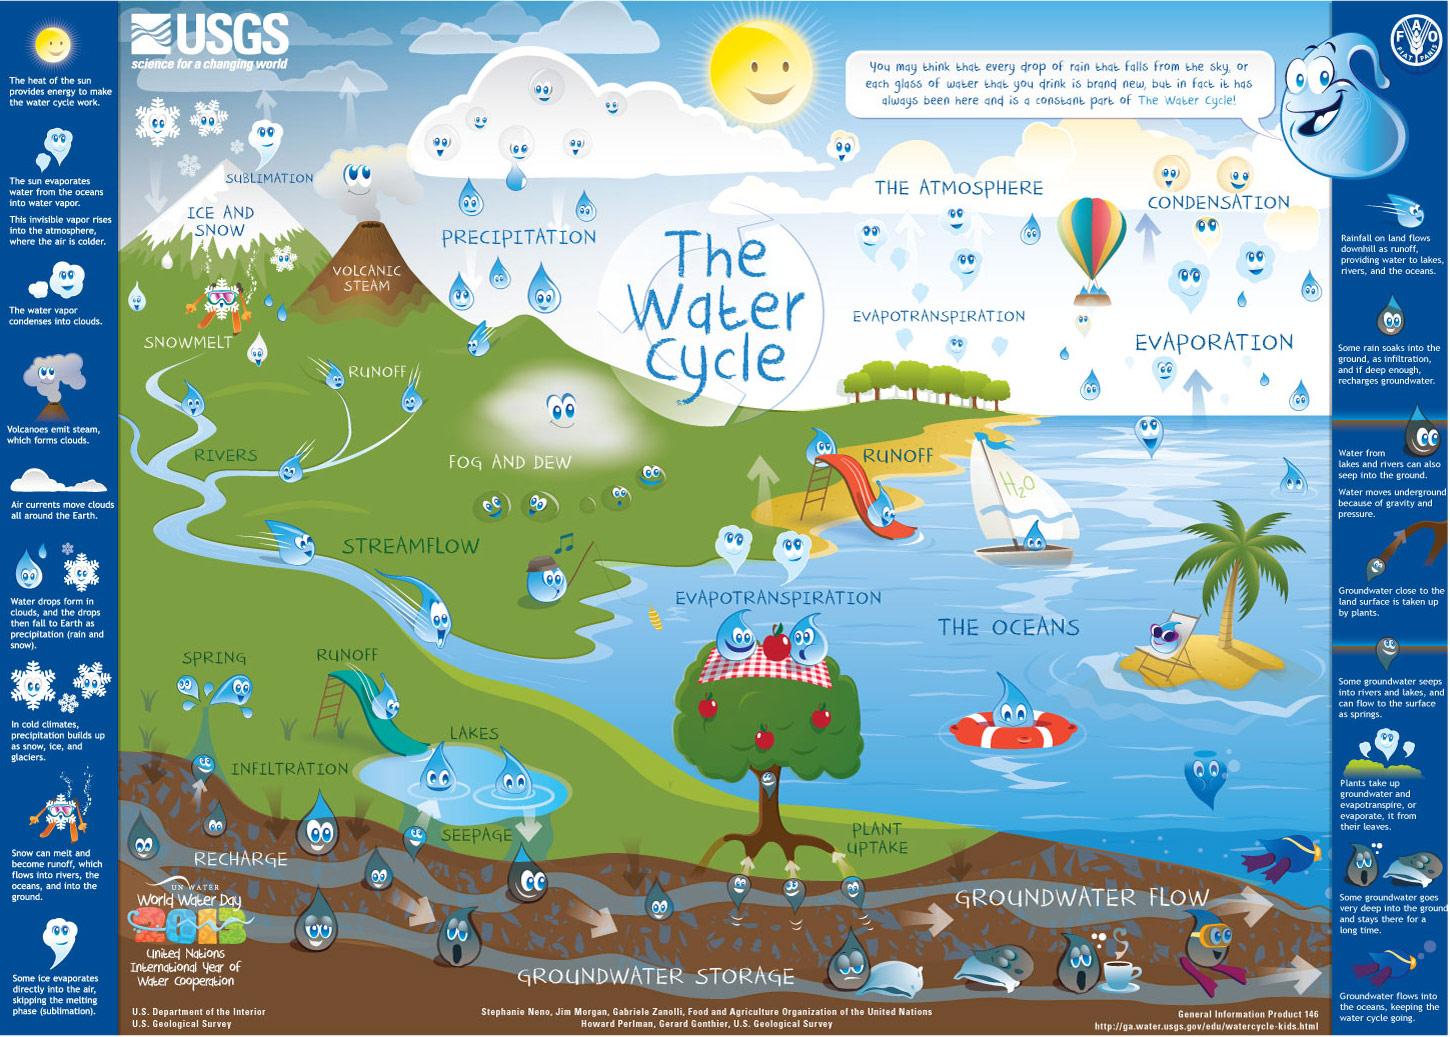
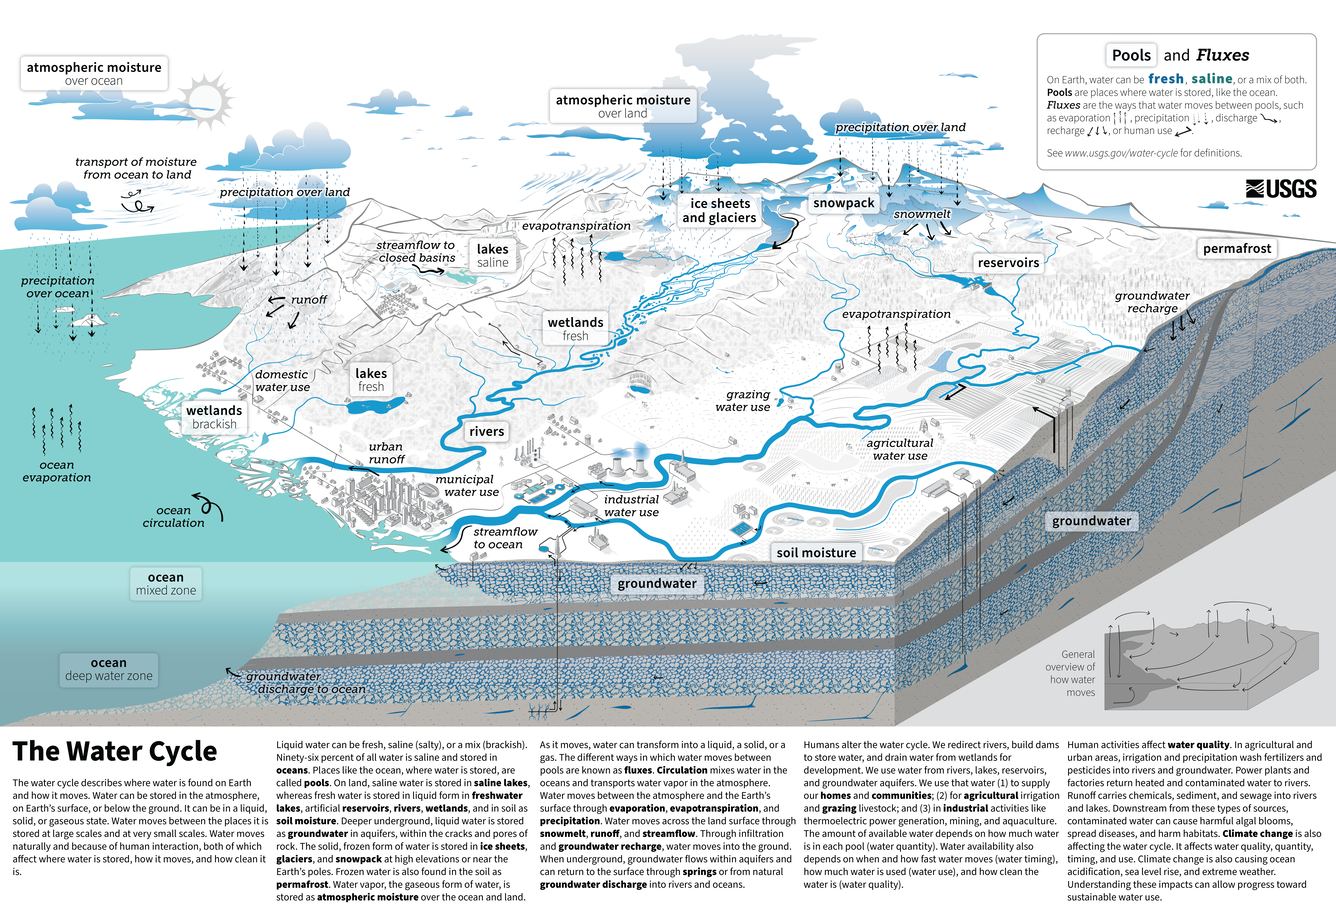
Hydrologic cycle: precipitation, evaporation, transpiration, sublimation, runoff, and more!
After precipitation falls, where does it go? Let’s take a quick tour around the hydrologic cycle, also known as the water cycle. Evaporation, the process by which a liquid becomes a gas, is an important factor in snowpack dynamics, with higher temperatures due to climate change increasing the conversion of liquid water to water vapor.
Transpiration occurs when water is absorbed by plants and released as water vapor through pores in leaves. This key component of the hydrologic cycle, combined with evaporation, equals evapotranspiration. In the context of the snowpack and climate change, if areas are snow-free and expose plants for a longer period due to warming, that would increase the volume of water that plants transpire and potentially decrease the amount of water reaching streams and rivers.
Sublimation occurs when snow and ice transition directly from the solid to the vapor phase without going through the intermediate liquid phase. Hard to measure, sublimation can be a significant player in the snowpack’s dynamics. It’s influenced by temperature, humidity, winds and other factors.
Surface runoff refers to the portion of precipitation that flows over land, while runoff more broadly includes the water that infiltrates into the soil and discharges into streams and rivers.
Infiltration is how water on the surface becomes soil moisture below ground. This process is affected by soil type, land cover, topography and other factors. Existing levels of soil moisture determine how much water can be absorbed and how much will run off. Some water percolates down and recharges groundwater aquifers.
The “efficiency” of runoff is the fraction of annual precipitation that becomes runoff, rather than being lost through evapotranspiration and sublimation. Many factors impact runoff efficiency, including soil moisture, land cover and weather conditions.
Below are three graphics illustrating the water cycle, all from the U.S. Geological Survey.
Glossary of snow-related terms
Accumulation and ablation
Accumulation is the process by which snow and ice are added to the snowpack or a glacier. Snowfall is obviously the most important form of accumulation for the snowpack, but there is also frost deposited from surrounding air, plus some other rarer forms of frozen precipitation, such as graupel, that may be occasionally thrown into the mix.
Ablation describes the loss of snow and ice from an area due to melting, evaporation, sublimation, wind and other factors. The ambient temperature, the amount of incoming solar radiation and the reflectivity (albedo) of the snowpack play major roles in determining ablation, which can be thought of as the opposite of accumulation. The ebb and flow of ablation and accumulation is what determines the status of the snowpack and the size of glaciers.
Albedo
Albedo is a measure of the fraction of solar energy that is reflected from a surface. It ranges from 0 to 1. Surfaces with very high albedo, such as snow and ice, reflect a large fraction of incoming sunlight, while those with low albedo, such as bare ground or open water, absorb most of the energy. Albedo is derived from the Latin word for white, albus.
The Earth’s overall albedo is 0.3, but fresh snow can be around 0.9, which is why you can get a nasty sunburn on the slopes in winter. The albedo values of various other materials are in the graphic below that I created using data from MOSAiC: Multidisciplinary Drifting Observatory for the Study of Arctic Climate.
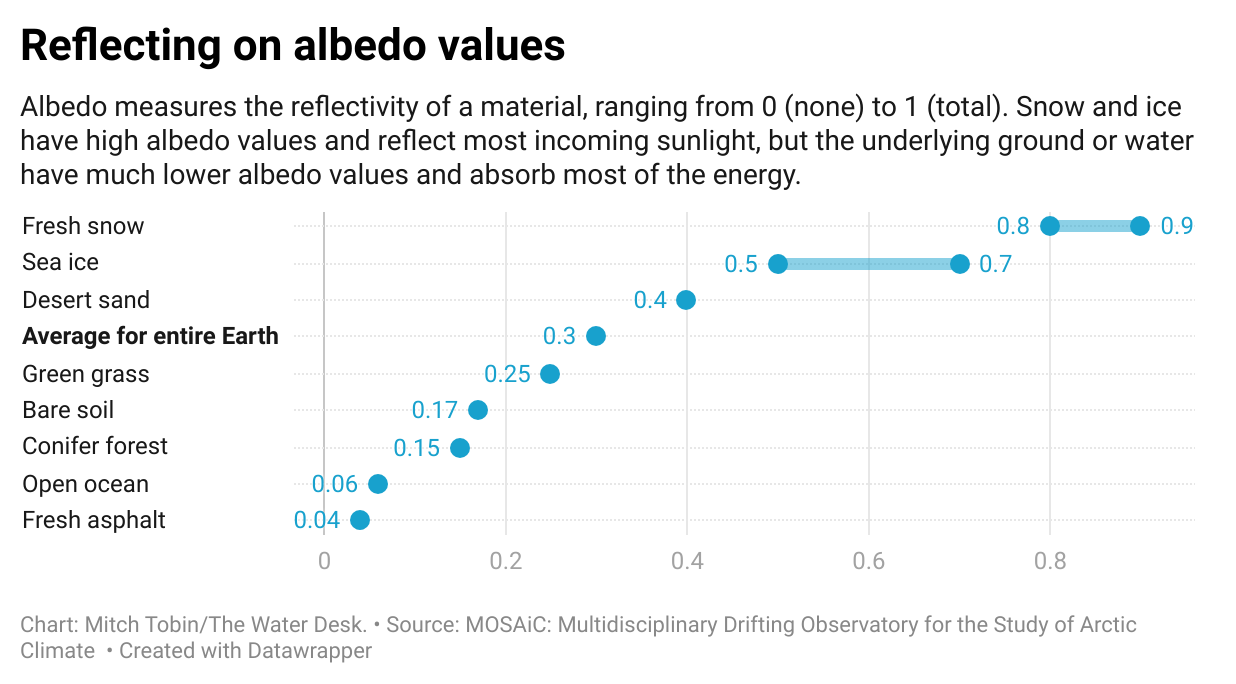
Dust-on-snow events can dramatically decrease the albedo of the snowpack and hasten its melting. On a global scale, albedo plays an important role in climate regulation. The less ice there is on the planet, the more solar radiation is absorbed, leading to further warming. Conversely, an increasingly frosty planet reflects more and more sunlight, cooling the planet further, freezing more ice, and so on, which is what happened to the planet when it turned into “Snowball Earth” many hundreds of millions of years ago.
Atmospheric river
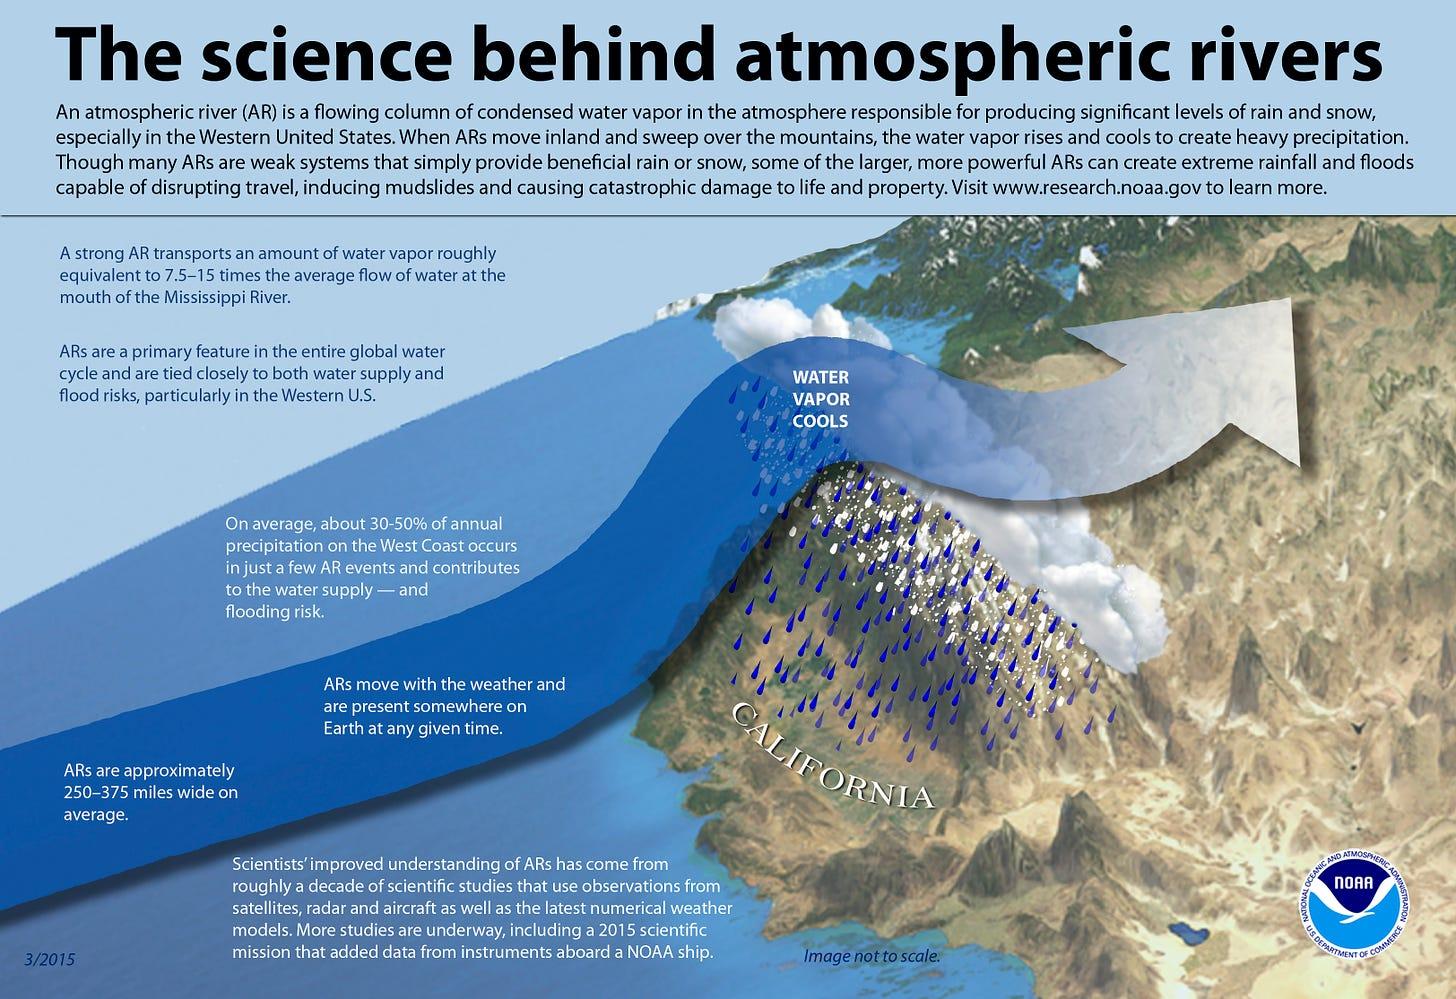
An atmospheric river (AR) is “a long, narrow, and transient corridor of strong horizontal water vapor transport that is typically associated with a low-level jet stream ahead of the cold front of an extratropical cyclone,” according to the American Meteorological Society’s Glossary of Meteorology. These plumes of moisture are sometimes likened to “rivers in the sky” because they transport so much water vapor from the tropics toward higher latitudes. ARs can be beneficial and bust droughts, but they can also be hazardous by causing deadly flooding and extreme winter storms.
When ARs are forced upward by mountains or other forces, the water vapor cools, condenses and precipitates, as shown in the graphic below. This NOAA figure says the amount of water vapor in a strong AR “is roughly equivalent to 7.5-15 times the average flow of water at the mouth of the Mississippi River.”
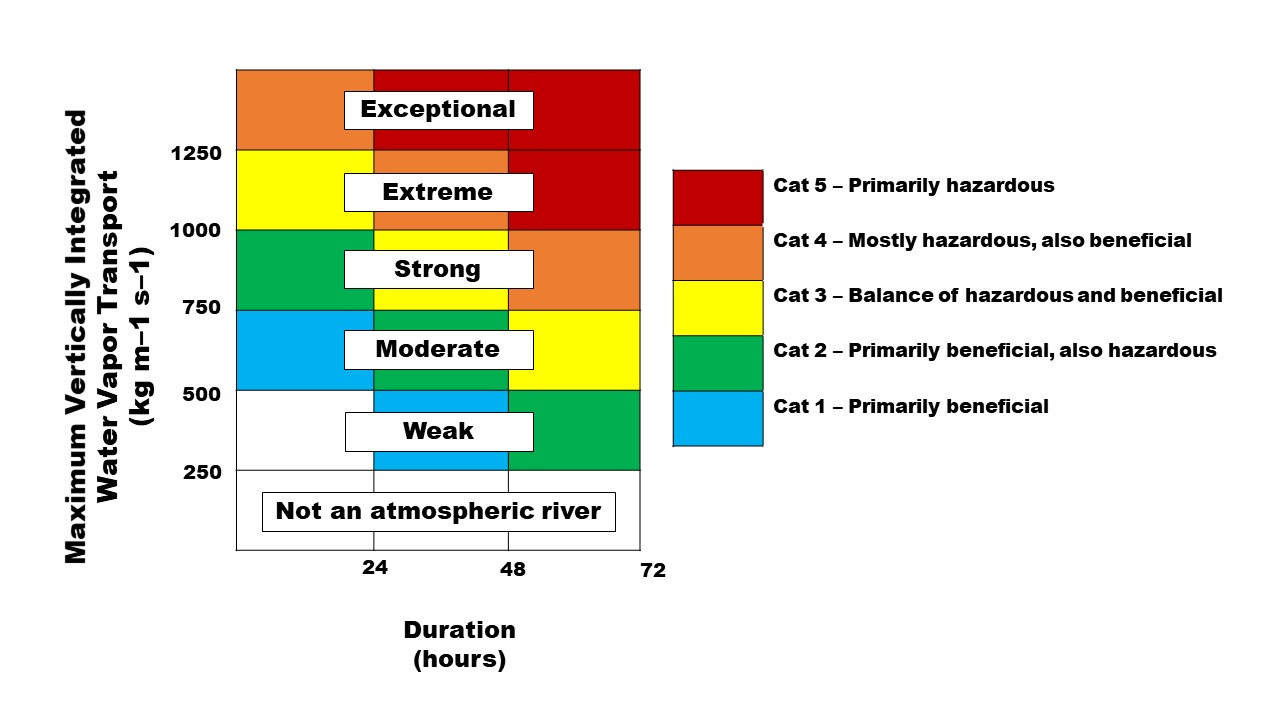
Just as hurricanes are classified by the Saffir-Simpson Hurricane Wind Scale, and tornadoes are categorized by the Enhanced Fujita Scale, ARs have their own rating scale.
The AR Scale is based on two factors: the duration of the event and its “maximum vertically integrated water vapor transport,” a measure of its water content and the speed at which it’s moving. As shown in the graphic below, there are five categories, with the bottom two described as primarily beneficial.
Basin, watershed and catchment
These three terms all refer to an area of land where precipitation collects and drains off into a common outlet, such as a river or bay. These terms are often used interchangeably, but basin is the formal geographic unit that’s used to report snowpack figures. In the American West, some water projects use massive pumps, tunnels and canals to move significant volumes of water from one basin to another to supply water for farms and cities. These are known as transbasin diversions.
Bomb cyclone and bombogenesis
A bomb cyclone is a rapidly strengthening extratropical cyclone that has experienced a drop in atmospheric pressure of at least 24 millibars in 24 hours. These storms can cause very severe weather, including intense snowfall, high winds and flooding.“When a cyclone ‘bombs,’ or undergoes bombogenesis, this tells us that it has access to the optimal ingredients for strengthening, such as high amounts of heat, moisture and rising air,” writes Esther Mullens, Assistant Professor of Geography at the University of Florida. “Most cyclones don’t intensify rapidly in this way. Bomb cyclones put forecasters on high alert, because they can produce significant harmful impacts.”
The term was coined in 1980 by MIT meteorologists Frederick Sanders and John R. Gyakum. In 2018, Gyakum told The Washington Post the name “isn’t an exaggeration — these storms develop explosively and quickly.”
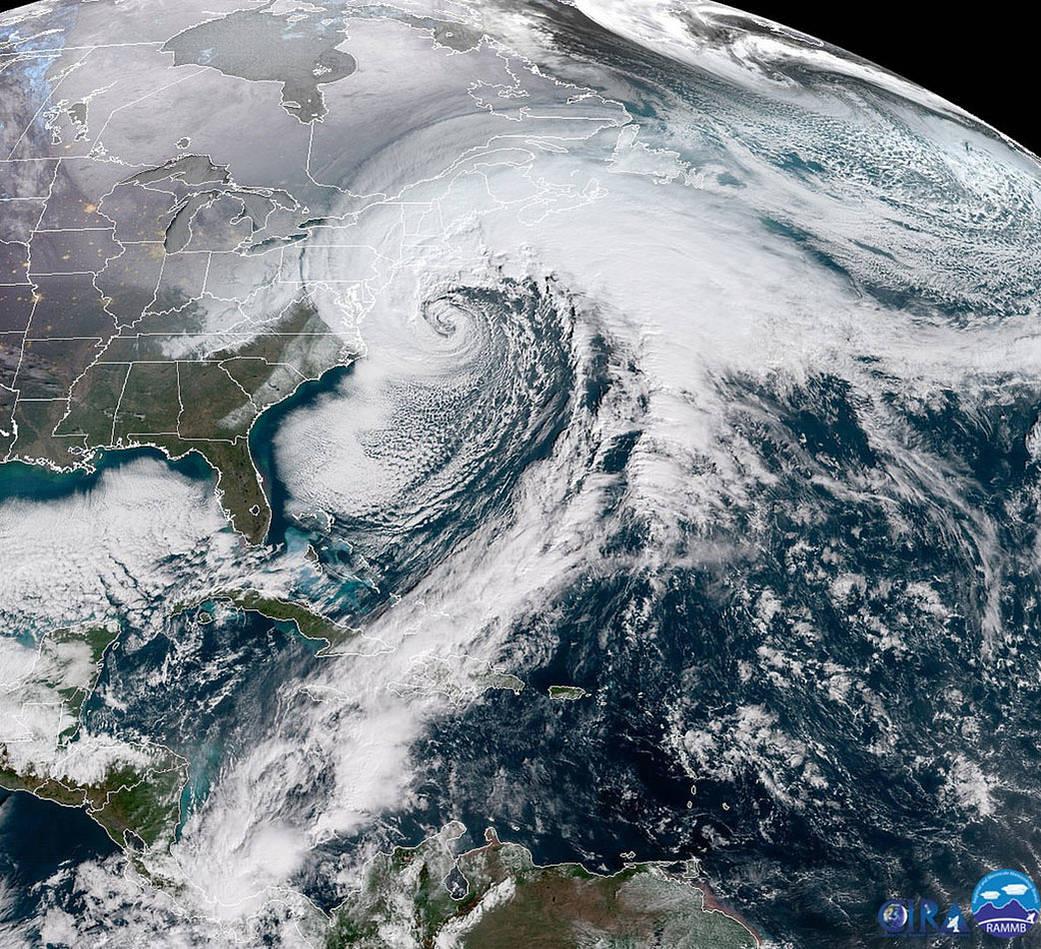
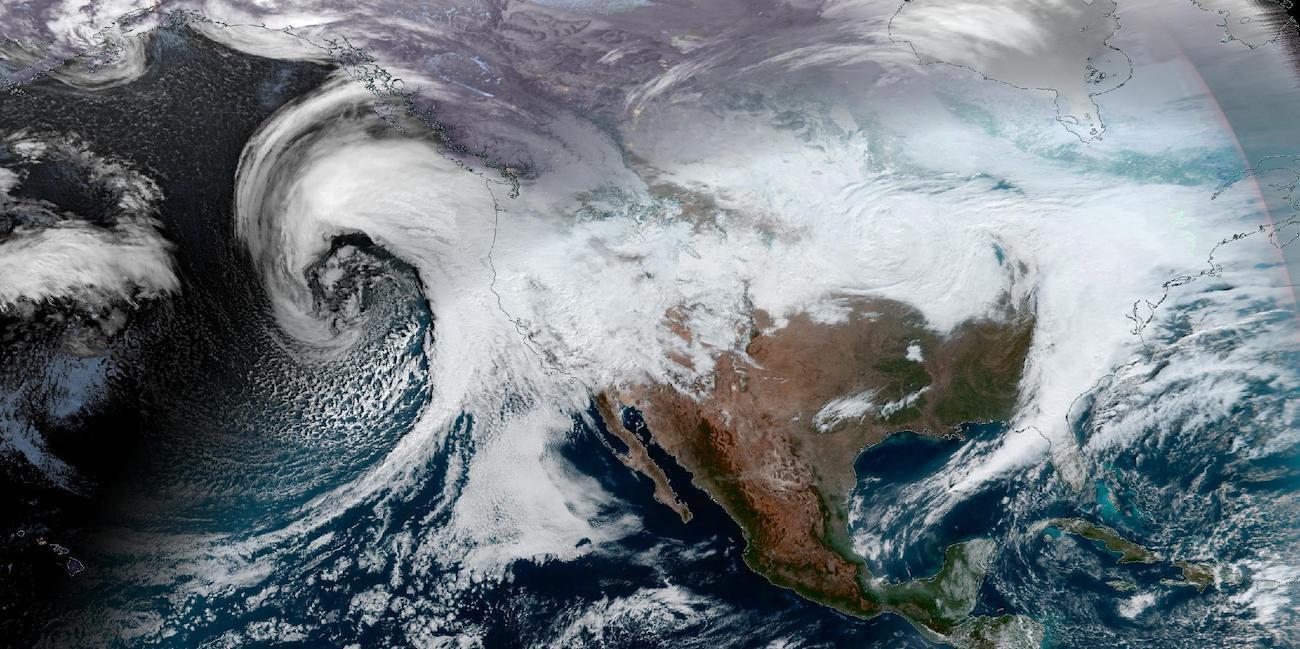
We often hear about bomb cyclones hitting the Eastern Seaboard, where they can draw on the relatively warm waters of the Gulf Stream. The January 4, 2017, satellite image below shows a classic bomb cyclone. This event was also described as a Nor’easter, a storm along the East Coast characterized by strong northeast winds and heavy precipitation, but not all nor’easters are bomb cyclones.
Bombogenesis can also occur in the middle of the country or along the West Coast, as shown by the satellite image below from January 1, 2023.
See this excellent video below from The New York Times for a visual explainer of bomb cyclones.
Cloud seeding
Cloud seeding is an artificial process of boosting precipitation by adding particles, typically silver iodide, to clouds in order to provide nuclei around which water droplets and snowflakes can form. The technology is used by a number of water providers and ski resorts in the West. A 2020 study in the Proceedings of the National Academy of Sciences that used radar and precipitation gauges found that “cloud seeding can boost snowfall across a wide area if the atmospheric conditions are favorable,” according to the National Science Foundation, which funded the research. Learn more about cloud seeding in this story from Water Desk grantee Jeremy Miller.
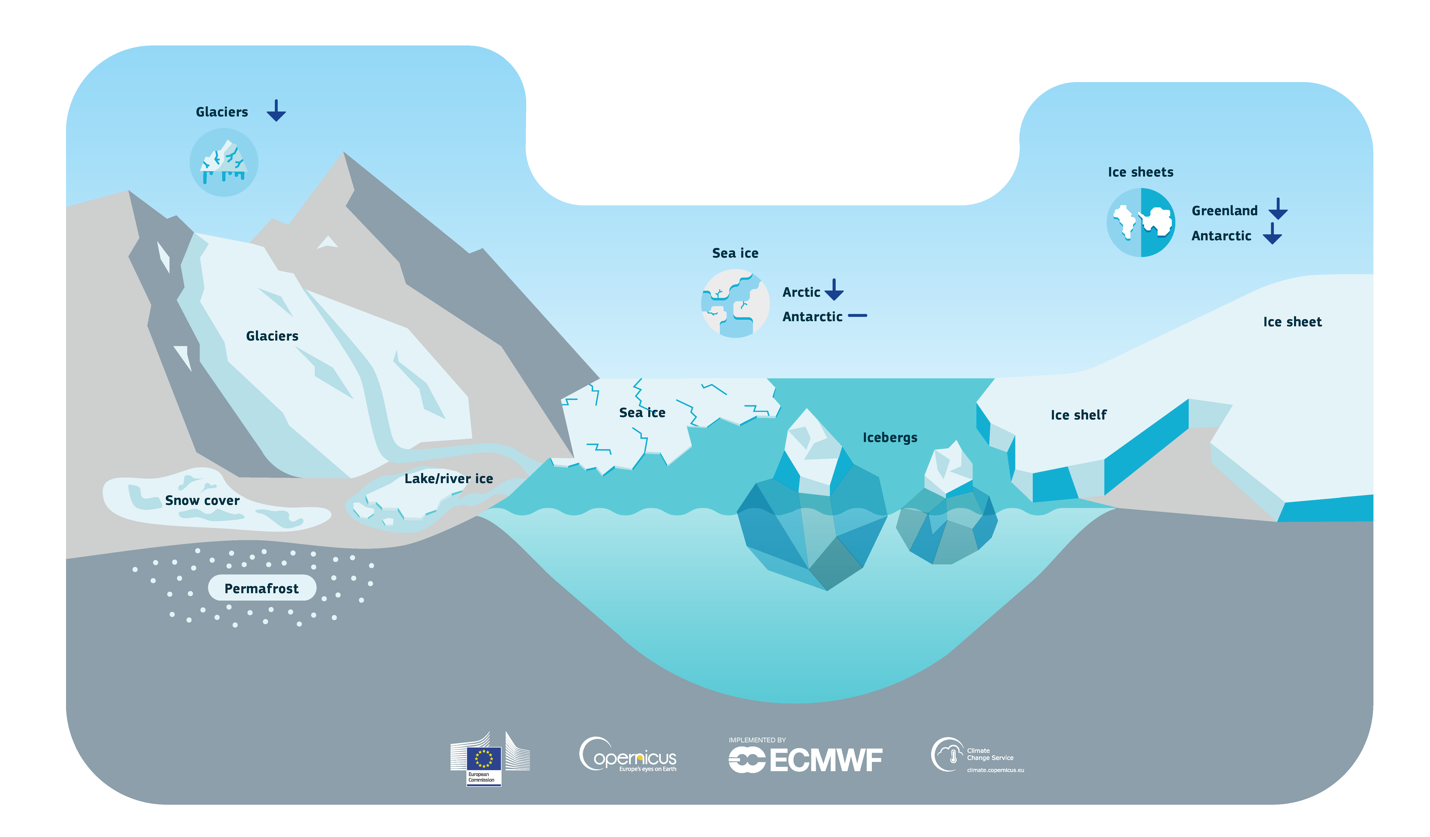
Cryosphere
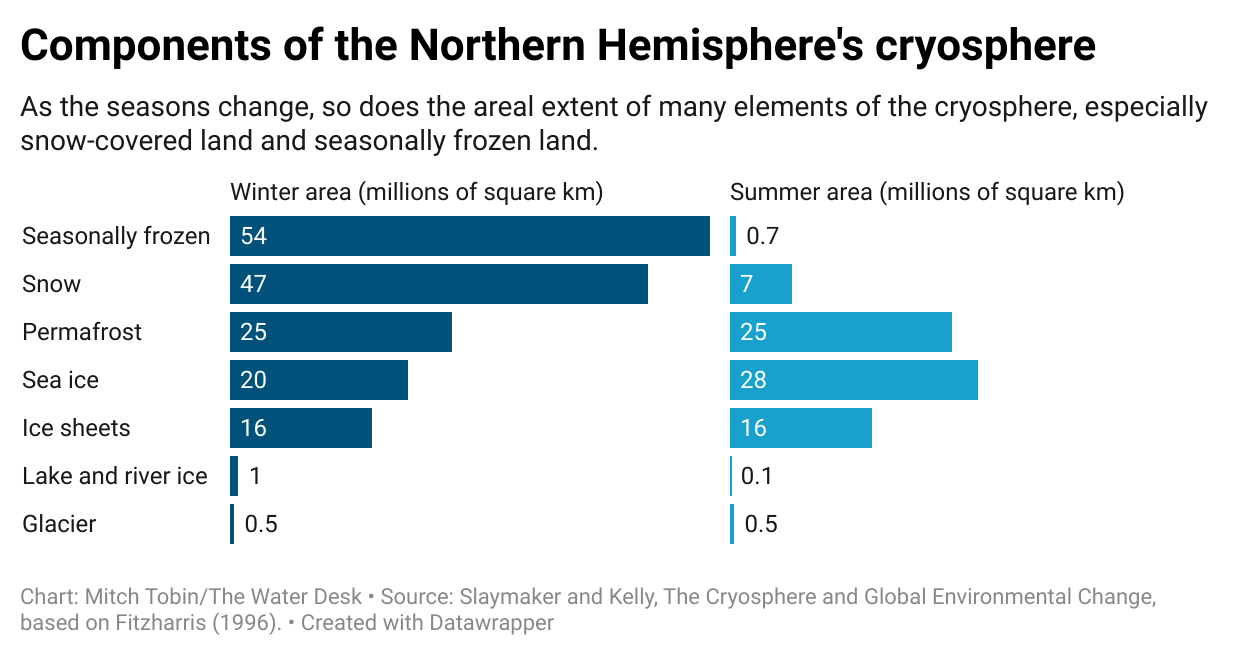
The cryosphere encompasses all the frozen parts of the Earth’s surface: snow cover, glaciers, permafrost, sea ice, ice sheets, ice shelves, icebergs and river/lake ice. The cryosphere stores freshwater for more than 1 billion people and helps regulate the planet’s climate by reflecting sunlight (see albedo). The term derives from the Greek word kryos, meaning “cold” or “frost.” The illustration below shows the cryosphere’s components.
The map below shows where the various components are located. Antarctica is on the left, and the north pole is in the middle of the visualization.
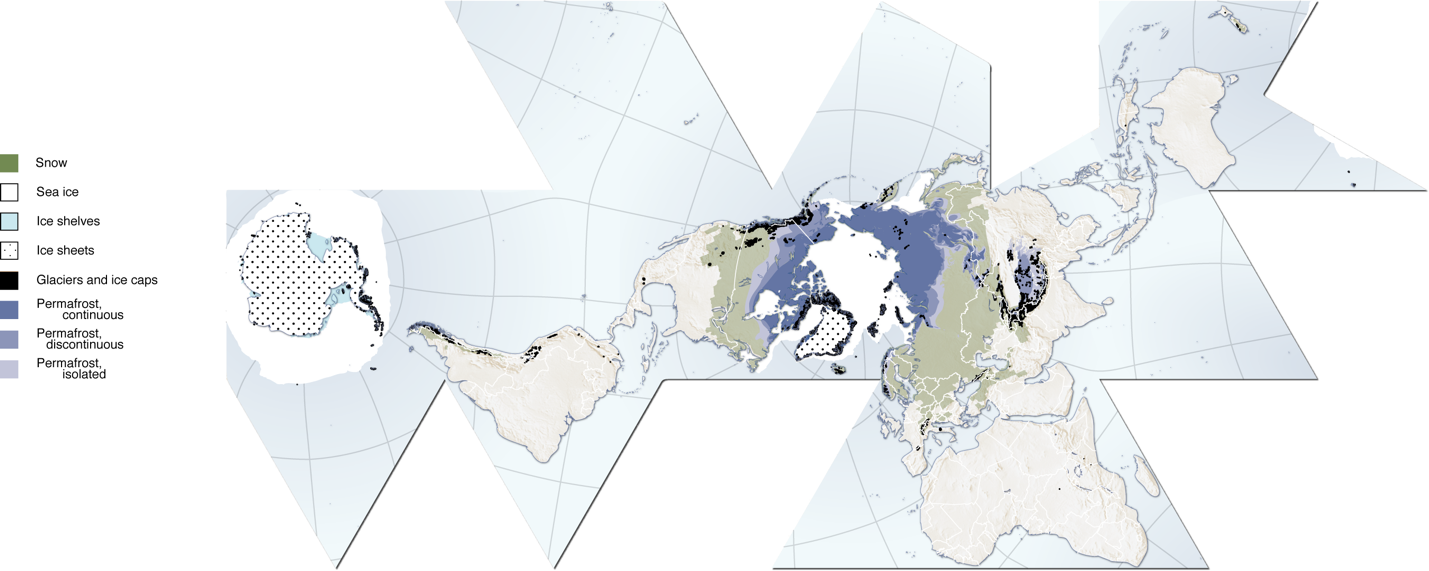
Virtually all of the cryosphere is located near the poles, with the extra-polar regions containing only 0.5% of ice and snow by volume.
Nearly all of the snow-covered areas are located in the Northern Hemisphere, ranging from 47 million square kilometers in winter to just 7 million square kilometers in summer, as shown in the graphic below. At its maximum in winter, snow covers about one-half of the Northern Hemisphere’s land mass. “The areal extent of snow varies more rapidly and more dramatically than that of any other widely distributed material on Earth,” write Olav Slaymaker and Richard E.J. Kelly in The Cryosphere and Global Environmental Change.
Nearly all of the snow-covered areas are located in the Northern Hemisphere, ranging from 47 million square kilometers in winter to just 7 million square kilometers in summer, as shown in the graphic below. At its maximum in winter, snow covers about one-half of the Northern Hemisphere’s land mass. “The areal extent of snow varies more rapidly and more dramatically than that of any other widely distributed material on Earth,” write Olav Slaymaker and Richard E.J. Kelly in The Cryosphere and Global Environmental Change.
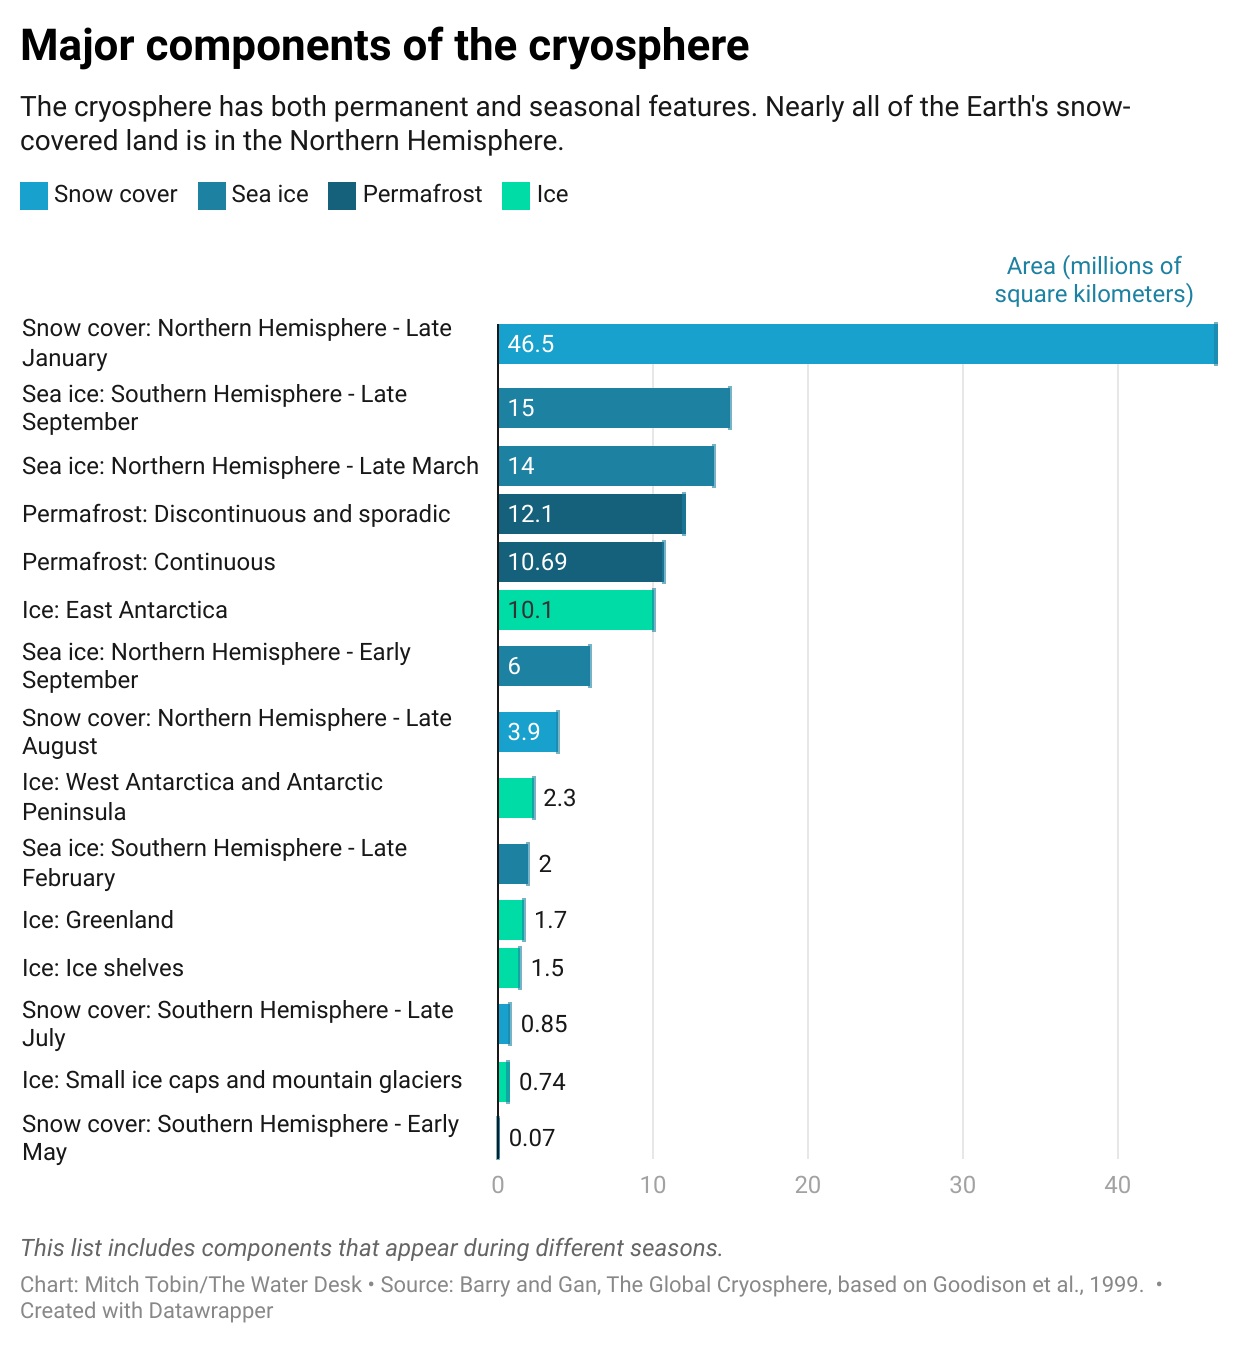
The chart below breaks down the cryosphere’s components into four categories: snow cover, sea ice, permafrost and ice. This graphic includes components that appear during different seasons. While snow cover in the Northern Hemisphere blankets around 47 million square kilometers in January, snow cover in the Southern Hemisphere only amounts to about 4 million square kilometers in late July.
Climate change is already taking a toll on the cryosphere, and even more drastic reductions are projected in the decades ahead as the planet warms. Glaciers, sea ice, ice sheets, permafrost, river/lake ice and snow cover in the Northern Hemisphere are all in trouble. For a solid overview of the global impacts, see the Intergovernmental Panel on Climate Change’s “Special Report on the Ocean and Cryosphere in a Changing Climate.”
Dust-on-snow
Dust-on-snow is exactly what it sounds like: deposition of airborne dust on the snowpack. More generally, scientists talk about light-absorbing particles that alter the reflectivity of the snowpack. In places like Colorado, dust-on-snow events are a big deal because the darker material reduces the snow’s albedo and causes it to absorb more heat, accelerating melting. While some airborne dust is natural, research has found that dust levels have soared since the West was settled due to agriculture, roads, development and other factors. See the Colorado Dust-on-Snow Program from the Center for Snow and Avalanche Studies for more on the issue.
The West’s increasing dryness threatens to reinforce snow loss by increasing the amount of dust that lands on the snowpack, thereby accelerating its melting. As a result, the most recent National Climate Assessment (NCA5) cautions that “under increasing aridity, agricultural practices such as fallowing and grazing on rangelands will need careful management to avoid increased wind erosion and dust production from exposed soils.” Adding insult to injury, NCA5 warns that those soils will be more susceptible to blowing around because hotter summers will “degrade protective desert soil crusts formed by communities of algae, bacteria, lichens, fungi, or mosses.”
Glaciers and glacial landforms
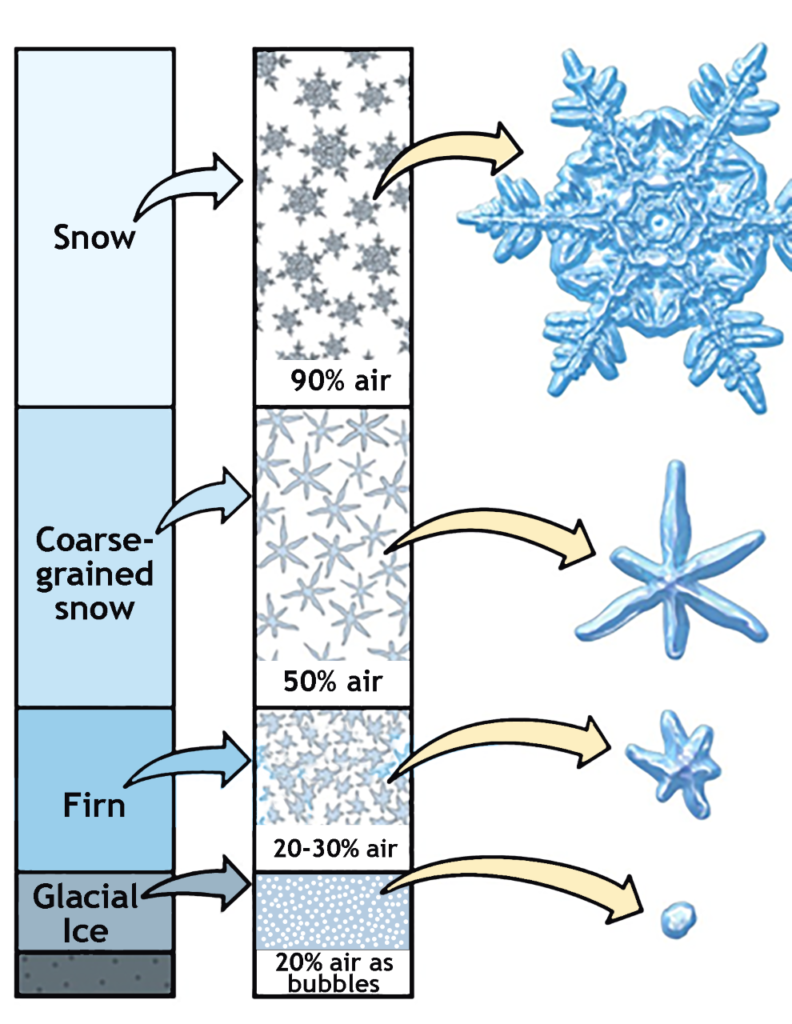
A glacier is a large, perennial mass of ice and snow that moves slowly downhill under the influence of gravity. A glacier will form if the accumulation of snow and ice exceeds their loss through ablation (via melting, evaporation, sublimation and other forces).
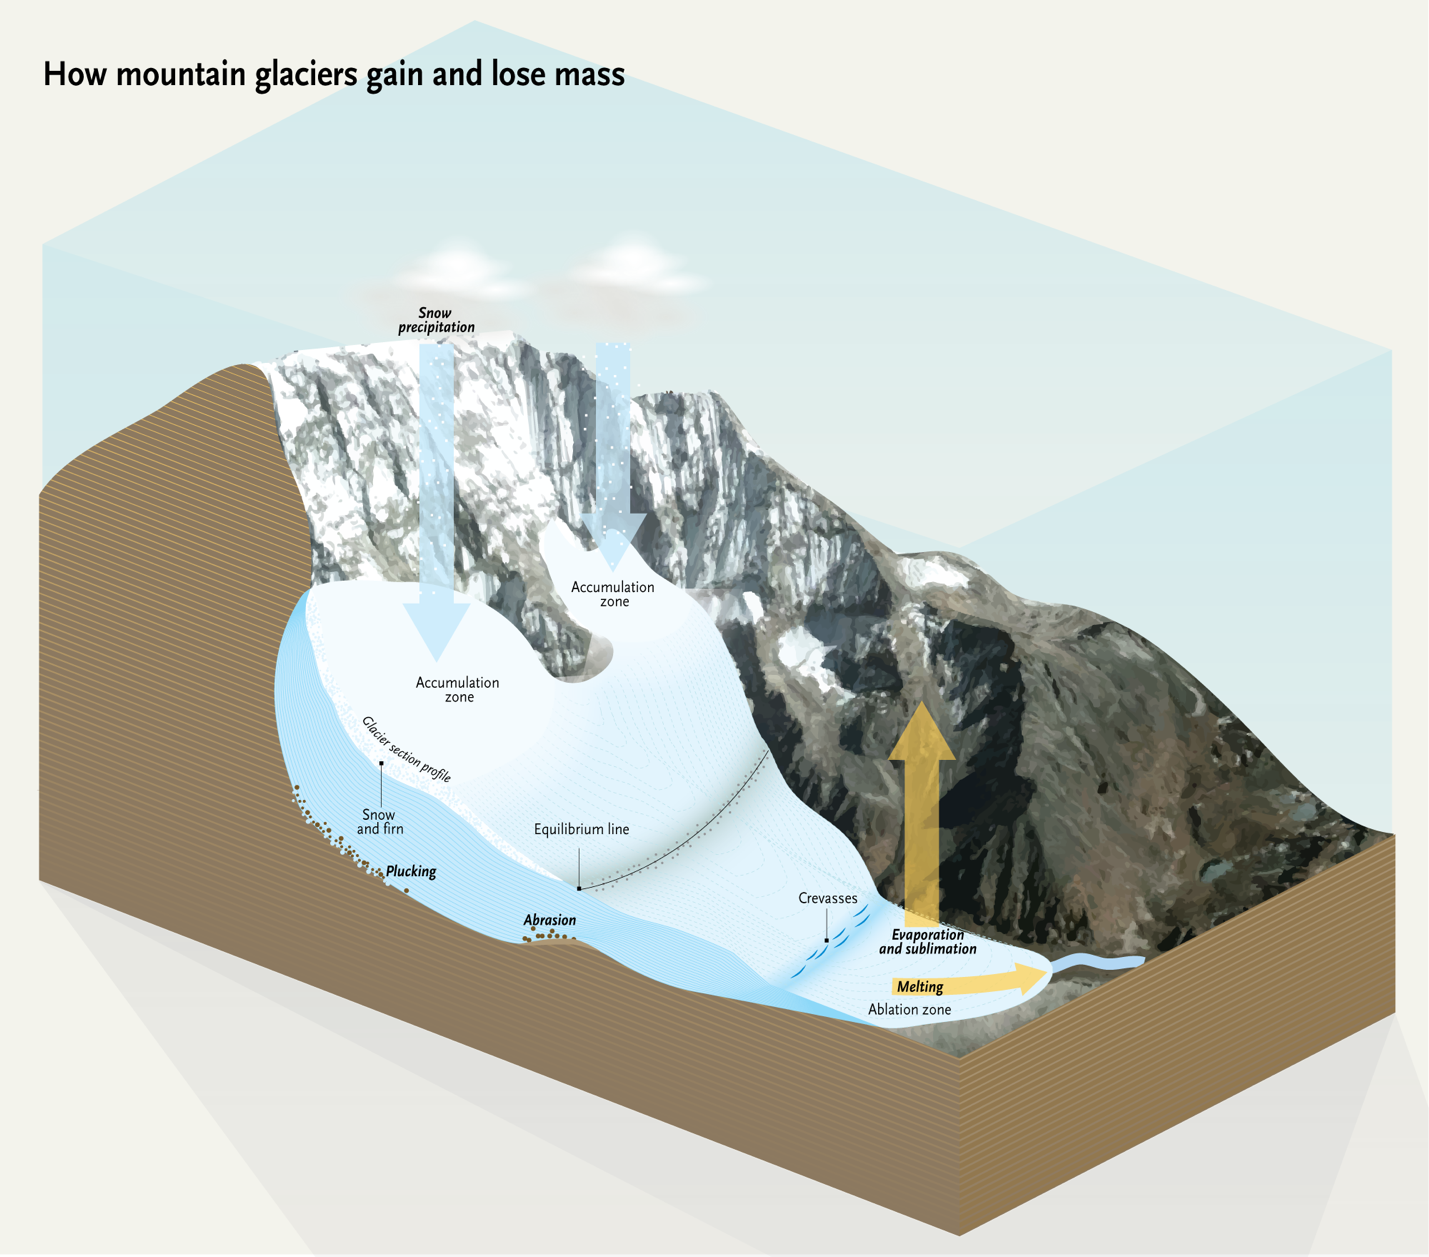
As the snow accumulates, it compresses over time, turning into firn before becoming ice, as shown in the illustrations below.
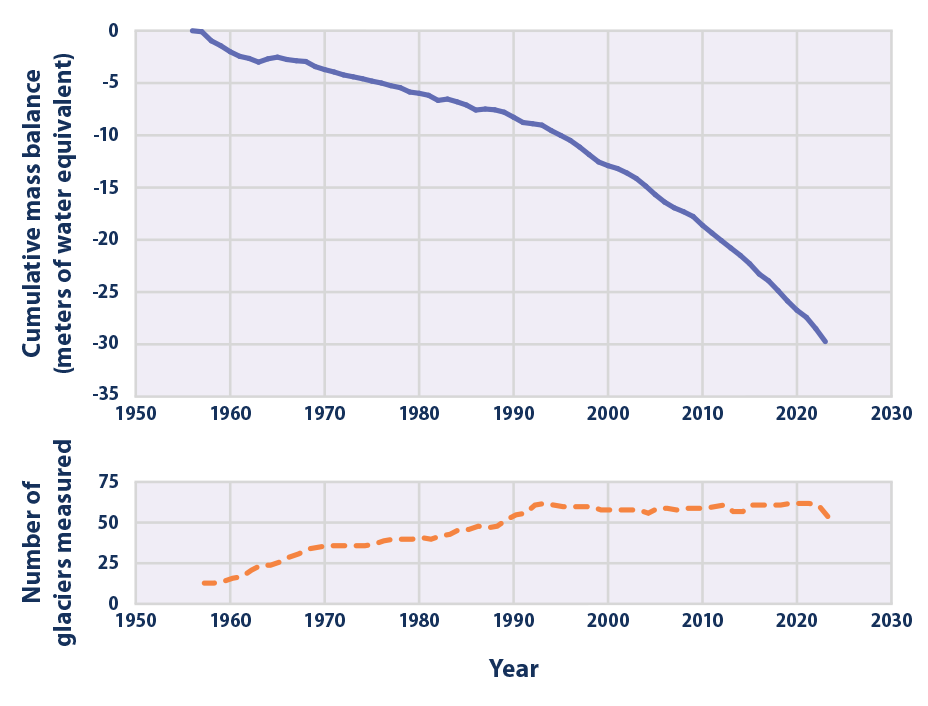
Glaciers around the globe are threatened by warming and are used as a barometer of climate change effects. The graphic below, from the U.S. Environmental Protection Agency, shows a precipitous decline in reference glaciers around the globe from 1956 to 2023.
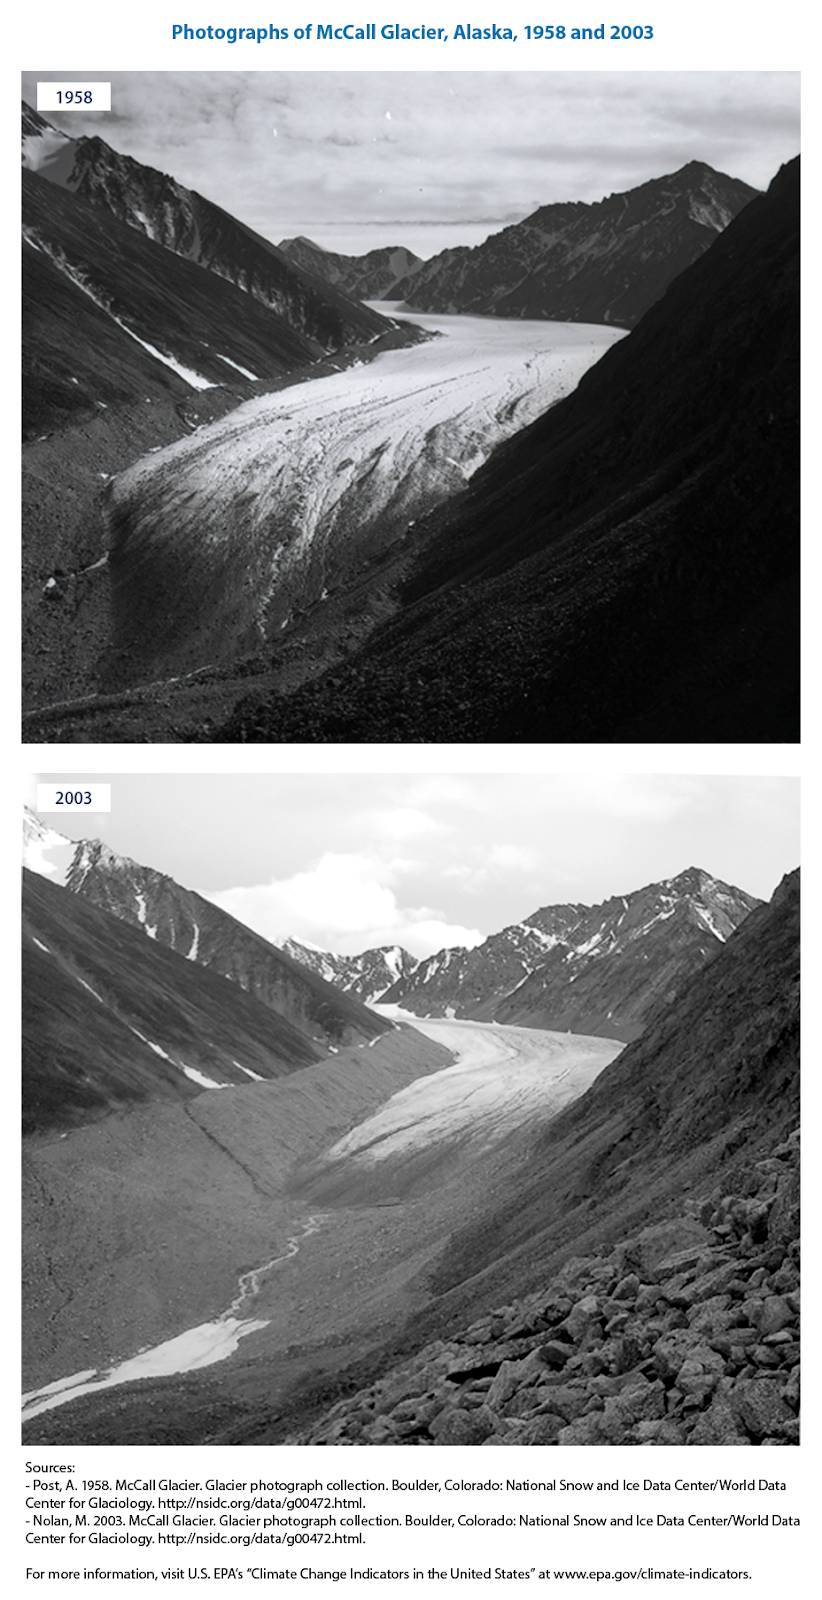
The photographs below show how Alaska’s McCall Glacier changed from 1958 to 2023.
Past Ice Ages covered many of the West’s mountains in ice, and the current landscape still reflects these past glaciations, which both erode and deposit material. (At the height of the Last Glacial Maximum, around 20,000 years ago, about one-quarter of the Earth’s land area was covered by glaciers.)
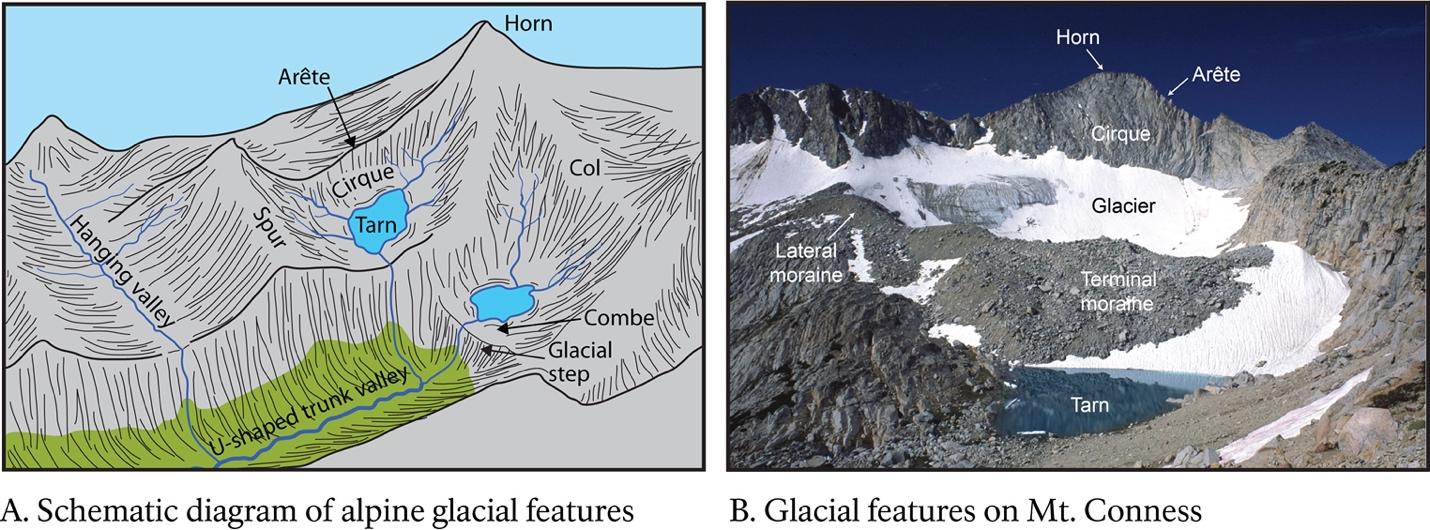
The diagrams below show some common glacial landforms, followed by definitions of terms most relevant to the American West.
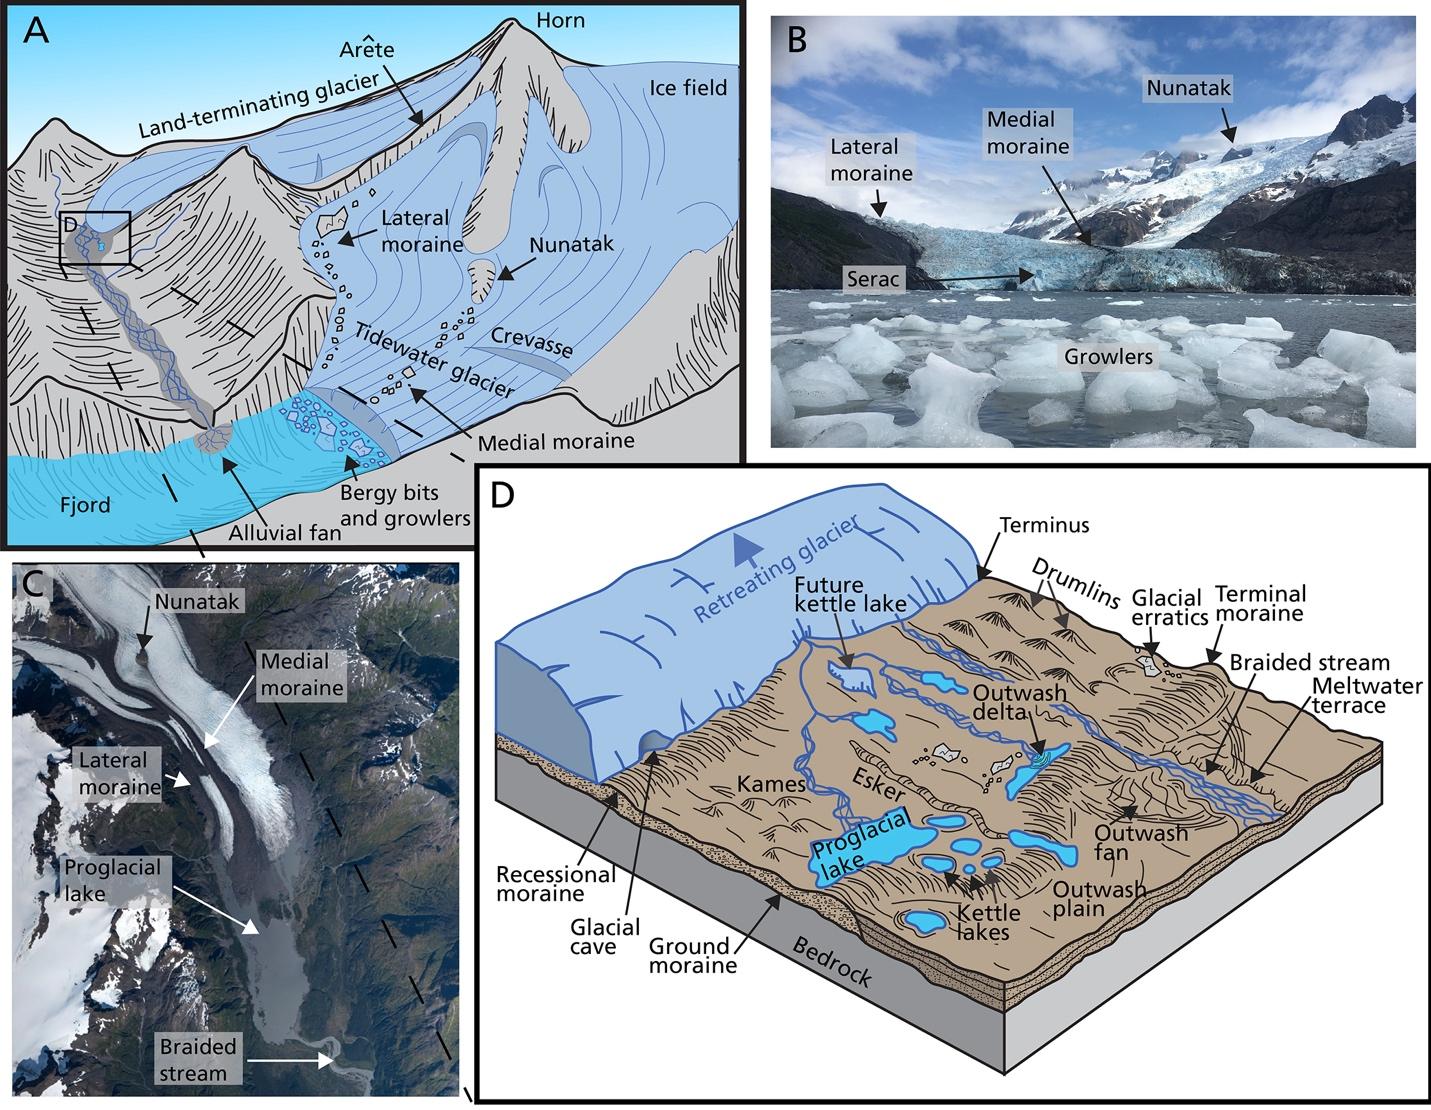
Glossary of glacier-related terms
- Arête: sharp, narrow ridge formed between two cirques or glacial valleys
- Cirque: bowl-shaped depression carved by a glacier at the head of a valley
- Col: saddle-shaped pass between peaks formed by two glaciers on either side of a ridge
- Comb: jagged ridge caused by glacial erosion
- Crevasse: deep crack in a glacier’s surface caused by stresses from the ice’s movement
- Drumlin: elongated hill of glacial sediment shaped by the flow of ice
- Esker: long ridge of stratified sediment deposited by meltwater streams flowing beneath a glacier
- Firn: snow that has been compacted and crystallized but not yet converted to glacial ice
- Glacial erratic: rock or boulder transported by a glacier far from its origin
- Glacial step: step-like formation caused by differential erosion in glacial valley
- Hanging valley: a tributary valley at a higher elevation due to glacial erosion of the main valley that often includes a waterfall
- Horn: pyramid-shaped peak formed by the erosion of at least three cirques
- Kettle lake: depression formed by the melting of a block of ice in glacial outwash
- Mass balance: the difference between the amount of snow/ice gained through accumulation and the volume of snow/ice lost through ablation (via melting and sublimation); glaciers grow due to a positive balance and shrink due to a negative balance
- Moraines: deposits of glacial sediment, including terminal (at the toe of a glacier), lateral (along the sides of a glacier) and medial (when lateral moraines join at the intersection of glaciers)
- Nunatak: a peak that protrudes above the surrounding glacier or ice sheet and is not covered by ice
- Outwash plain/delta/fan: formation created by the deposition of sediment as meltwater flows out of a glacier and deposits sand/gravel in a spreading formation
- Tarn: small mountain lake in a cirque
- U-shaped Valley: a valley with a wide, relatively flat floor and steep sides, formed by the carving of a glacier (in contrast to a V-shaped valley caused by river erosion)
Where are glaciers in the West?
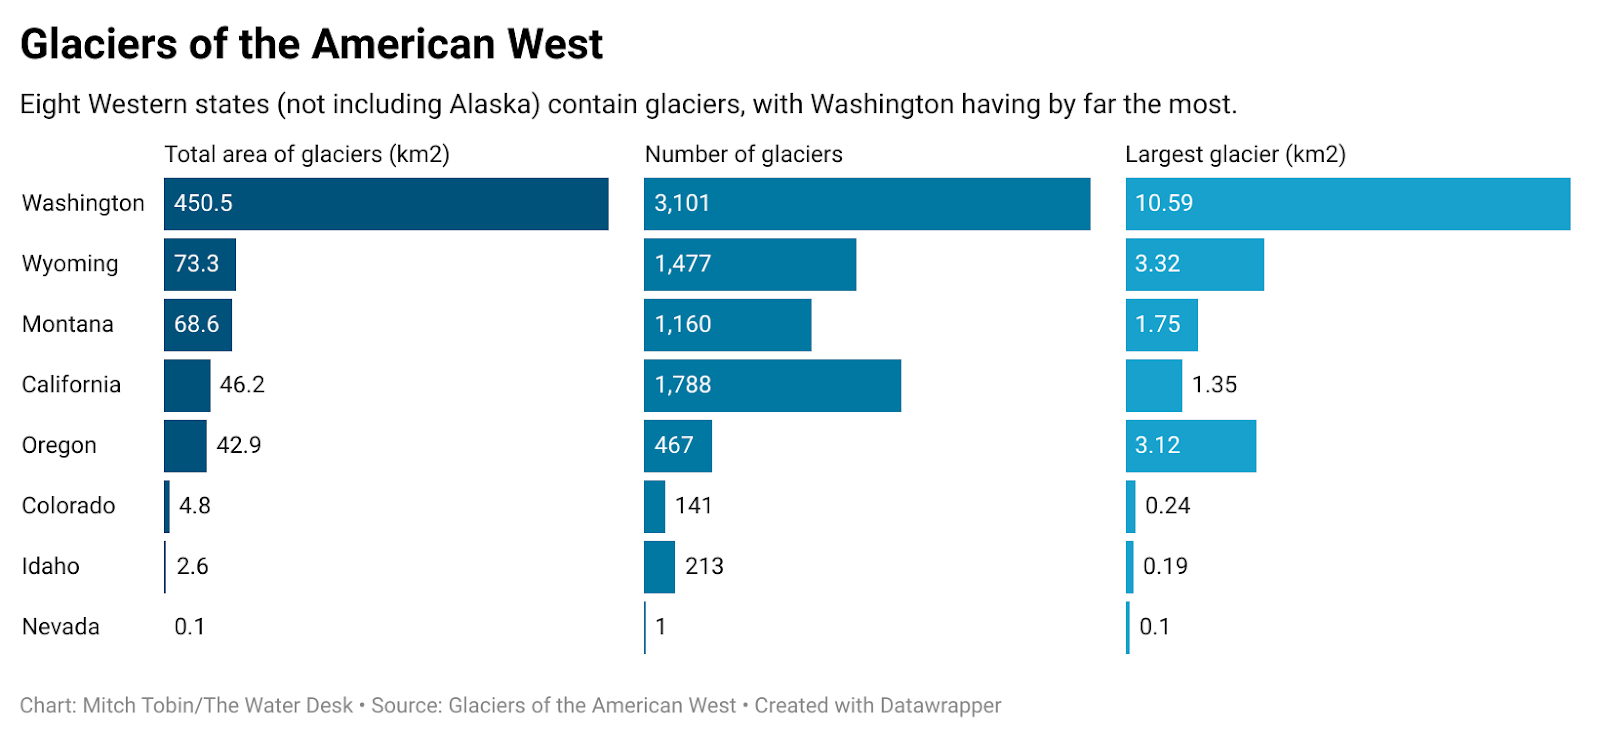
According to the Glaciers of the American West, an online resource by Portland State University researchers, there are 8,348 glaciers in eight Western states, not including Alaska, with the most by far in Washington. These glaciers and permanent icefields range from “rivers of ice on Mount Rainier that are over 8 km (5 mi.) long to tiny patches of ice in the Rocky Mountains not much larger than a city block,” according to the site.
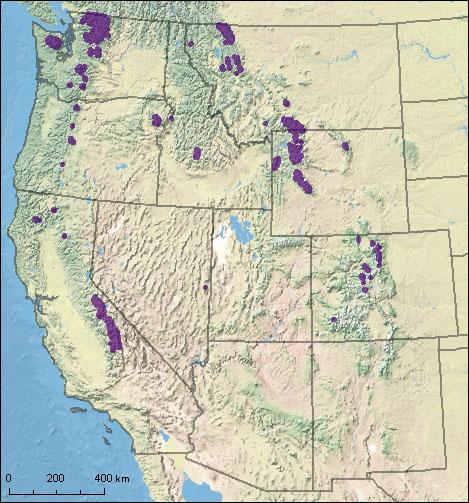
The diagram below shows the general locations where glaciers are found in the American West (not all of the purple areas are perennially frozen!).
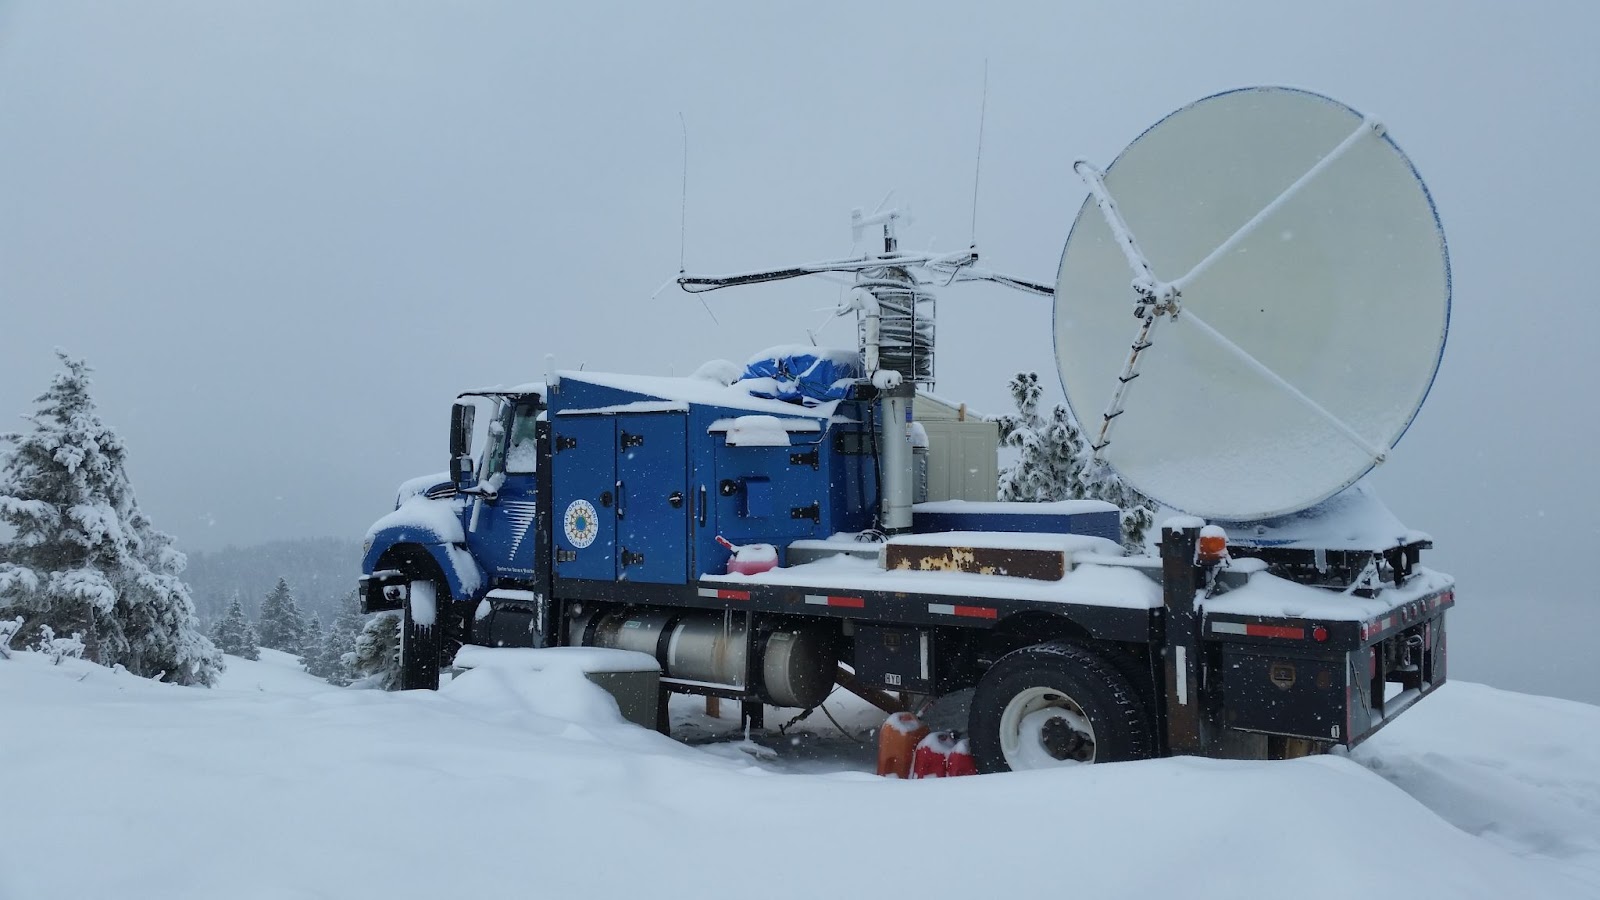
In-situ measurement and remote sensing
These are the two main ways that scientists study and monitor the snowpack (plus many other natural phenomena). In-situ measurement involves the direct collection of data at a location using instruments in the field. In the context of snow, in-situ data may be collected by hand or via the automated sensors of a SNOTEL station, such as snow pillows. In-situ data tends to be very detailed and high quality, but for manual measurements, data collection may be time/labor intensive, and with fixed SNOTEL stations, data is limited to a single point in a complex landscape.
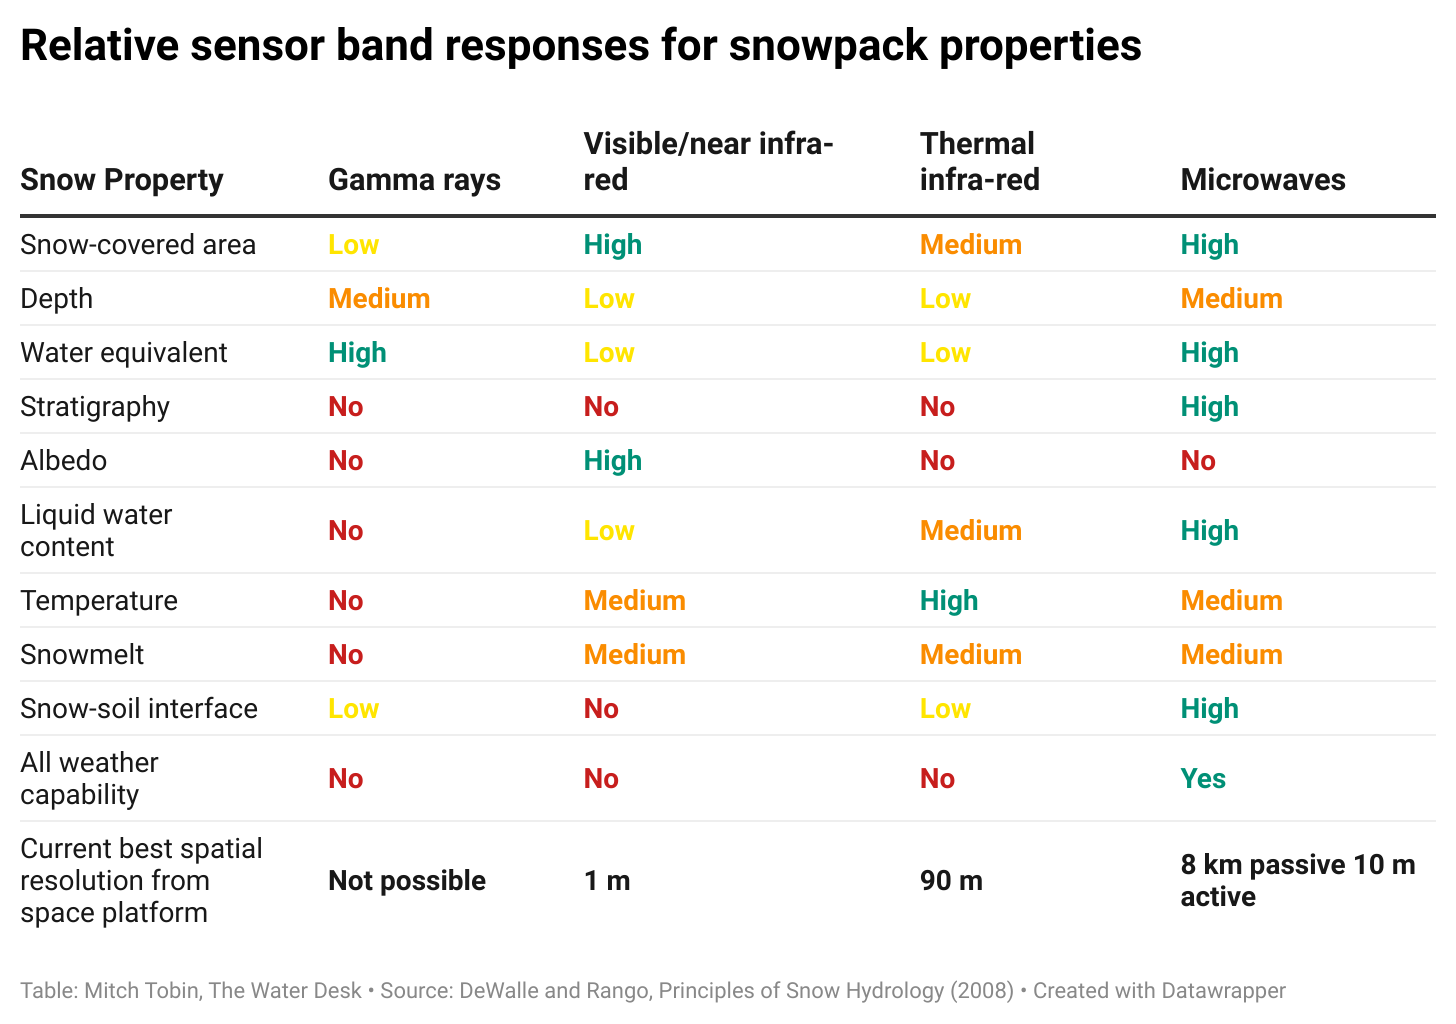
Remote sensing refers to data collected from a distance through devices such as satellites, aircraft and drones. These platforms use radar, lidar and other technologies to detect electromagnetic radiation at various wavelengths to provide data on snow cover, snow water equivalent, albedo, temperature, snow grain size, vegetation health and other measures. Owing to their remote vantage, these technologies can scan vast areas to collect data, including places that would be difficult to access, but they tend to have much lower spatial resolution and accuracy compared to measurements taken on the ground by people and sensors.
The table below shows how different bands in the electromagnetic spectrum respond to various snowpack properties.
Lake effect snow
Lake effect snow occurs when cold air moves over relatively warm water in an unfrozen lake, causing heavy, localized snowfall downwind from the water body.
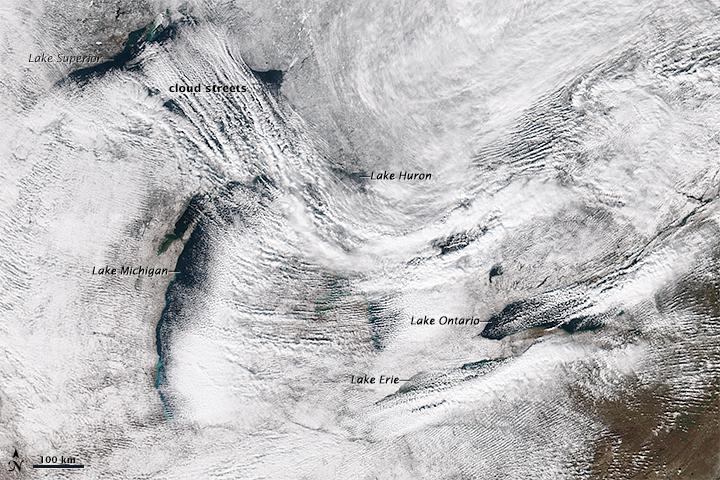
The phenomenon is best known for its effects around the Great Lakes, but a similar process also plays out in Utah around the Great Salt Lake (the Wasatch Mountains also enhance snow production due to the orographic effect).
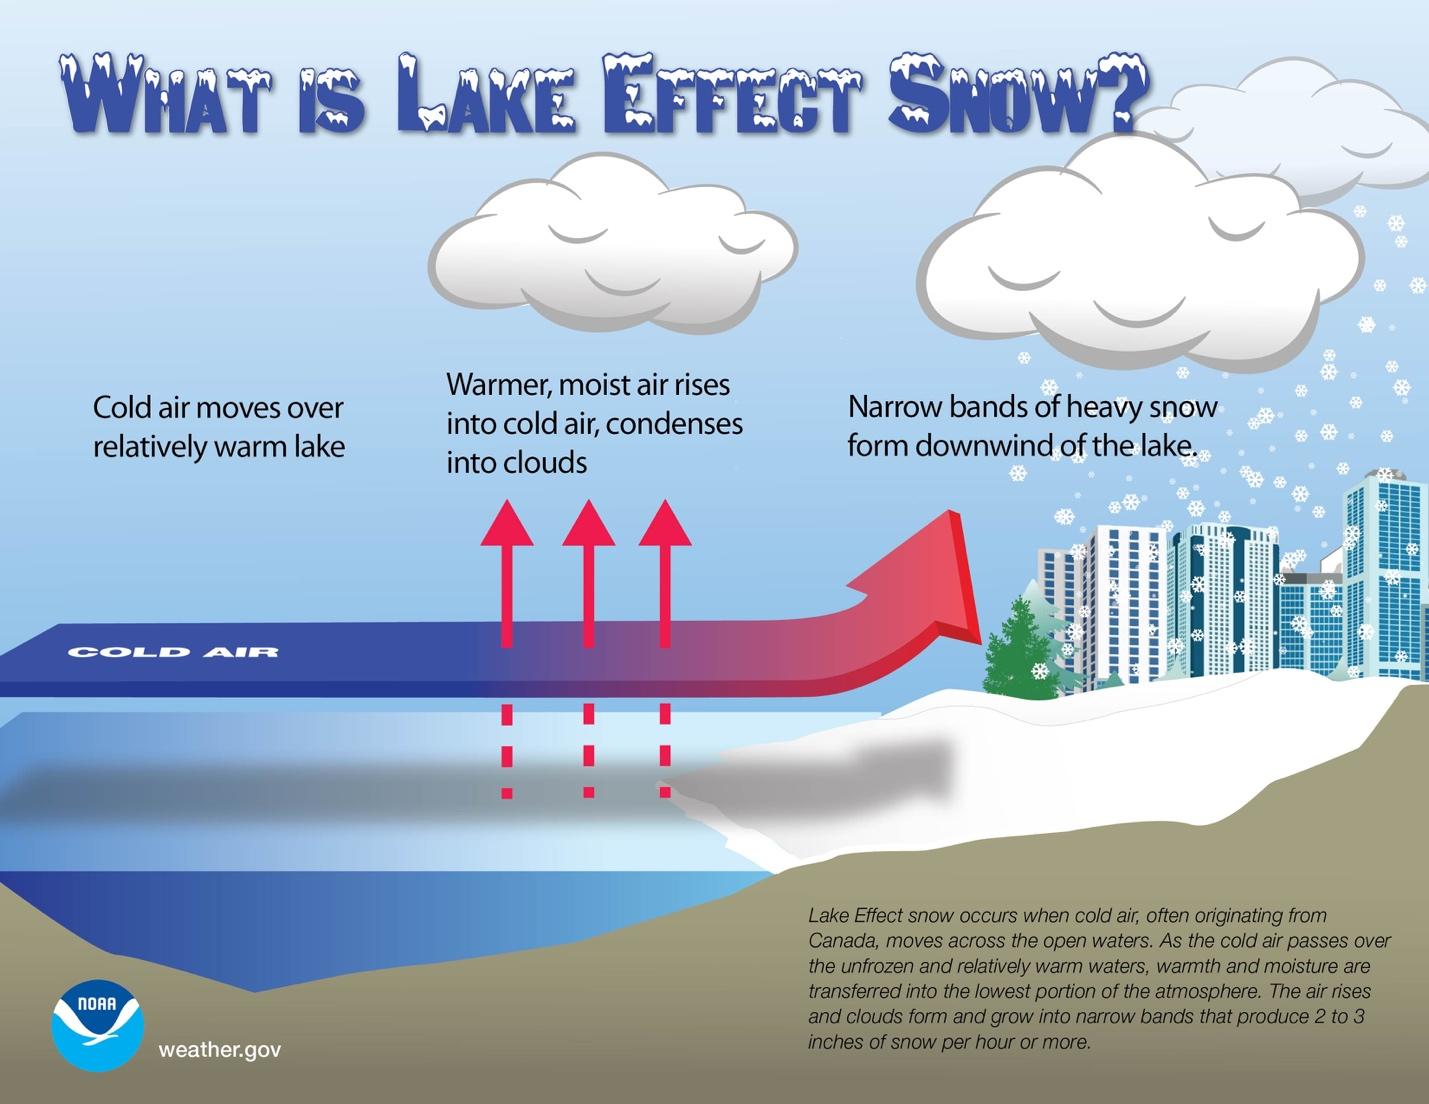
As shown in the National Weather Service graphic below, warmer, moist air from an unfrozen lake rises into the colder air passing above and then condenses to produce bands of heavy snow on the leeward side of the lake. “Lake effect snow usually occurs during the late fall and winter months and is capable of producing as much as 2-3 inches of snow an hour with event totals ranging from 60-100 inches,” according to NASA. The process is known as bay effect snow and sea effect snow when the cold air passes over those types of water bodies.
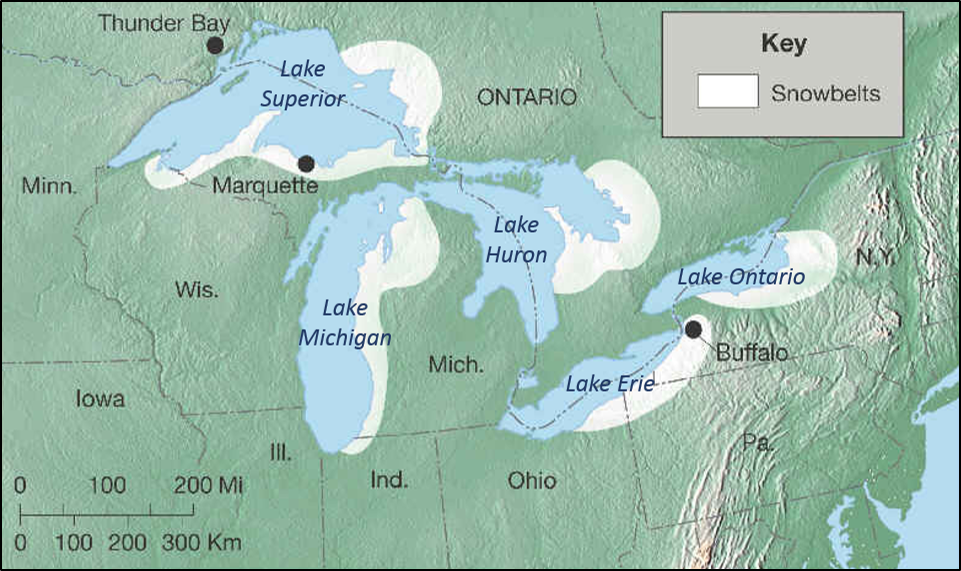
Lake effect snow is why some areas around the Great Lakes are known as “snowbelts,” as shown in the map below.
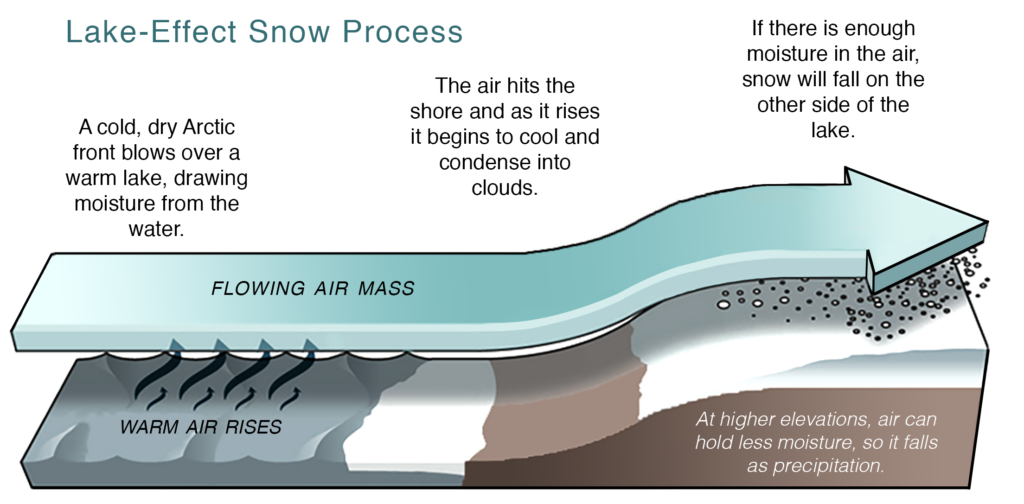
The graphic below explains how the process of lake effect snow works.
Megadrought
“Megadroughts are persistent, multi-year drought events that stand out as especially extreme in terms of severity, duration, or spatial extent when compared to other droughts of the last two thousand years,” according to NOAA’s National Integrated Drought Information System. There is no consensus on the exact definition of a megadrought, but they have been recorded throughout history on all continents except Antarctica. Scientists say the American Southwest has been in a megadrought since 2000 (sometimes referred to as the “millennial drought”).
The graphic below, from a 2022 review paper, shows where and when megadroughts have occurred in the Common Era.
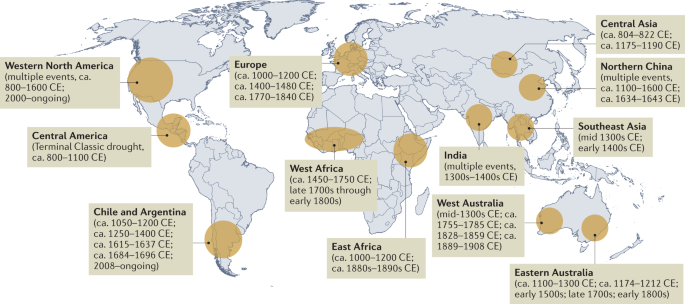
This paper suggested the following definition for a megadrought: “persistent, multi-year drought events that are exceptional in terms of severity, duration, or spatial extent when compared to other regional droughts during the instrumental period or the Common Era.”
Megadroughts can be caused by natural climate variability, but researchers also believe that human-caused climate change can exacerbate the problem by altering precipitation patterns and increasing evaporative demand.
The severity, duration and geographic extent of megadroughts can have profound impacts on the natural environment and human societies, with the collapse of several civilizations linked to these exceedingly dry times.
Some scientists also use the term aridification to refer to the long-term drying of an area and argue that the process is now transpiring in the American West. “This shift in the hydrologic paradigm is most clear in the American Southwest, where declining flows in the region’s two most important rivers, the Colorado and Rio Grande, have been attributed in part to increasing temperatures caused by human activities, most notably the burning of fossil fuels,” according to a 2020 study.
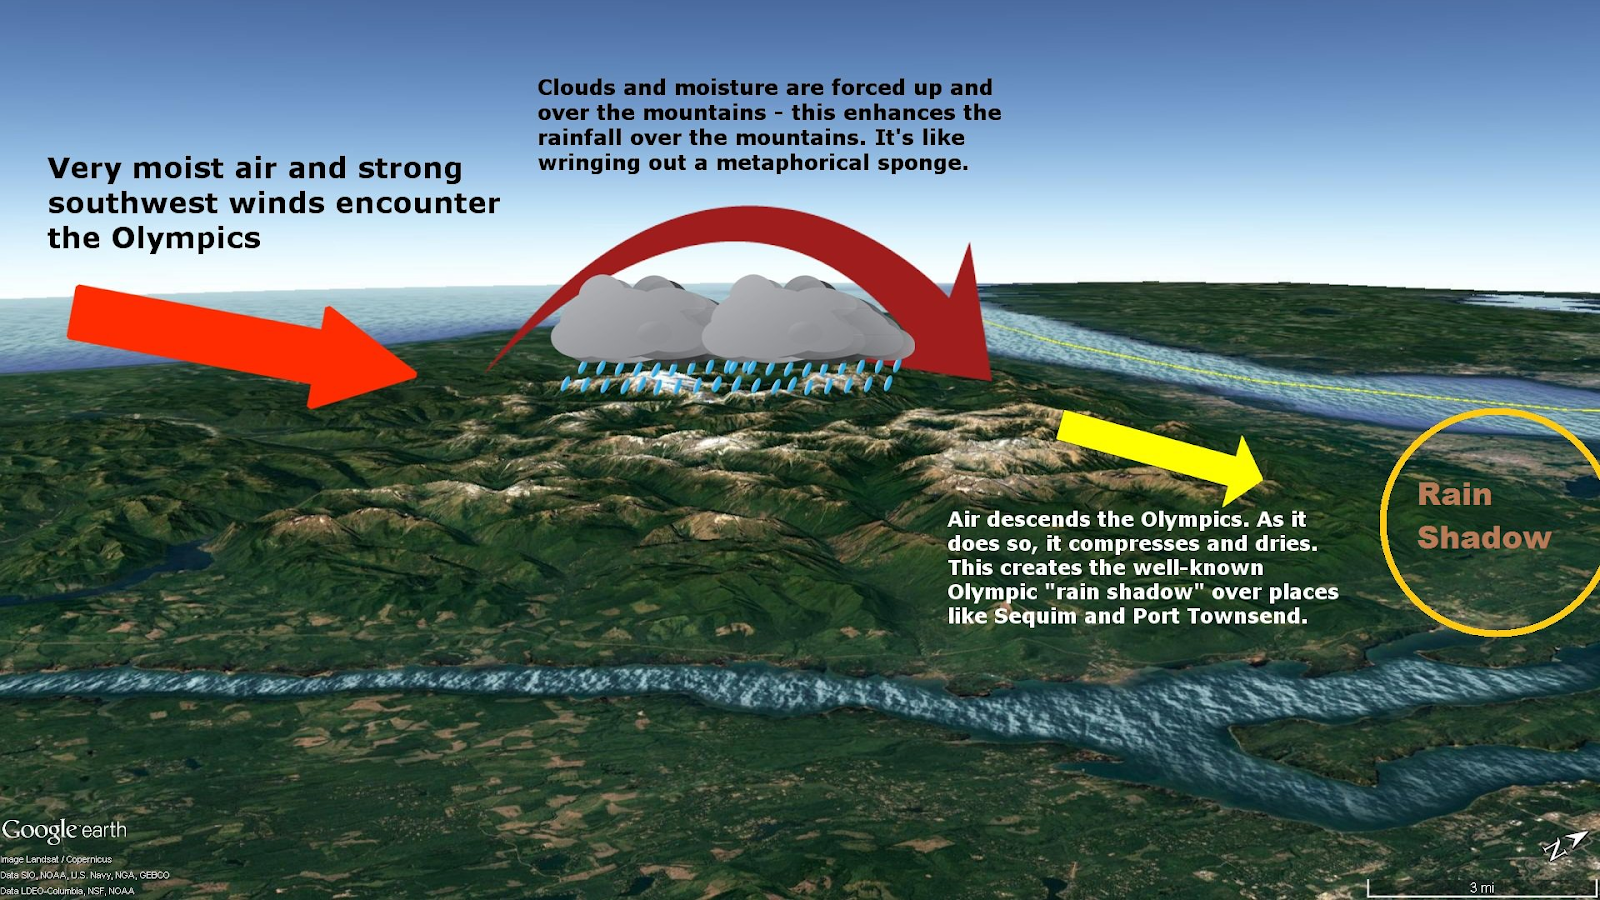
Orographic lift and the rain shadow
Orographic lift occurs when an air mass ascends a mountain range or other elevated terrain. As the air rises, it cools (due to the dry adiabatic lapse rate of 5.5°F per 1,000 feet of elevation gain). If conditions are right, water vapor will condense and precipitate as the higher terrain “wrings out” the moisture. This is why the windward sides of mountains are wetter than the leeward sides, where a drier rain shadow may occur. The American West has many classic examples of the orographic effect, such as the Sierra Nevada and Cascade Mountains receiving copious precipitation as storms move in from the Pacific Ocean while areas to the east of the mountains are very dry. Even hundreds of miles inland, precipitation generally increases with altitude and the direction of the wind hitting mountain ranges plays a major role in determining snowfall amounts. Some ski areas, for example, do better with a southwest wind while others may be favored when weather comes in from the northwest. The graphics below from the National Weather Service illustrate how orographic lift around Washington’s Olympic Mountains creates a rain shadow to the east.
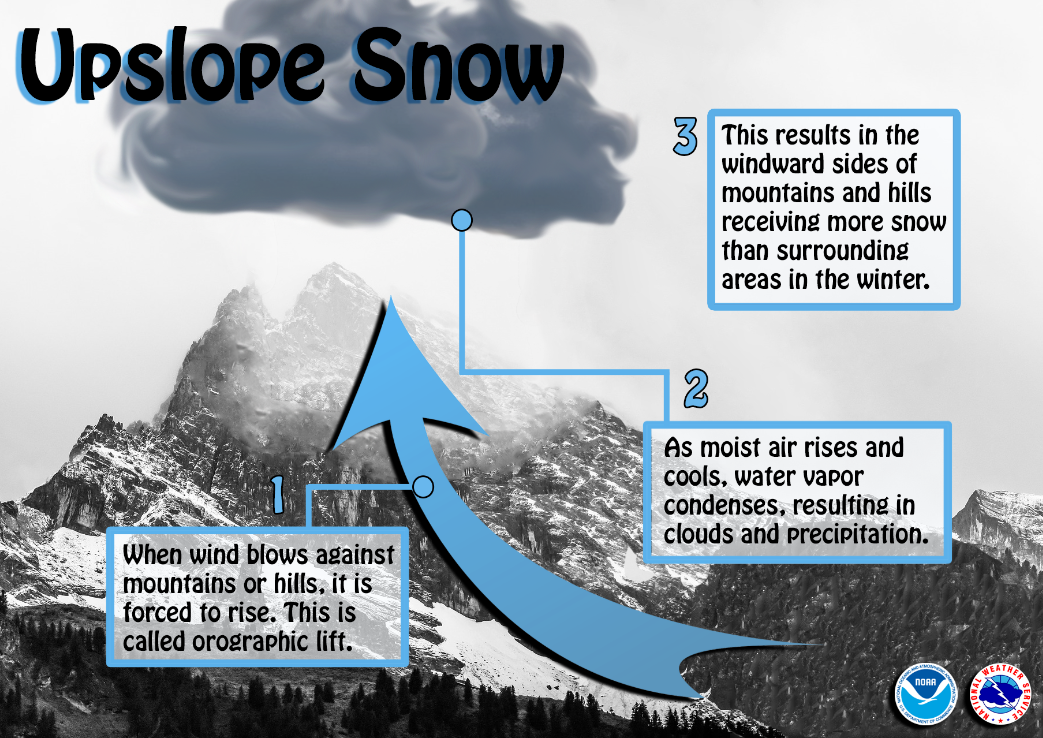
You may also hear the term upslope snow to describe the orographic effect, as shown in the graphic below. Along Colorado’s Front Range, an upslope storm refers to a system that pumps moisture from the plains westward toward the mountains, which receive copious snowfall due to the Rockies forcing the moisture-laden air upward.
Permafrost
Permafrost is a layer of soil or rock that remains permanently frozen for at least two years. Found in polar regions and high-elevation locations, permafrost is a carbon sink that releases heat-trapping greenhouse gases when it thaws. The melting of permafrost can also cause infrastructure problems and lead to rockfall in mountainous areas. “Seasonally frozen ground is near-surface soil that freezes for more than 15 days per year,” according to the National Snow and Ice Data Center. “Intermittently frozen ground is near-surface soil that freezes from one to 15 days per year.”
Polar vortex
The polar vortex is a large area of low pressure and cold air surrounding the Earth’s poles. The vortex always exists, but it gets stronger in winter and can sometimes influence the weather at lower latitudes. As shown in the graphic below, the polar vortex features a strong band of winds high in the stratosphere, around 10 to 30 miles above the Earth’s surface and far higher than the jet stream.
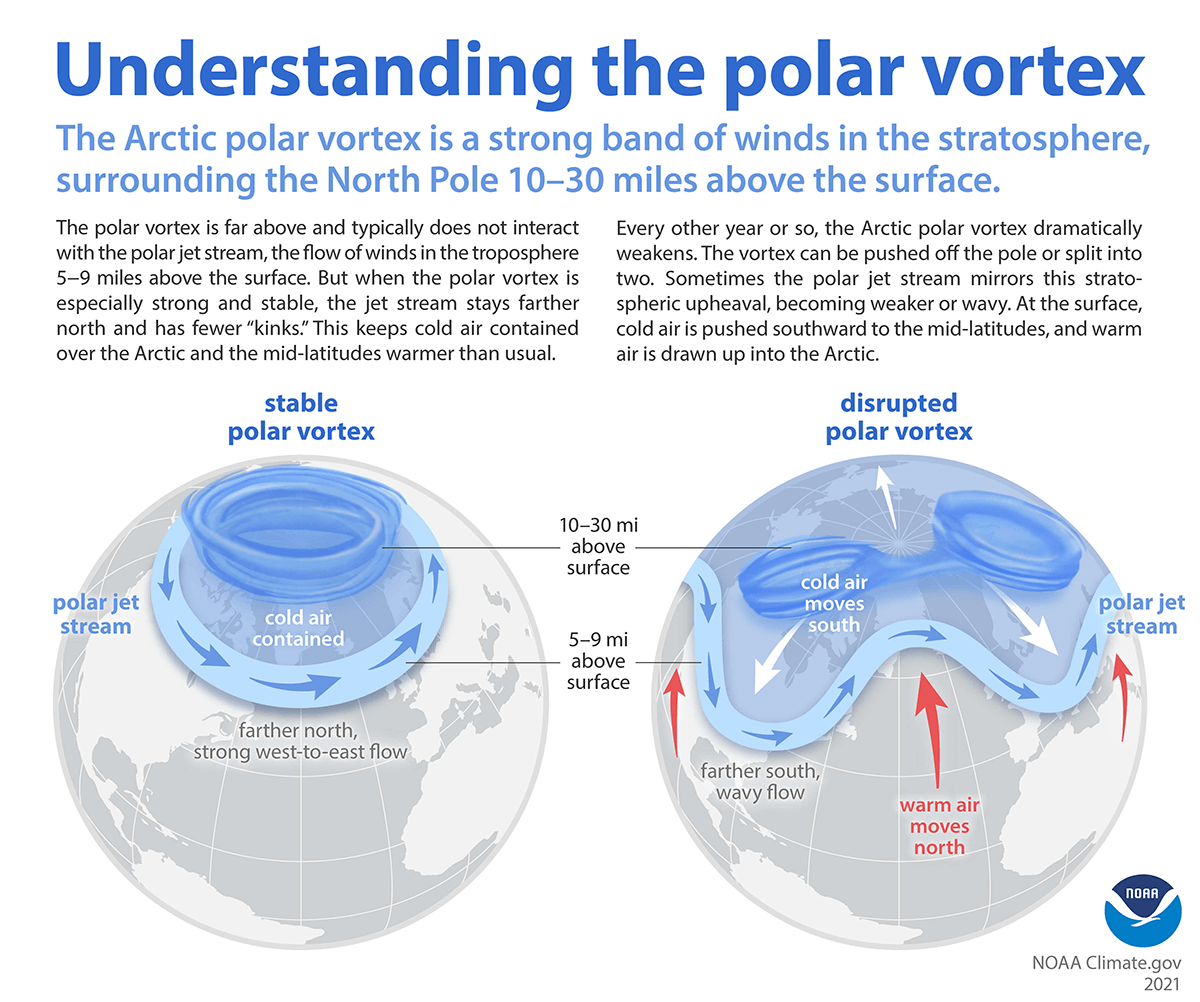
A strong and stable polar vortex contains cold air near the poles, but when the vortex weakens it can force cold air southward into the mid-latitudes while drawing warm air toward the North Pole.
The animation below shows what happened in January 2019, when the polar vortex caused frigid air to descend on the continental United States.
Rain-on-snow event
When rain falls on an existing snowpack it can lead to rapid snowmelt and flooding. A 2018 study found that rain-on-snow events are projected to become less frequent at lower elevations because of snowpack declines, especially in warmer areas like the maritime region along the Pacific Coast. At higher elevations, however, these events are expected to become more common. The greatest increase in flooding risk is projected in the Sierra Nevada, Colorado River headwaters and Canadian Rockies.
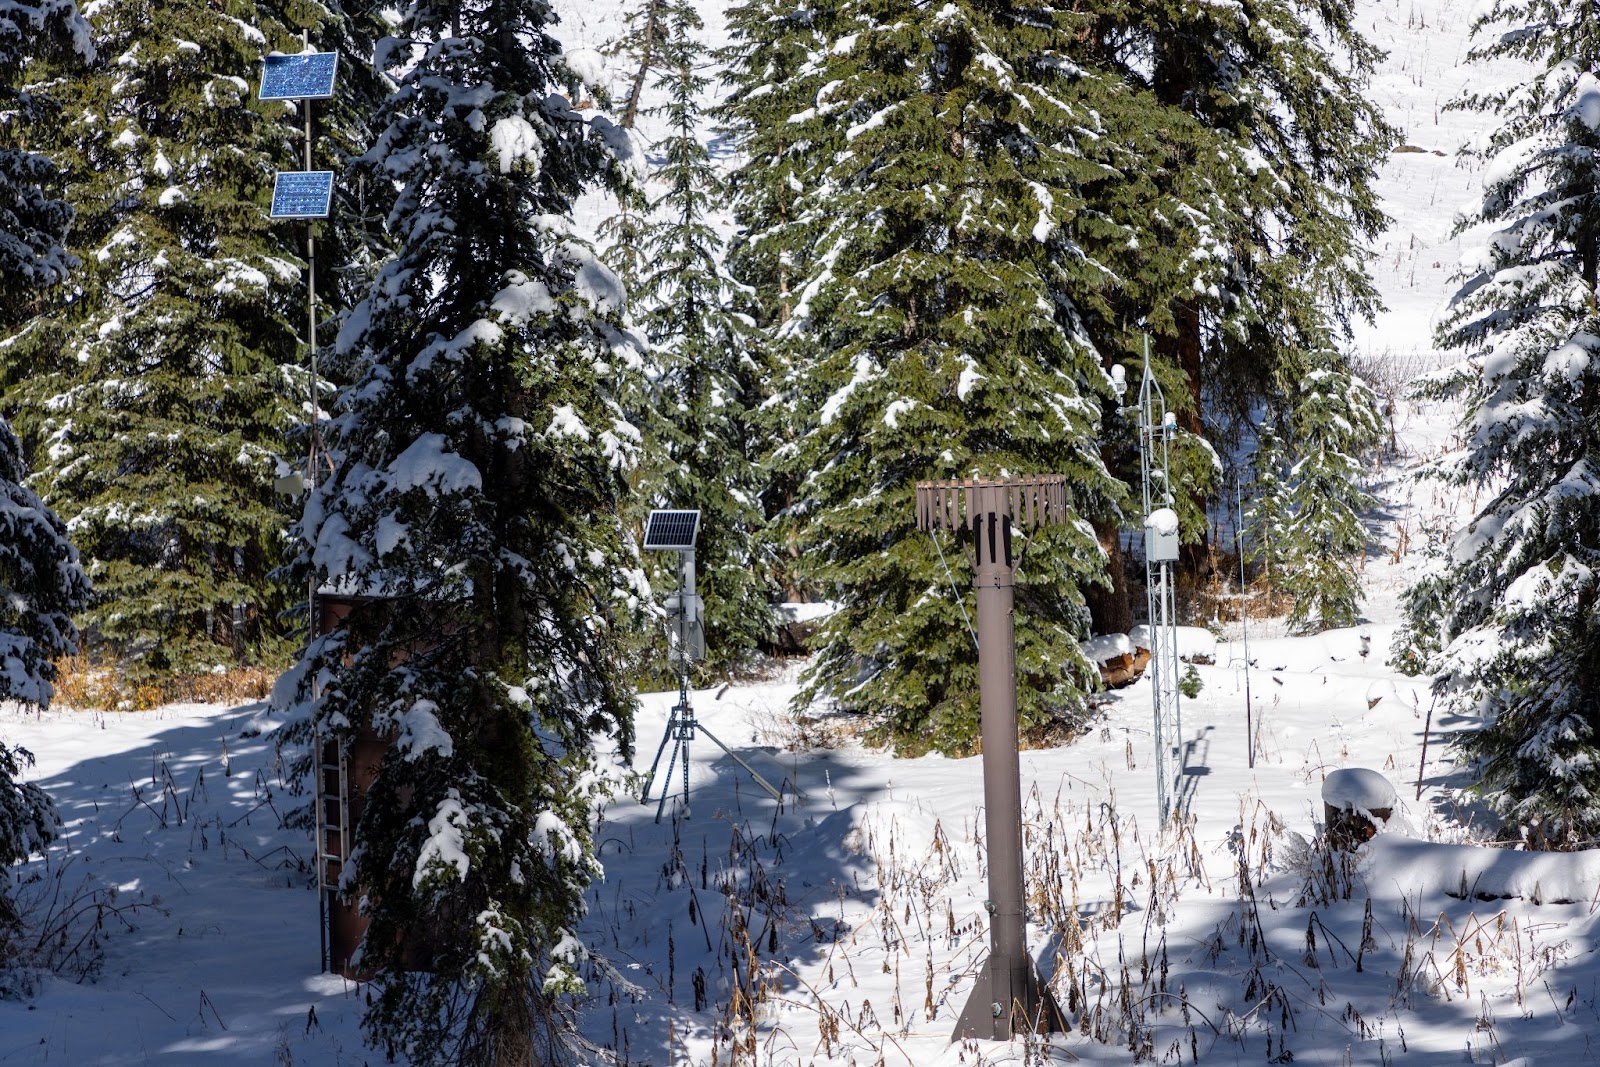
SNOTEL and snow pillows
SNOTEL (as in snow telemetry) is a network of around 900 sites that automatically measure the depth and water content of the snowpack while also providing data on temperature, precipitation and other climatic conditions. The stations use a snow pillow filled with liquid antifreeze to measure the weight of the snow above and calculate snow water equivalent (SWE), the key measure of the snow’s water content. While some stations use cellular and satellite communications, most use “meteor burst” technology to transmit their data by bouncing a radio signal off a band of ionized meteorites 50 to 80 miles above the Earth.
The photo below shows the Spud Mountain SNOTEL station on Coal Bank Pass in southwest Colorado.
Snow courses, snow samplers and aerial markers
Using skis, snowshoes, snowmobiles or even helicopters, surveyors periodically travel to snow courses and use a metal tube known as a snow sampler to collect data at a series of points along the snow course, which is typically 1,000 feet long. By pushing the aluminum tube into the snowpack until it touches the ground, surveyors can extract a snow core that is weighed to calculate snow water equivalent (see this page from the California Department of Water Resources for lots of photos and info about how these surveys are done).
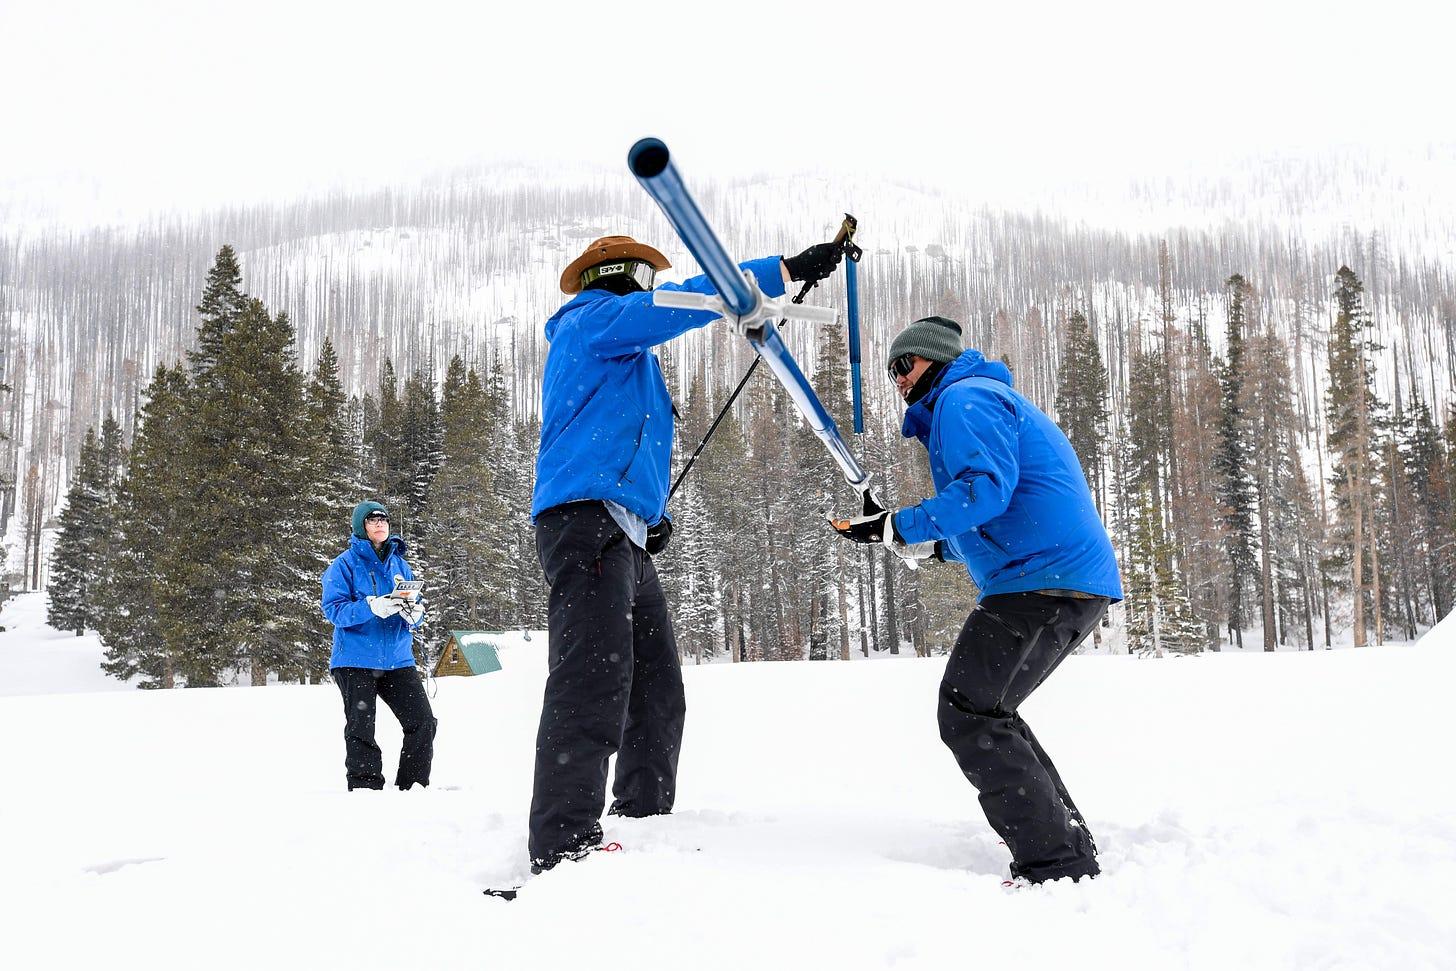
“Historically, snow course measurements were the first form of snowpack data collection, starting in 1906 when Dr. James Church from the University of Nevada measured a course he laid out on Mt. Rose near Reno,” according to the Natural Resources Conservation Service (NRCS). Before the advent of SNOTEL in the 1970s, snow courses were the main way the snowpack was measured, so the data for snow courses often go back much further in time.
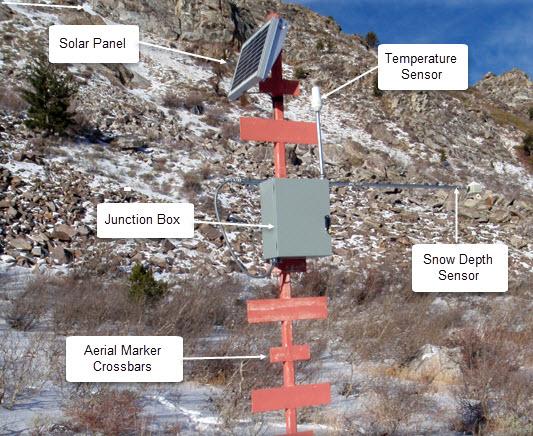
Aerial markers are another method for measuring the snowpack in very remote locations that are tough to access. These tall metal pipes have horizontal cross members that can be seen from an aircraft, allowing surveyors to measure the snow depth. With an estimate of the snow’s density, surveyors can calculate the snow water equivalent. In recent years, NRCS has outfitted some aerial markers with sensors, as shown in the photo below.
Snow deluge
A snow deluge is a relatively new term applied to the biggest snowpack seasons. Researchers define it as a year in which April 1 snow water equivalent is at least a 1-in-20-year event. California’s epic 2023 winter qualified as a snow deluge (and was a 1-in-54-year event, according to the scientists). Like atmospheric rivers, snow deluges can be both beneficial and hazardous. See this story for more on snow deluges and a Q&A with one of the researchers who defined the term.
Snow drought
A snow drought is a “period of abnormally little snowpack for the time of year,” according to the federal National Integrated Drought Information System, which reports that the American West “has emerged as a global snow drought ‘hotspot,’ where snow droughts became more prevalent, intensified, and lengthened in the second half of the period 1980 to 2018.”
A “dry” snow drought results from below-normal cold season precipitation, while a “warm” snow drought occurs when there is near-normal precipitation, but it falls as rain rather than snow due to warmer temperatures. Unusually early snowmelt can also cause a warm snow drought.
Snowpack, snow cover and snow line
The snowpack is the accumulation of snow on the ground, especially in mountainous areas. This natural reservoir stores water in the winter and releases it during warmer months, making it a key component of the hydrologic cycle. While the depth of the snowpack is of interest to skiers and snowboarders, water managers and researchers are particularly attuned to the snowpack’s water content, typically expressed as snow water equivalent, or how much water you’d get if you melted a column of the snowpack.
Snow cover refers to how much land is covered by snow at a specific time. While the simple presence/absence of snow does not provide information on the snowpack’s depth or water content, snow cover is still an important dimension of an area’s hydrology and geology. Compared to snow water equivalent, snow cover is easier to measure with a remote sensing technology such as satellite imagery. Snow cover acts as an insulator, protecting the ground, vegetation and animals while also increasing albedo by reflecting solar radiation. In the Northern Hemisphere, about half the land surface is covered in snow at the winter maximum.
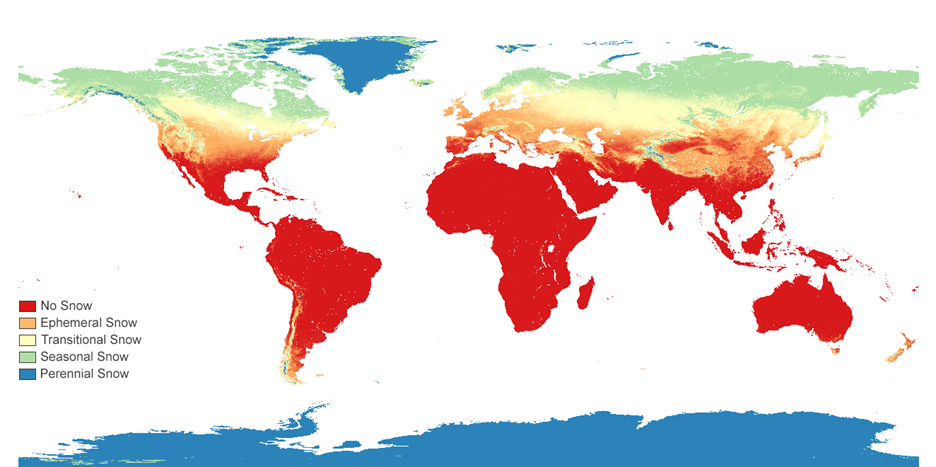
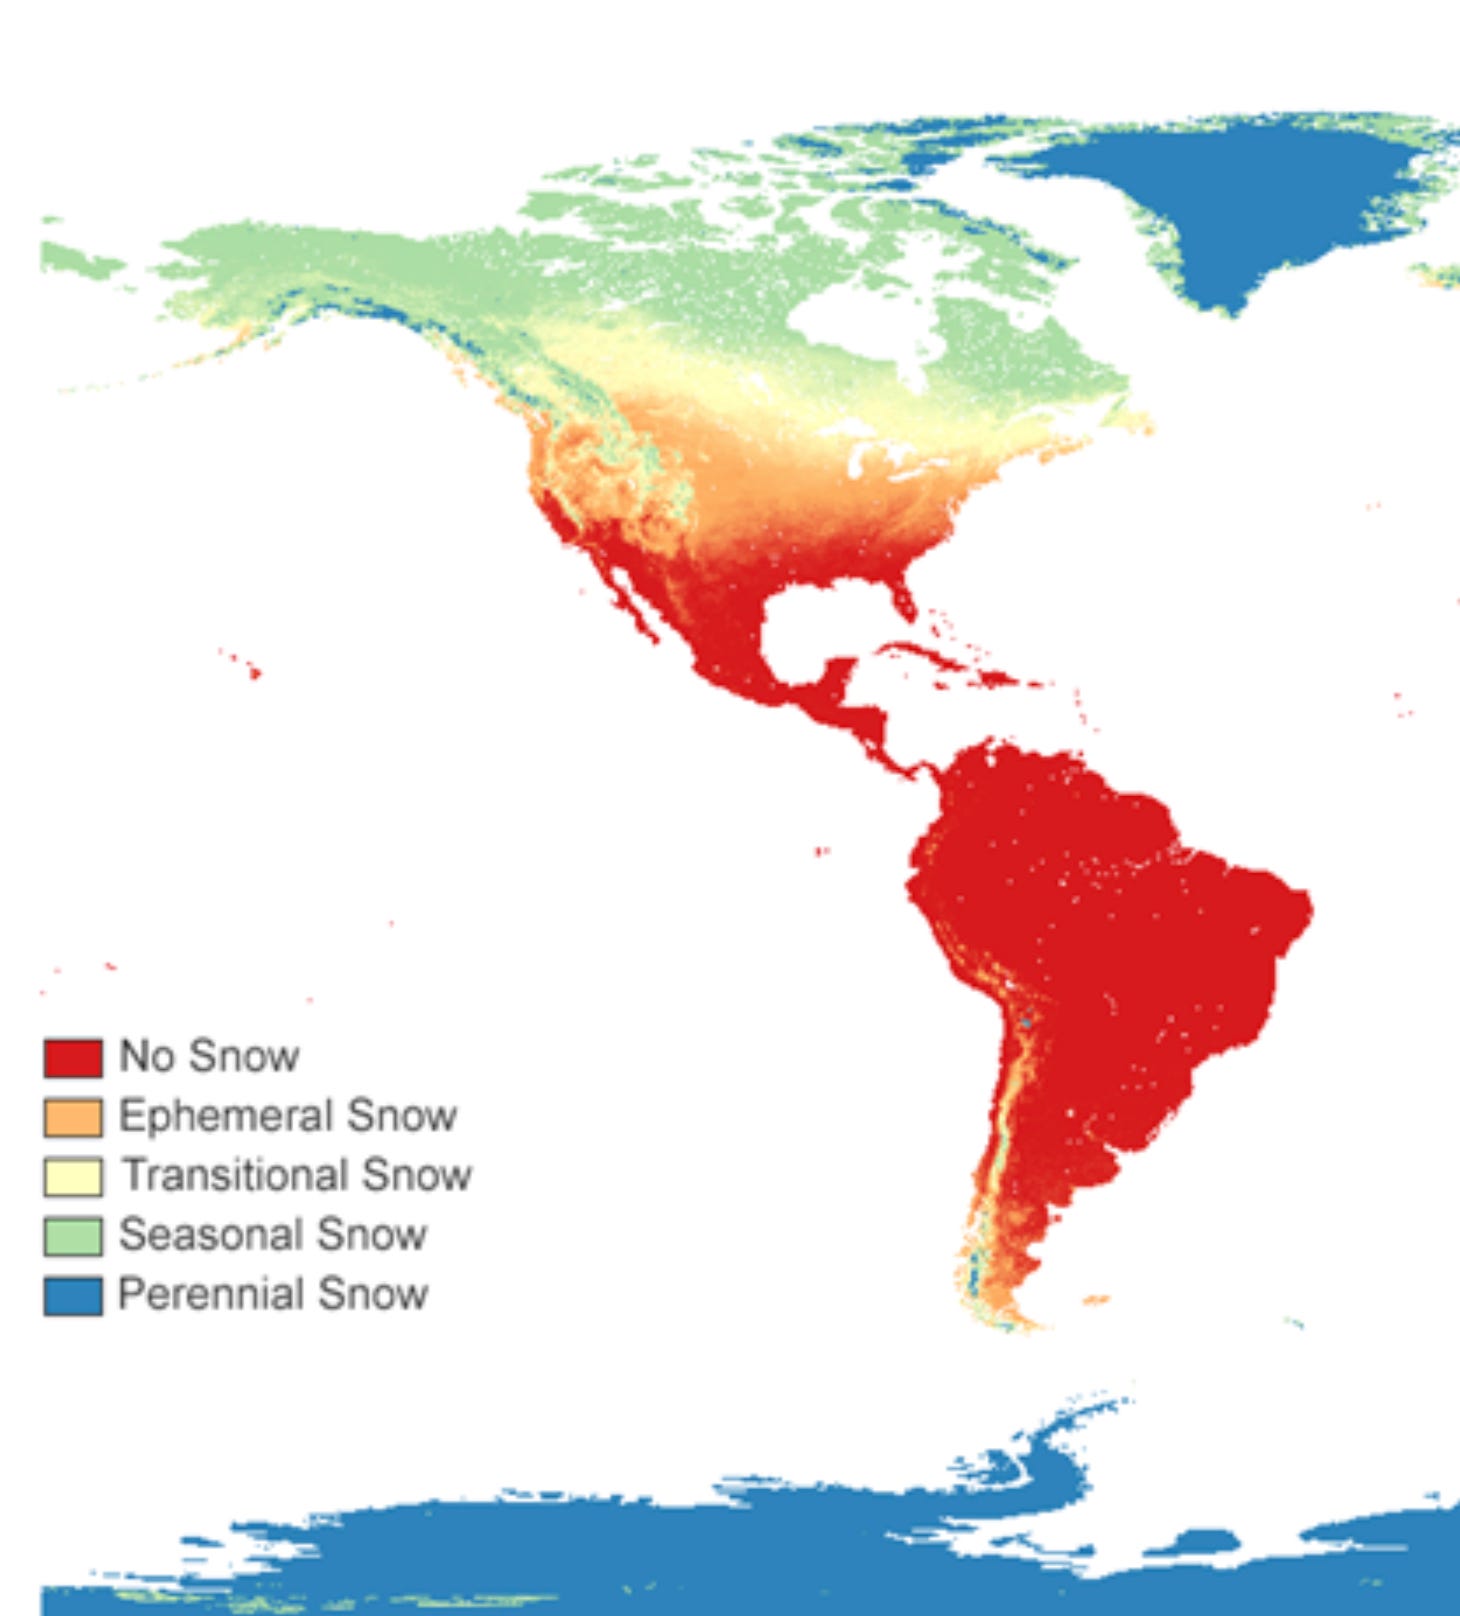
A dataset from the National Snow and Ice Data Center classifies snow cover according to five classes: 1) no snow, 2) ephemeral snow, 3) transitional snow, 4) seasonal snow and 5) perennial snow. The maps below show the classification for the world and the Western Hemisphere.


The snow line is the altitude that separates snow-covered from snow-free areas. The term may be applied in the short term to individual storms (e.g., a forecaster may predict at what elevation rain will turn to snow). At higher latitudes, the permanent snow line is the altitude above which snow remains on the ground year-round. In general, the higher the latitude, the lower the snow line. Rising temperatures due to climate change are leading to rising snow lines, which has major implications for the water supply, snow sports and alpine ecosystems. One study predicts that California’s snowline will be 1,600 feet higher by the end of the 21st century, causing lower-elevation ski areas to lose more than 70% of their natural snow.
Snow water equivalent (SWE)
Snow water equivalent, or SWE (pronounced as “swee”), is a critical measure of the snowpack’s water content. It reports how much water you’d get if you melted a column of snow. SWE is primarily captured by automated SNOTEL stations and manual measurements in snow courses, though it can also be calculated using aircraft and other technologies. This metric is of particular interest to water managers who need to know how much potential snowmelt lies above their reservoirs, dams, canals and distribution systems as they try to navigate between droughts and floods while meeting the needs of their customers.
Streamflow and hydrographs
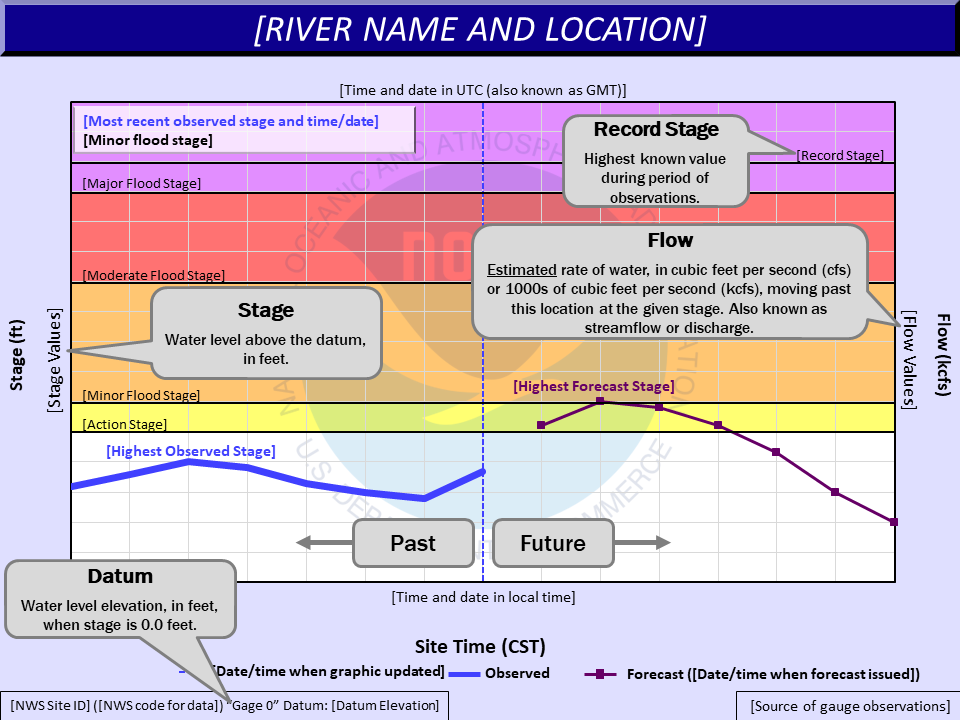
The snowpack can be hard to measure, and our observations only go back so far, but scientists have a better handle on the current and historic flow of water in streams and rivers thanks to an extensive network of gauges. Streamflow is typically measured in cubic feet per second—1 cfs is equivalent to 7.48 gallons per second and will produce about 449 gallons per minute, nearly 27,000 gallons per hour, more than 646,272 gallons per day, and almost 236 million gallons per year.
A hydrograph is a data visualization that shows the streamflow rate (also referred to as discharge) at a specific point over time. Hydrographs may also show various flood stages and include both historic data and future projections. The image below shows an example of the hydrographs produced by NOAA. See this page from the National Weather Service for definitions of terms related to hydrographs.
Other snow-related resources
To deepen your knowledge of snow-related subjects, check out these glossaries and other resources.
National Snow and Ice Data Center Cryosphere Glossary. In addition to its glossary, the center’s website provides tons of accessible information about the cryosphere. It also provides an online bibliography of books about snow, avalanches and related topics.
The American Meteorological Society’s Glossary of Meteorology. This peer-reviewed source contains definitions for more than 12,000 terms. The content is periodically updated as the science of weather evolves.
Encyclopedia Arctica Glossary of Snow, Ice, and Permafrost Terms. Thanks to the Dartmouth College Library, this technical encyclopedia is online and available for anyone to browse. The library describes it as a 15-volume unpublished reference work.
National Avalanche Center Encyclopedia. The National Avalanche Center provides an excellent glossary and encyclopedia on avalanche terminology. Created by Doug Abromeit, Bruce Tremper and many other avalanche professionals, this resource provides definitions of 74 terms along with many helpful graphics, photos and diagrams.
Snowpack Monitoring in the Rocky Mountain West: A User Guide. This 2020 report from the Western Water Assessment at the University of Colorado Boulder is an excellent guide to the region’s snowpack, how it’s monitored and how you can access data from a variety of sources.
Colorado River Basin Climate and Hydrology: State of the Science. This 2020 report is another helpful publication from the Western Water Assessment. It discusses the basin’s weather, climate and hydrology, plus how climate change is affecting the river’s flow.
SnowSlang is a personal passion project of mine that includes a master glossary and individual posts on key terms related to snow, skiing, snowboarding and the alpine environment.


