The snowpack in the San Juan Mountains as seen from Telluride ski area in southwest Colorado on March 28, 2024. Photo by Mitch Tobin/The Water Desk.
A version of this post originally appeared on Snow News on April 4, 2024.
April 1 is a big day for fools, and for the West’s water professionals.
For the region’s water wonks, April 1 is a critical date for tracking snow accumulation and projecting the subsequent runoff that will fill streams, rivers, reservoirs, aqueducts, irrigation ditches, and the taps in homes and businesses.
Snowmelt accounts for most of the water flowing in key rivers such as the Colorado and Rio Grande, and while the annual snowpack tends to max out at different times throughout the vast region, many areas peak around early April. The April 1 map below shows how river basins fared in terms of snow water equivalent (SWE), a measure of the snowpack’s water content.
Overall, conditions were above normal in southern portions of the region, below normal in northern tier states, and about average in many of the remaining locations. The map makes full use of the colors in the legend, ranging from below 50% (red) to more than 150% (deep blue) of the median for 1991 to 2020. The north-south gradient is about what you’d expect from an El Niño, which tends to tilt the odds this way, as I discussed in an earlier post.
The maps below, from the ENSO blog at climate.gov, show how this winter’s precipitation differed from the long-term average (left) and the pattern that’s expected based on prior El Niños (right).
The post’s author, NOAA’s Nat Johnson, writes there was a “reasonably good match between what we saw and the expected El Niño precipitation pattern,” but he also notes some discrepancies: “the Pacific Northwest and Northeast were considerably wetter than the expected El Niño pattern, while portions of the southern tier from southern Texas to the Southeast were notably drier.”
How did the April 1 snowpack compare to previous years? I created the graphic below using data from 2022, 2023, and 2024.
At this time last year, the snowpack was huge in many parts of the West, and even record-breaking in some locations. This year’s map isn’t as blue, but conditions are better than they were in 2022, at least in most places.
I took a glance at the April 1 snowpack maps for Western states (available here) and have included a few of them below:
Utah (looking good; I wish I hadn’t skipped skiing there this season)
It’s worth remembering that in a state like Colorado, where the snowpack supplies water to 18 other states and Mexico, the weather in April and May can play a major role in determining streamflows and reservoir levels.
In the April 4 chart below, the black line shows actual snowpack levels in Colorado since October 1, 2023, and the solid green line indicates the median from 1991 to 2020. Looking into the future, the dashed lines show a variety of possible trajectories for the snowpack in the months ahead. The dark blue and dark red lines plot the maximum and minimum projections, respectively.
Although it’s highly unlikely, the chart above shows that moving forward, the state’s snowpack could plummet and be significantly below average by May 1. Alternately, if we get hit by a bunch of storms and it stays cool, the snowpack could keep on growing into May. In other words, the story of this season’s snowpack is still in flux.
In recent years, snowpack levels in the Rockies that were around normal on April 1 have translated into below-average streamflows. Some scientists have pointed to deficits in soil moisture as the culprit for the disparity. Others are researching how warming temperatures are impacting sublimation, when snow converts directly into water vapor. A 2023 paper from Colorado State University scientists argued that spring and summer precipitation was important for explaining the discrepancy between snowpack levels and subsequent runoff.
In California, the snowpack was a mere 28% of normal on January 1, but all of those atmospheric rivers and other storms wound up delivering a statewide estimate of 110% on April 1. Recent headlines have used phrases like “unusually normal” and “average is awesome” to describe the conditions in California, where the April 1 snowpack in 2023 was 232% of normal but just 35% in 2022. The April 3 graphic below shows the northern part of the Sierra Nevada has the deepest conditions.
In a sign of the snowpack’s significance, California Gov. Gavin Newsom used the April 1 milestone as a news hook for announcing a new water plan for the state. “Newsom wore snowshoes as he joined state water managers for their final snow survey of the season,” wrote Ian James of The Los Angeles Times. “The snow was more than 5 feet deep at Phillips Station near South Lake Tahoe on Tuesday. Officials noted that nine years ago, then-Gov. Jerry Brown had stood on snowless ground at the same spot and declared a drought emergency.”
If you’d like to see interesting and detailed maps of the Sierra snowpack, check out this page from researchers at the Institute of Arctic and Alpine Research at the University of Colorado Boulder. These experimental products provide “near-real-time estimates” of SWE at a resolution of 500 meters (1,650 feet, or about 0.3 miles). They’re based on recent cloud-free satellite imagery and on-the-ground data from snow pillows and other sources.
Elsewhere in the West, warm and dry conditions have persisted in places such as Washington, Montana, northern Idaho, and much of northern Wyoming, with some SNOTEL stations reporting record-low SWE readings, according to an April 3 snow drought update from drought.gov.
On the bright side, “an active March storm track favored the Sierra Nevada, central Great Basin, and Four Corners states, where little snow drought remained by the end of March,” the update said. For the second year in a row, the April 1 snowpack was above normal in the Upper Colorado River Basin, which is crucial for filling the beleaguered Lake Powell and Lake Mead.
Panoramic view of the San Juan Mountains from Telluride ski area on March 28, 2024. The snowpack in southwest Colorado was about average on April 1. Photo by Mitch Tobin/The Water Desk.
Snow News is a free multimedia newsletter that covers the science of snow and the state of the snowpack.
The Water Desk’s mission is to increase the volume, depth and power of journalism connected to Western water issues. We’re an initiative of the Center for Environmental Journalism at the University of Colorado Boulder.
The Arkansas River and Sawatch Range near Leadville, Colorado, in March 2021. Photo by Mitch Tobin/The Water Desk.
A recent federal synthesis of climate change research paints a grim portrait of snow’s future in the American West and warns that the fast-growing region’s water supply is vulnerable.
“Climate change will continue to cause profound changes in the water cycle, increasing the risk of flooding, drought, and degraded water supplies for both people and ecosystems,” according to the Fifth National Climate Assessment (NCA5) released in November.
The congressionally mandated report concludes there is “widespread consensus” that warming will “decrease the proportion of US precipitation that falls as snow, decrease snow extents, advance the timing of snowmelt rates and pulses, increase the prevalence of rain-on-snow events,” and transform the runoff that is vital for farms, cities and ecosystems.
Climate change has already diminished the West’s snowpack, with warming global temperatures leading to earlier peaks and shorter seasons, especially at lower elevations and in areas closer to the coast.
In areas where snow is the dominant source of runoff, the volume of water stored in the snowpack may decrease by more than 24% by 2050 under some emissions scenarios, with “persistent low-snow conditions emerging within the next 60 years,” the report said.
“When we have less snow in the West, it can strain our water supplies,” said report co-author Steph McAfee, regional administrator of the U.S. Geological Survey’s Southwest Climate Adaptation Science Center. “We’ve tended to rely on the snowpack as a reservoir that didn’t need to be built and it doesn’t need to be maintained, so it’s been a key place for storing water. Having less snow directly means less water stored for use in the summer.”
NCA5 stresses that climate change’s reshaping of the water cycle and other impacts will exacerbate inequalities in U.S. society and pose a special threat to some marginalized communities.
“All communities will be affected,” the report said, “but in particular those on the frontline of climate change—including many Black, Hispanic, Tribal, Indigenous, and socioeconomically disadvantaged communities—face growing risks from changes to water quantity and quality due to the proximity of their homes and workplaces to hazards and limited access to resources and infrastructure.”
NCA5 describes itself as the federal government’s “preeminent report on climate change impacts, risks, and responses,” though it is required to steer clear of policy prescriptions.
The report is based on the latest science, but it is produced for decision-makers and the general public, so it is written in relatively accessible language, and data visualizations play a leading role in communicating the findings.
Below I use 10 visuals from NCA5—mostly maps but also charts, an infographic and a photo—to help summarize the report’s conclusions about climate, snow and water in the West, focusing on the more arid parts of the region.
Climate, snow and water
At one level, the story of snow and climate change is simple: in order for snow to fall and stick around, it has to be cold enough, so the warming of the planet is generally bad news for snow.
“I think the changes to snow and snowpack are changes that we have more confidence in than just about any other water parameter because of the direct effect of warming on snowpack and snow precipitation,” said Elizabeth Payton, NCA5’s Water Chapter Lead and a water resources specialist at the Western Water Assessment at the University of Colorado Boulder.
Co-author Ben Harding, senior water resources engineer at Lynker, summed up the report’s findings on snow this way:
“We’re going to see shorter periods of time with snow on the ground, the snow will start to accumulate later and it’ll start to melt earlier,” he said.
A smaller snowpack, a curtailed snow season and a new runoff regime will test the region’s complex water infrastructure of dams, aqueducts and canals, many of which were built in the early to mid-20th century, before climate change was recognized as a peril. The altered snowpack will also strain the West’s water laws and policies, many of which emerged in the 19th century, before some Western states were even admitted to the union.
But while climate change has already shrunk the snowpack in most parts of the world and will continue to take a toll as temperatures climb, there are exceptions that buck the trend. Total global precipitation is expected to increase due to warming, including in places where the snowpack shrivels. NCA5 predicts there will be worse droughts and floods.
For example, atmospheric rivers, which are pivotal for the West’s snowpack and water supply, are expected to strengthen in the years ahead. But beyond a certain point, warming makes it more likely that rain will fall instead of snow, even high in the mountains, raising the risk of flooding and a subpar snowpack.
As temperatures keep rising, increasing rates of melting and evaporation will play a key role. Another critical factor is how much moisture gets sucked up by plants and then transpired into the atmosphere. Some snow never becomes snowmelt and is “lost” to the atmosphere through sublimation, moving directly from the solid to the gaseous phase. Soil moisture is yet another essential element of the water cycle, impacting drought, flooding, agriculture and ecosystems.
But that’s not all. In Colorado, for example, dust-on-snow events are a big deal because the darker material reduces the snow’s reflectivity and causes it to absorb more heat, accelerating the meltout. Climate change threatens to worsen the dust problem as it continues to aridify parts of the West.
Warming is adjusting the dials on all of these factors, and the magnitude of these changes matter, but there’s yet another crucial dimension: timing. In spring, farmers, water managers and dam operators not only care deeply about the volume of the snowpack that will fill reservoirs, canals, ditches and pipes, but also are keenly interested in when that water will be entering the system.
“Having a pulse of snowmelt at the beginning of the growing season has been helpful to farmers and ranchers, and the timing of the snowmelt has been something that ecosystems have evolved to adapt to,” Payton said. “The timing is going to be shifting dramatically.”
Warming has already taken a toll on the West’s snowpack
While much of NCA5 focuses on the future, the report also looks back at how climate change has already transformed the nation. The graphic below depicts how the West’s snowpack has shifted in recent decades, with red circles indicating declines, blue circles showing increases and the circle scaled to the size of the change.
The figure’s title says it all: “Western snowpack is declining, peak snowpack is occurring earlier, and the snowpack season is shortening in length.”
Map “a” shows changes in the volume of the snowpack on April 1, a key date for water managers as they plan for the runoff season. About 93% of sites have experienced a decrease in April 1 snowpack since the 1950s, with the decline averaging about 23%.
Map “b” concerns the timing of the snowpack’s peak, which has come nearly eight days earlier on average since 1982.
Map “c” presents data on the length of the snow season, which has decreased by 18 days on average over the last four decades.
(For more on these maps, including the underlying data, see this page from the Environmental Protection Agency.)
While the vast majority of circles in the figure are red, there are also some blue locations, such as in north-central Colorado. When I asked NCA5 co-authors about those sites, several noted that many of them lie at higher elevations—like those along the Continental Divide in Colorado—and the naturally colder conditions there can help preserve their snowpack in a warming world, up to a point.
“There are some parts of Alaska or some very high elevations that might have more snow when the snowpack is at its largest,” McAfee said. “They’re starting out really cold, so if it warms up some, it’s still cold enough to snow. If it warms up enough, then there’s the possibility for snow melting earlier or more of those storms bringing rain than snow.”
While some high-elevation locations may see their snowpack increase in coming years, it’s “by and large definitely not enough to compensate or offset the widespread losses in snow that are occurring everywhere else,” said co-author Justin Pflug, a scientist at the University of Maryland and NASA Goddard Space Flight Center.
How much warmer it gets will be crucial for the snowpack (and much else)
One of the challenges in producing a report like NCA5 is the uncertainty surrounding future greenhouse gas emissions. Innovation, geopolitics, consumer preferences and more make it hard to predict how rapidly the economy will decarbonize. As a result, scientists must use varying emissions scenarios, and it remains to be seen just how much temperatures will rise at a global level.
While the rate of future warming is uncertain, one thing that’s clear is that some parts of the planet will warm more than others and have already experienced much steeper temperature increases.
The graphic below, which maps the projected change in temperatures at various levels of global warming, shows that the effects are expected to be uneven across the United States. For example, at 2°C of global warming, parts of the Interior West would be more than 5°C warmer. Across the globe, researchers have found “growing evidence that the rate of warming is amplified with elevation,” according to a 2015 paper in Nature Climate Change.
Locations in Alaska would be even hotter than that, mirroring a global trend of much more rapid warming in the Arctic. A 2022 study in Communications Earth & Environment is titled “The Arctic has warmed nearly four times faster than the globe since 1979.”
“One of the key messages for us in the water chapter is that temperature really matters for water,” McAfee said. “Temperature influences whether or not we get rain or snow. It influences when the snowpack melts. It influences how big a sip the atmosphere takes from the water and all of that. So we can’t think about precipitation and we can’t think about our water systems separate from temperature.”
When people hear about droughts and water shortages, they naturally think of a lack of precipitation, which remains the primary driver of such dry times. But as NCA5 notes, “higher temperatures can cause drought to develop or become more intense than would be expected from precipitation deficits alone.”
In a “hot drought,” the atmosphere demands more moisture and desiccates the landscape. Warmer temperatures also contribute to “snow droughts” (discussed below), “flash droughts” that develop in a matter of weeks and “megadroughts” that can extend over decades.
NCA5 also emphasizes two other messages related to temperature: the degree of change matters greatly, and how hot the planet gets depends on the choices society makes now.
“The more the planet warms, the greater the impacts—and the greater the risk of unforeseen consequences,” according to the report. “While there are still uncertainties about how the planet will react to rapid warming and catastrophic future scenarios that cannot be ruled out, the future is largely in human hands.”
Climate change is projected to increase global precipitation, but not necessarily in the Southwest
Scientists and their models can paint a much clearer picture of how temperatures will change compared to the projections for precipitation. That said, global warming is expected to increase overall precipitation on the planet because there will be higher evaporation rates and warmer air can hold more moisture.
The figure below shows projected changes in annual precipitation according to four different levels of warming, with greens indicating increases and browns depicting decreases. The hatching shows areas where 80% or more of the models agree on whether precipitation will increase or decrease.
Most of the country is expected to see more precipitation overall, with higher levels of warming generally leading to wetter conditions and more certainty about those changes. But in all of the maps, precipitation is expected to decrease in Southern California, much of Arizona, New Mexico and Texas, plus portions of Colorado.
“Precipitation changes also scale with global warming, but these projections vary by location and are less certain than temperature changes,” according to NCA5.
Payton said “there’s not a very strong signal” for total precipitation changes for the Southwest. “The atmosphere can hold more moisture when it’s warmer,” she said, “but that moisture has to come from somewhere, so over the Southwest, where it’s already dry, is it going to be able to suck up that additional amount of moisture that it can hold?”
While precipitation projections are cloudier, Westerners should expect a shift from snowflakes toward raindrops in many parts of the region: “it is virtually certain that less precipitation will fall as snow, leading to large reductions in mountain snowpack and decreases in spring runoff in the mountain West,” according to NCA5.
Overall, NCA5 concludes that “changes in future precipitation and temperature are expected to exacerbate drought across large portions of the US,” with projections showing “the strongest drying signal occurring in the Southwest.”
While drought and water scarcity are dominant themes in more arid parts of the West, these areas also contend with floods that can turn dry washes into raging torrents in a flash and threaten both lives and property.
“Warmer air is thirstier air, and that really raises the risk of higher-severity precipitation events,” Pflug said.
Flooding can also be caused by snowmelt, especially in years with a big snowpack, rapid thawing in spring or when it rains on top of snow.
“Due to climate change, snowmelt-driven flooding is expected to occur earlier in the year due to earlier runoff,” the report said. “Moreover, atmospheric rivers, which have driven much of historical flooding in the region, are expected to intensify under a warming climate.”
The graphic below shows the importance of atmospheric rivers to extreme precipitation in the Pacific Northwest, especially in winter (see my previous post for more on climate change and atmospheric rivers).
The West’s snowpack will store less water and runoff will change
The maps below depict how warming temperatures and changing precipitation patterns are expected to influence three crucial variables in the Southwest’s water cycle, with the top row of maps showing projections for 2036-2065 and the bottom row showing 2070 to 2099, both relative to the 1991-2020 period.
The leftmost maps show projected changes in soil moisture, a critical factor for agriculture and a host of ecological processes. While drier soils are expected in many parts of the Southwest, and especially in portions of the Four Corners states, other areas are expected to see increases in soil moisture.
The center maps depict projected changes in the maximum volume of snow water equivalent, a measure of the snowpack’s water content. Whereas the soil moisture picture is somewhat muddled, the story for snow is crystal clear: steep declines throughout the region, and especially in California’s mountains.
The rightmost maps show expected changes to runoff—the water that reaches streams, rivers, lakes, reservoirs and taps. As with soil moisture, the projections vary by location but many of the highest-elevation areas, such as the Sierra Nevada, the Southern Rockies and Utah’s Wasatch Range, are expected to see decreases in runoff.
The report’s co-authors stressed that the interactions between soil moisture, snowpack and runoff are complicated, and there is still considerable uncertainty about future precipitation patterns. With soil moisture, for instance, earlier snowmelt may lead to wetter conditions in spring but drier conditions later in the summer.
Because the changes will vary across the country, people should “look at results and data and projections for their own region and not necessarily take a message from elsewhere and assume that’s what’s happening where they live,” McAfee said. “Climate change will have different impacts in different places. So the fact that we might be concerned about reduced water supplies in the Colorado River doesn’t necessarily mean we have the same concerns in every river basin.”
In the Colorado River Basin, research has shown that “less snow means more evaporation, and this is because snow is really reflective,” McAfee said. “Anyone who’s ever been out skiing knows this: you can get that reflection up and the nose and chin sunburn, and if the snowpack melts early, the land gets more energy, which makes it possible to evaporate more water from the soils and streams and for the plants to get going earlier.”
One challenge for scientists and water managers is that it’s tough to calculate how much snow is out there. Snow accumulation can vary dramatically on a single run at a ski resort, not only from top to bottom due to thousands of feet of elevation difference, but even from one side of the run to the other due to trees, shading, rocks and wind.
Another vexing problem is tracing what happens to all those H20 molecules after they’ve fallen to earth.
“There’s still some uncertainties about where the snow is going hydrologically,” Pflug said.
In recent years, peak snowpack levels in the Rockies that were around normal have translated into below-average streamflows. Some scientists have pointed to deficits in soil moisture as the culprit for the disparity. Others are researching how warming temperatures are impacting sublimation, when snow converts directly into water vapor. A 2023 paper from Colorado State University scientists argued that spring and summer precipitation was important for explaining the discrepancy between snowpack levels and subsequent runoff.
Here’s how NCA5 sums up the situation for the Colorado River, which supplies some 40 million people in seven U.S. states and Mexico while also irrigating millions of acres of crops:
“Colorado River streamflow over the period 2000–2014 was 19% lower than the 20th-century average, largely due to a reduction in snowfall, less reflected sunlight, and increased evaporation. The period 2000–2021 in the Southwest had the driest soil moisture of any period of the same length in at least the past 1,200 years. While this drought is partially linked to natural climate variability, there is evidence that climate change exacerbated it, because warmer temperatures increase atmospheric ‘thirst’ and dry the soil. Droughts in the region are lasting longer and reflect not a temporary extreme event but a long-term aridification trend—a drier ‘new normal’ occasionally punctuated by periods of extreme wetness consistent with expected increases in precipitation volatility in a warming world.”
Some rural and Indigenous communities are especially vulnerable to the changing water cycle
The consequences of a thinner, less reliable snowpack and changing runoff patterns will be far-reaching, but they will be especially problematic for some rural communities dependent on farming and snow-related recreation.
The infographic below illustrates some of the downstream effects on agriculture, with snow droughts contributing to the stresses facing the sector and its workers. Reduced snowmelt for irrigation may cause farmers to lose money, generate more dust that harms both farmworkers and the snowpack, and lead to increasing use of dwindling underground aquifers as agriculture shifts from surface water to groundwater.
While the graphic above focuses on agriculture, climate change will also affect the water supply for cities, suburbs and businesses, plus the innumerable species that have evolved to depend on the snowpack and snowmelt.
Farmers who rely on direct flows from the river may have very senior water rights, but often they lack reservoirs to store the water, so as climate change shifts precipitation from snow to rain and starts the runoff season earlier, these water users—plus fish and other wildlife—face a growing risk of shortages later in the year.
“For communities that have storage rights, they’re less sensitive to the loss of snowpack if you still are getting precipitation in some form or another,” Payton said. “There are a lot of people and communities in the West who are just living on the edge, and they don’t have the storage, they don’t have the infrastructure to take advantage of when it’s there and are very much dependent on the regime that they’ve been used to.”
NCA5 highlights that “community-based snow-fed irrigation systems in high-elevation watersheds of New Mexico and Colorado, known as acequias, are particularly exposed to the shortfalls in annual snowpack.”
While building more reservoir storage is a potential solution, that strategy has three problems, Harding said. “One is people don’t like reservoirs, except for the people that are going to benefit and use the water. Two is they’re really expensive. And three is we’ve used up most of the really good reservoir sites, so that seems unlikely,” he said.
Even without the influence of climate change, many Indigenous communities in the West confront major hurdles in securing safe and adequate water supplies (see this 2021 paper for more on incomplete plumbing and poor water quality in U.S. homes).
The map below shows that many American Indian and Alaska Native homes already face serious problems with their water and sewer systems. At deficiency level 2, a water and sanitation system is in place but it needs upgrades or maintenance, while at level 5, the worst category, “there’s absolutely no water supply, no sanitation system in at all,” said co-author Heather Tanana, a visiting professor of law at the University of California-Irvine, in a webinar.
“As we’re experiencing increased changes in the water cycle, the water quality and quantity impacts are further being exacerbated in part because of aging infrastructure,” Tanana said. “So who is being the most affected? Again, it’s our under-resourced frontline communities.”
There are two types of snow drought to worry about: dry and warm
The report highlights two kinds of “snow drought” that can afflict the West (this page offers updates on the current status of snow droughts). In a “dry” snow drought, a lack of precipitation diminishes the snowpack. That’s what happened in California’s Sierra Nevada in the 2014/2015 winter, “resulting in the shallowest snow volume ever recorded there,” according to NCA5.
That same winter, but farther north in Oregon and Washington, there was another snow drought, but this one was a “warm” one. Winter precipitation was 77% to 113% of normal, yet because of higher temperatures, the precipitation shifted from snow to rain, leading to a reduction in the snowpack and higher winter snowmelt, but below-normal flows from April to August.
The graphic below illustrates the streamflow for two locations: Washington’s Ahtanum Creek and California’s Merced River. In each chart, the black line indicates flows during the 2015 water year (which began October 1, 2014), the gray lines show data from 1952 to 2021 and the dashed line plots the median for that period. The top chart shows that runoff spiked in February and again in March but was then mostly below average during the subsequent warmer months. By contrast, the Merced River’s flow was below normal for nearly the entire runoff season.
“In Oregon and Washington, irrigated crops—including valuable orchard crops—that depend on direct streamflow diversion water rights failed, but municipal water supplies that relied on storage rights that allow reservoirs to capture winter runoff were sufficient,” according to NCA5. “In California, total water supply was limited, resulting in severe or complete cutbacks to junior water rights and contract holders.”
The September 2015 photo below from NCA5 shows an apple orchard in the Roza Irrigation District, near Yakima, Washington, suffering the effects of the warm snow drought and reduced irrigation.
Warming will make the landscape “thirstier” in many locations
NCA5’s water chapter discusses a measure known as the “annual climatic water deficit.” In simple language, this metric describes the thirstiness of the landscape.
“This is a measure that I advocated for because I think it integrates the effects of everything,” said Harding, who defined the deficit as “how much water we’d have to add to the system to fully satisfy the needs of the plants.”
As shown in the maps below, the climatic water deficit is expected to increase by midcentury across much of the nation—and especially in the Southwest. Map “a” shows the average of the projections, while maps “b” and “c” report the average of the wettest and driest 20% of projections.
The region’s increasing dryness threatens to reinforce snow loss by increasing the amount of dust that lands on the snowpack, thereby accelerating its melting. As a result, NCA5 cautions that “under increasing aridity, agricultural practices such as fallowing and grazing on rangelands will need careful management to avoid increased wind erosion and dust production from exposed soils.”
Adding insult to injury, NCA5 warns that those soils will be more susceptible to blowing around because hotter summers will “degrade protective desert soil crusts formed by communities of algae, bacteria, lichens, fungi, or mosses.”
The Water Desk’s mission is to increase the volume, depth and power of journalism connected to Western water issues. We’re an editorially independent initiative of the Center for Environmental Journalism at the University of Colorado Boulder.
The Crystal River flows past a stream gauge at the fish hatchery just south of Carbondale. This location has nearly dried up in late summer in recent years due to drought, climate change and senior water users’ upstream diversions. Photo: Heather Sackett/Aspen Journalism
Editor’s note: This story is part of a larger project undertaken by Aspen Journalism — a nonprofit, investigative news organization — to examine water use on the Crystal River. Visit Aspen Journalism’s website to see the complete project, including narrative descriptions of how water is used on each of the river’s eight largest ditches, as well as an interactive map.
In 2012, one of the driest years in Colorado in recent memory, the Crystal River practically dried up.
Ken Neubecker, a now-retired Colorado projects director at environmental group American Rivers and former member of the Pitkin County Healthy Rivers board, recalls the stream conditions.
“I took a photo on the Thompson Road bridge, and it was running about 1 cubic foot per second, if that,” he said. “It was mostly dry rocks with some puddles in between.” (One cfs, which is equivalent to the amount of water to fill one basketball, is a common way to measure the flow of water.)
These extremely low-water conditions returned in the drought years of 2018, 2020 and 2021, with river flows near the fish hatchery just south of Carbondale hovering around 8 to 10 cfs — not enough to support aquatic life and nowhere near the 100 cfs that the state of Colorado says is the minimum needed to maintain a healthy stream.
Beginning high in the Elk Mountains, the Crystal River flows 40 miles through a canyon under the flanks of Mount Sopris and winds past the towns of Marble, Redstone and Carbondale before joining with the Roaring Fork River, a major tributary to the Colorado River. Along the way, its waters turn mesa hayfields, acres of alfalfa, and town parks and lawns a verdant green.
A historic drought driven by climate change and temperatures that creep ever higher are partly to blame. But the factors that lead to a dry river bed are many and include unique geology, ill-defined legal concepts, misunderstandings about the value of water, inefficient irrigation systems and vague state guidelines regarding waste that seem to be enforced only under specific circumstances.
These barriers to conservation are widespread across western Colorado. The Crystal River is one place where these complex issues converge, resulting in a chronic dry-up of stream sections in late summer most years. To Neubecker, the cause is water users taking more than they need and not leaving enough for downstream users — especially when the “user” is the river ecosystem itself.
“It just dries up a stretch of river and disconnects the upper part of the river from the lower part,” he said. “You have to be a good neighbor, and that concept has been totally thrown by the wayside.”
The Crystal is not unique. Rivers throughout the West face increasing pressure from chronic overuse, warming temperatures and prolonged dry spells. Persistent dry-ups that span weeks or months are a familiar feature of many so-called “working rivers” that supply water to the West’s sprawling farmlands and growing cities.
As scarcity has gripped the states that make up the headwaters of the Colorado River, a new level of scrutiny has fallen on water uses once considered insignificant, even small hayfields or grassy front yards. Communities throughout the West are now under pressure to justify their use of any amount, and make a case for continuing to do things the way they’ve always been done.
To better understand these issues plaguing the Crystal, Aspen Journalism examined the river’s biggest users to create the most complete picture possible of how water is used, why dry conditions persist and what can be done about it. We created a detailed analysis using publicly available information; state-of-the-art, satellite-based measurements; interviews with experts; and, where possible, site visits and ditch tours.
Understanding exactly how the West’s water is used — and perhaps where opportunities for efficiency improvements exist — will only become more crucial in a hotter, drier future with increasing scarcity across the Colorado River basin.
Low ditch efficiencies
According to Aspen Journalism’s analysis, some of the Crystal’s biggest diverters have very low ditch efficiencies, meaning that the crops they grow are using just a small fraction of what they take from the river.
The low efficiencies pose the question: Does the small amount of water that is actually used by the crops justify the large amounts diverted from the Crystal, to the detriment of its ecosystem?
Of the 42 active ditches on the Crystal according to the Colorado Division of Water Resources (DWR) database, Aspen Journalism examined the top eight: those with the biggest and oldest water rights, the majority of which date to the 1880s. The analysis compared how much they were taking out of the stream based on diversion records maintained by DWR and how much water was absorbed by crops. Known as evapotranspiration, this is tracked by satellites through a publicly available platform called OpenET. Evapotranspiration is a measure of the amount of water used by crops, also called consumptive use.
Aspen Journalism’s analysis shows that Crystal River ditches that irrigate primarily agricultural land — the East Mesa, Lowline and Ella — have an average efficiency of between about 12% and 14%. That means the crops that are irrigated by these ditches use 12% to 14% of the water the ditch diverts. An outlier is the Sweet Jessup Canal, which irrigates Crystal River Ranch and whose crops use nearly 30% of the water it diverts, according to our analysis. Much of this ditch is lined or piped, making it more efficient.
For ditches that are used primarily for outdoor watering of residential lawns, gardens, ballfields and parks — ditches such as the Carbondale Ditch, the Weaver & Leonhardy, Bowles & Holland, and the Rockford, the latter of which also irrigates some agricultural land — our analysis showed lower efficiencies, ranging from less than 1% to about 9%. However, that analysis likely reflects an undercount of the amount of water consumed on smaller parcels.
OpenET is becoming a widely used tool by water managers, including by the Upper Colorado River Commission, to calculate the water savings on individual fields that participate in its 2023 and 2024 System Conservation Program. Still, this technology has limitations. For example, the satellites work best on parcels that are at least .22 acres, so consumptive use tied to many residential lawns and gardens that are irrigated with water from these ditches is probably not included in these calculations. There is also no way to account for the amount of water a crop uses that comes from precipitation. Including that figure would result in lower ditch-efficiency percentages. For a complete explanation of how Aspen Journalism got these numbers, including all the caveats and limitations of the data, see our methodology breakdown.
The two ditches owned and operated by the town of Carbondale — the Carbondale Ditch and the Weaver Ditch — appear to be using a particularly small percentage of the overall water they take from the river. These ditches weave through the front yards, parks and alleyways of Carbondale, contributing to the charming, small-town feel and adding a riparian ribbon of green to an arid landscape. In general, these ditches that are used by residents to water their lawns and gardens have less-consumptive use than ditches that are all or nearly all agricultural use. However, since the OpenET does not pick up small lawns and gardens, it’s hard to know exactly how much water is being consumed from these ditches.
Kevin Schorzman, public works director for the town of Carbondale, said the town does not track ditch efficiencies, consumptive use or the number of homes that use ditch water for their lawns. He said the town has undertaken several projects over the past few years that should lead to improved efficiency in the ditch system, including lining portions of the Carbondale and Weaver ditches with concrete as well as piping sections of both ditches.
Officials have pointed to a river restoration project, which includes headgate modernization and automation on the Weaver Ditch as having benefits for the environment. But Schorzman said the project may or may not impact diversions from the river.
Inefficiencies widespread
James Heath, DWR engineer for Division 5, agreed that Aspen Journalism’s ditch-efficiency numbers, while low, looked pretty reasonable. Additionally, a 2015 consumptive-use analysis of the Colorado River basin by Wilson Water Group put the overall system efficiency for the area that includes the Crystal’s watershed at 10%, which is in line with Aspen Journalism’s findings.
Very low ditch efficiencies seem to be common throughout Division 5, which contains the headwaters of the Colorado River. The 2015 Wilson Water Group study showed efficiencies in sub-basins ranged from 10% to 31%. Two other mountainous headwaters — the Blue River and Eagle River basins — had efficiencies of 14% and 16%, respectively.
Eric Kuhn, a Colorado River expert, author and former general manager of the Glenwood Springs-based Colorado River Water Conservation District, said the Crystal’s ditch efficiencies are in line with other places in western Colorado. He said irrigators in some basins are diverting 10 to 12 acre-feet for every acre-foot that their crops end up using.
“Those are the numbers we kind of got used to when people looked into them in detail,” Kuhn said.
It is common knowledge that ditches must take more water than only what is needed by crops, as pointed out by Joe White, director of finance at Colorado Rocky Mountain School. The private boarding school is the largest shareholder on the Rockford Ditch, which diverts from the Crystal.
“I don’t think that should surprise anyone,” White said. “Diversions are never going to equal consumptive use. Everyone knows it takes more diversion than consumptive use to deliver water to where it needs to be applied.”
White said Aspen Journalism’s numbers sound too low, but he did not provide his own consumptive-use numbers for the Rockford Ditch. White added that the Rockford needs to be kept full so that the lawn-watering irrigation pumps in the nearby neighborhood of Satank function properly.
“It’s challenging to regulate it as efficiently as we would like to,” he said.
Because the Crystal is not the only overtaxed stream in Colorado dealing with these issues, cities across the state are attempting to deal with water scarcity. That can be through strict conservation measures and, in particular, wringing water from nonfunctional, ornamental grass by banning its planting and incentivizing its removal.
But so far, widespread mandatory conservation measures — cracking down on waste and implementing efficiency standards — have not been aimed at agriculture, which is by far the biggest water-use sector and potentially has some of the lowest-hanging fruit to find water savings through irrigation improvements.
This parcel of land on Prince Creek Road is owned by Bailey Family Investment Company and is watered with Crystal River water via the Ella Ditch. The sprinkler gun system was installed in recent years. Photo: Heather Sackett/Aspen Journalism
Reasons for low efficiencies
There could be several reasons why ditch efficiencies on the Crystal are low. The most basic is that flood irrigation is less efficient than sprinklers. About 58% of agricultural lands on the top eight ditches are flood irrigated, according to data from the state DWR. Many ditches were also built in the late 19th century and are not lined or piped, meaning that some of the diverted water is lost to leakage.
Some of the diverted water is lost to thin, rocky soils that water percolates through quickly. Irrigators often need to divert extra water, known as “push water,” to ensure that there’s enough pressure to get the water all the way to land at the end of the ditch, which is sometimes miles from the point of diversion. These transit losses are not considered part of consumptive use and are not measured by OpenET.
There is some evidence that soils in the area are especially rocky — the Crystal River was originally named Rock Creek — which may be contributing to low efficiency, allowing water to seep through the bottom and sides of ditches before reaching a farm field.
Heath, the division engineer, also found evidence of this from drill logs for water wells in the area.
“They are running into some pretty coarse materials at shallow depths that would cause a lot more ditch loss, a lot more deep percolation, which would increase the losses and cause the overall system efficiencies to go down,” Heath said. “So, I think it’s pretty reasonable, the numbers you’re coming up with.”
Much of the diverted water that the crops don’t use eventually seeps back to the river over days, weeks or months, a phenomenon known as “return flows.” If the Crystal River Valley’s geology really is as porous as evidence suggests, return flows probably make it back to the river quickly, without much being stored for late-season returns.
The problem with return flows is that they do not go back into the river at the same spot they are taken out and have a delayed return, contributing to seasonal dry-ups. And after percolating through the soil, return flows can be warm and laden with salt and other contaminants, impacting the river’s overall quality and the fish that depend on cold, clean water.
The Weaver Ditch, maintained by the Town of Carbondale, runs through downtown, turning parks and lawns green. A headgate modernization project may not result in less water diverted from the river, according to town officials. Photo: Heather Sackett/Aspen Journalism
Is water being wasted?
Carbondale’s Schorzman said the town is adhering to state guidelines on waste and operating the ditch systems in a manner that is reasonably efficient. But pinpointing who might be wasting water in Colorado is difficult.
According to state guidelines on waste from 2017, which recently retired Colorado state engineer Kevin Rein said are still in effect, “a person shall not run through his or her ditch any greater quantity of water than is absolutely necessary for irrigation, domestic, and stock purposes to prevent the wasting and useless discharge and running away of water.”
The guidelines define waste as “diverting water when not needed for beneficial use, or running more water than is reasonably needed for application to beneficial use.” Beneficial use is defined as “the use of that amount of water that is reasonable and appropriate under reasonably efficient practices to accomplish without waste the purpose for which the appropriation is lawfully made.”
But “reasonably efficient” is not clearly defined. And how much more water ditches should take than what’s needed by crops is also unclear. Determining whether an irrigation practice is reasonable or wasteful is subjective.
Much like the famous Supreme Court test for obscenity, Rein said water commissioners have a good idea of what waste is when they see it. DWR has not done an efficiency analysis on the Crystal ditches, and Rein said he cannot identify a threshold for “reasonable” because every system is different.
“I don’t know whether it was intentional or not, but it’s important to our administration that it allows for judgment and for evaluation of myriad factors,” Rein said, referring to the subjective nature of the criteria.
The Rockford Ditch has the oldest water rights on the Crystal River. It irrigates some agricultural land as well as the lawns and gardens of the Colorado Rocky Mountain School and the Satank neighborhood of Carbondale. Photo: Heather Sackett/Aspen Journalism
Divert it or lose it?
Another potential explanation for the low use numbers could be that some irrigators are overdiverting based on a misunderstanding of Colorado water law. The true value of a water right is tied to its historical consumptive use, which is how much water the crops use. However, there is an entrenched, incorrect belief that by maximizing the amount of water taken from a stream, one can increase the future value of a water right or protect it from abandonment. Many interpret Colorado’s famous “use it or lose it” doctrine as “divert it or lose it.”
“The reality of that is sometimes it can feel like you have something on paper and giving up something you have on paper feels like you’re losing something,” said Assistant Pitkin County Attorney Laura Makar.
According to a 2016 special report by DWR officials and experts at the Colorado Water Center at Colorado State University, “use it or lose it” is commonly seen as a barrier to implementing water-conservation measures and efficiency improvements.
Users are told to divert their whole amount, “in order to preserve the water right; that is, protect it from abandonment and/or lead to the maximum value of the water right in a water right change proceeding,” the report reads. “This conclusion is based on a misapplication of the law.”
In reality, there are two requirements for abandonment: A water right must sit dormant and unused for 10 years, and the owner must intend to abandon it. For the past 20 years, DWR has had a policy of not placing water rights that date to before the 1922 Colorado River Compact on the abandonment list, which is compiled every 10 years. This means pre-compact water rights (like many of those in the Crystal analysis) have an additional layer of protection from abandonment, even if they meet the two requirements.
Neubecker said taking more water than you can use violates one of the most sacred concepts at the heart of Colorado water law: the duty of water. The duty of water is the amount needed to grow a crop — not the maximum allowed by a decree — and varies depending on crop type and location.
“Technically, it is against the law to take more water than you actually need regardless of what your decree says,” Neubecker said. “It’s just that neither the lawyers nor the state engineer’s office are going to enforce it.”
The Bowles & Holland Ditch, named after two of Carbondale’s earliest white European settlers, used to grow crops like potatoes. Now it mostly irrigates the lawns and golf course of River Valley Ranch. Photo: Heather Sackett/Aspen Journalism
Low efficiencies not a problem for state officials
DWR officials don’t have a problem with inefficient ditches as long as irrigators are not wasting water. Rein said that low efficiency doesn’t mean irrigation is being done improperly.
“I’m not aware that we have evidence of waste occurring on those systems,” Rein said.
There was, however, at least one documented instance of alleged water waste that occurred on the Crystal in recent years. In 2018, former water Commissioner Jake DeWolfe restricted how much water was flowing into the Lowine Ditch for taking more than it could put to beneficial use. Attorneys for one ditch user, Tom Bailey, complained in a letter to DWR, saying that the commissioner’s determination of waste was “ambiguous and erroneous,” and that the guidelines for waste are unlawful, claims that reflect the subjective nature of defining waste. DeWolfe declined to speak with Aspen Journalism for this story.
One of the ways water commissioners determine if waste is occurring is by looking at what is known as the “tail water,” which is where, after irrigating land, the ditch returns the water to the river. In 2018, DeWolfe said the large amount of tail water from the Lowline was an indication of waste.
The situation on the Crystal in 2018 is indicative of how state officials manage the river. The system is complaint-driven, meaning water commissioners will usually focus their efforts on streams where a water user has placed a call or where they have heard complaints of waste from water users. If a river is not on call, if no one is reporting their neighbors for taking too much or if there are no obvious indicators such as flooding, water commissioners probably won’t scrutinize ditches for waste. In most cases, tail water is not measured.
According to Heath, since 2018, no complaints about waste in the Crystal River basin have been received and waste has not been observed by water commissioners. Therefore, curtailment of structures within the Crystal River basin for waste issues has not occurred since 2018.
Heath said that as long as irrigators aren’t taking extra water to expand their historical irrigated acreage, his office doesn’t have an issue with low ditch efficiencies.
“As long as they continue to operate as they have historically operated, I don’t see that there is a problem with the diversions they are making,” he said. “They are operating their ditches and irrigating as they always have, and it just yields a low system efficiency.”
This section of the lower Crystal River dried up during the late summer of 2012, a drought year. The dry stretches occurred again in 2018, 2020 and 2021, with the river hovering at around just 8 cubic feet per second. Photo: Ken Neubecker
When the river is harmed
In Colorado, inefficient or wasteful practices are only considered such if they deprive another senior user of water.
But what if the other water user being harmed is the river ecosystem itself? There are few ways to ensure that enough water stays in the river for the fish, plants and animals that depend on it.
The stretch of the Crystal River just south of Carbondale near the Colorado Parks and Wildlife fish hatchery has a tendency to dry up during the late irrigation season. The problem is worse in dry years, and the tool meant to address it is limited in what it can accomplish.
The Colorado Water Conservation Board holds instream flow water rights on the Crystal River, which are intended to preserve the natural environment to a reasonable degree. They date to 1975 and are some of the oldest instream flow rights in the state. Although the Crystal River was here long before any humans inhabited the valley, under the cornerstone of Colorado water law known as prior appropriation — where the oldest rights, which almost always belong to agriculture and cities, get first use of the river — the instream flow rights that protect the river itself might as well have been born yesterday.
The instream flow right is 100 cfs on the stretch of river between Avalanche Creek and its confluence with the Roaring Fork, but it is rarely met from August to October. The reason?
“It’s the senior uses in the area,” said Rob Viehl, chief of the Colorado Water Conservation Board’s stream and lake protection section. “There are a lot of large senior irrigation ditches right above the fish hatchery gauge that divert a lot of water. They are in priority, and they are legally senior to the instream flow.”
The dry stretch is immediately downstream from the diversion for the Carbondale Ditch, which can pull 42 cfs from the river.
“Carbondale definitely needs to do some ditch-efficiency work,” Neubecker said. “The town of Carbondale is the single-biggest water rights holder on the Crystal.”
Cold Mountain Rancher Bill Fales turns the headgate of the Lowline Ditch. Fales is participating in a non-diversion agreement with the Colorado Water Trust to keep more water in the Crystal River. Photo: Heather Sackett/Aspen Journalism
Possible solutions
Much of western Colorado’s irrigation infrastructure is stuck in the 19th century. Upgrading ditches and headgates — and, in turn, making them more efficient — can be costly.
Matt Rice, southwest regional director for environmental group American Rivers, said Aspen Journalism’s analysis points to the need to upgrade that infrastructure. And with billions of dollars in federal funding available, now is a good time for these types of projects, he said. Some of Rice’s work with American Rivers receives funding from the Walton Family Foundation, which also provides funding to The Water Desk for its Colorado River coverage.
“If you need that much nonconsumptive push water to get your 11 or 7 or 9%, my sense is that there is a lot of opportunity to do things better,” Rice said. “It seems to me that infrastructure modernization on the Crystal could be a key thing to investigate.”
Colorado River environmental groups — including American Rivers, Trout Unlimited, The Nature Conservancy, Pitkin County Healthy Rivers — have funded and worked on agricultural infrastructure improvement projects that claim to have multiple benefits for agriculture, the environment and recreation. The idea is that if a project makes an irrigation system more efficient, less water will need to be diverted from a river.
But although they may improve riparian habitat or create safer passage for boats, there’s no evidence these projects result in more water left in rivers. Of all the experts Aspen Journalism interviewed for this story, none could point to a ditch infrastructure improvement project that resulted in a measurable decrease in diversions, as reflected in diversion records maintained by DWR. Simply quantifying flow needs specifically for recreation and the environment through stream-management plans has been thwarted in recent years by agricultural interests.
The town of Carbondale and other groups have recently completed a headgate modernization project on the Weaver Ditch, which supporters say will benefit the environment. But Schorzman, Carbondale’s public works director, said in an email that the project “may or may not impact diversion amounts.”
Environmental groups say they must work with — and not against — agriculture since they are the biggest water-user sector and that building relationships is important. In that spirit, Pitkin County Healthy Rivers has earmarked tens of thousands of dollars (the exact amount the project will cost is still unclear) to fund a piping project for the East Mesa Ditch, which had a blowout from sinkholes in September. Healthy Rivers has not secured a commitment from ditch owners that there will be any benefit to river flows from the piping project, even though part of its mission is to maintain and improve the quantity of water in local streams.
“The question is: How can we stay true to our charter of maintaining streamflow while helping somebody divert water from the river?,” Pitkin County Attorney John Ely said at a September Healthy Rivers meeting. “You simply can’t preserve water in the river at all without someone you can work with and someone who holds a relatively senior water right. … You can’t solve the riddle of how to protect streamflow without working with agriculture.”
An often-heard refrain from water users is that if they leave the water in the river, it will just get picked up by the next downstream user, so they may as well divert it. That is true to a degree. But if all the water users on a system were to become more efficient, they might be able to each take less.
And a new state law allows water users to get paid to temporarily lease water to the state’s instream flow program for five out of 10 years. The loaned water is tracked by DWR officials so that it stays in the river through the stretch where it’s needed. So far, the program is little-used — just nine projects so far statewide — and no water users on the Crystal are currently doing this type of instream flow loan.
Carbondale ranchers Bill Fales and Marj Perry are participating in a slightly different program, a non-diversion agreement with the Colorado Water Trust designed to leave more water in the river. When river flows dwindle to less than 40 cfs, Fales will get paid to reduce his diversions from the Helms Ditch, which could result in an additional 6 cfs in the Crystal.
“Obviously we are like everybody else — we hate to see the river dry,” Fales told Aspen Journalism in 2022..
Colorado’s entrenched water law system protects those European American settlers who first put the water to beneficial use, growing crops and building cities. One hundred and forty years later, that system still reflects the values of the time that the concept of prior appropriation was invented and largely excludes water for the environment, recreation or tribal communities. But as water supplies continue to be squeezed across the Colorado River basin, that may one day change.
“Change is hard,” Makar said. “If we have a system that has been in place and working one way for a long time, it requires new education, new materials. … I think it’s worth it, and I think that the system is eventually going to require it. But that doesn’t mean it’s easy.”
This story was produced in partnership with The Water Desk, an independent initiative of the University of Colorado Boulder’s Center for Environmental Journalism.
Aspen Journalism is a nonprofit, investigative news organization covering water, environment, social justice, history and more. Visit http://aspenjournalism.org.
Parsenn Bowl at Winter Park ski area in Colorado in January 2017. Photo by Mitch Tobin.
Over the past few years, I’ve been collecting news stories and other journalism related to snow. Below are links to some of the best and most interesting work that I’ve come across, lumped into a few categories.
If you’re looking for a crash course on snow and the Western snowpack, you should check out some of this great reporting, writing, and visual storytelling.
In a 2019 piece, I took a stab at describing the subdiscipline of “water journalism,” so it should come as no surprise that I also think that “snow journalism” is a thing.
The consequences of a changing snowpack—for reservoirs, farmers, cities, wildlife, wildfires, recreation, and more—have sparked tons of other stories in recent years, but in the list below, I’ve stuck to journalism directly related to the weather itself.
I’ve hyperlinked the journalists’ names so you can follow or learn more about them.
La Sal Mountains near Moab, Utah, in March 2023. Photo by Mitch Tobin.
The Water Desk’s mission is to increase the volume, depth and power of journalism connected to Western water issues. We’re an initiative of the Center for Environmental Journalism at the University of Colorado Boulder.
The Shoshone Hydroelectric Facility sits beneath a busy stretch of Interstate 70 on Jan. 26, 2024. The Colorado River District is poised to spend $98.5 million on rights to its water in an effort to keep the Colorado River flowing for farms and cities in Western Colorado. Photo: Alex Hager/KUNC KUNC’s Alex Hager reports from Western Colorado
Colorado’s Glenwood Canyon is as busy as it is majestic. At the base of its snowy, near-vertical walls, the narrow chasm hums with life. On one side, the Colorado River tumbles through whitewater rapids. On the other, cars and trucks whoosh by on a busy interstate.
Pinched in the middle of it all is the Shoshone Generating Station.
“It is a nondescript brown building off of I-70 that most people don’t notice when they’re driving,” said Amy Moyer, director of strategic partnerships at the Colorado River District. “But if you are in the water world, it holds the key for one of the most interesting and important water rights on the Colorado River.”
Beneath a noisy highway overpass, Moyer looked at the hydropower plant through a chain-link fence. Her group, a taxpayer-funded agency founded to keep water flowing to the cities and farms of Western Colorado, is poised to spend nearly $100 million on rights to the water that flows through the Shoshone facility.
The purchase represents the culmination of a decades-long effort to keep Shoshone’s water on the west side of Colorado’s mountains, settling the region’s long-held anxieties over competition with the water needs of the Front Range, where fast-growing cities and suburbs around Denver need more water to keep pace with development.
Even though the Shoshone water rights carry an eight-figure price tag, the new owners will leave the river virtually unchanged. The river district will buy access to Shoshone’s water from the plant operator, Xcel Energy, and lease it back as long as Xcel wants to keep producing hydropower.
Pedestrians walk across a bridge spanning the Colorado River in Grand Junction, Colo. on Jan. 25, 2024. The Colorado River District says buying the Shoshone water right will bring more predictable flows to the river’s ’15 mile reach.’ Photo: Alex Hager/KUNC
The water right is considered “non-consumptive,” meaning every drop that enters the power plant is returned to the river. The river district wants to keep it that way as long as they can and ensure the water that flows into the hydroelectric plant also flows downstream to farmers, fish and homes.
The river district is rallying the $98.5 million sum from local, state and federal agencies. The district has secured $40 million already, with deals in the works for the remainder. It’s rare for a big-money water deal to find this kind of broad approval from a diverse group of water users. But the acquisition is seen as pivotal for a wide swath of Colorado, and has been co-signed by farmers, environmental groups and local governments.
“It’s so much more than, ‘We’re going to spend $100 million to do nothing,’” Moyer said. “We’re keeping native flows in the river for so many benefits on the West Slope.”
Why Shoshone?
To understand why this unassuming power plant wields so much clout, you have to take a look at its history.
About 40 million people across seven Western states rely on the Colorado River. It supplies big cities like Los Angeles, Las Vegas, Phoenix and Denver. It supports a multi-billion dollar agriculture industry. But it’s governed by a century-old legal document and a management system that has proven frustratingly difficult to adapt for today’s policymakers.
Core to that management system is the concept of “prior appropriation,” which means that those who were first to use water will be the last to have their water curtailed in times of shortage. It often ignores Indigenous people who were using the river’s water before white settlers ever arrived. But under the rules white settlers drew up and modern governments still use today, it means older water rights are more powerful.
Shoshone’s water right is one of the oldest and biggest in the state, giving it preemptive power over many other rights in Colorado.
Even in dry times, when cities and farms in other parts of the state feel the sting of water shortages, the Shoshone Hydroelectric Plant can send water through its turbines. And when that water exits the turbines and re-enters the Colorado River, it keeps flowing for myriad users downstream.
The Colorado River flows through the Shoshone diversion structure on Jan. 29, 2024. The diversion structure routes river water into the hydropower plant. Photo: Alex Hager/KUNC
The hydro plant itself produces relatively little energy. Its 15 megawatt capacity is only a small fraction of Xcel Energy’s total Colorado output of 13,100 megawatts. Shoshone’s capacity is enough to serve about 15,000 customers, which is less than a quarter of the population of Garfield County, where the plant is located.
But the power plant has held legal access to water from the Colorado River since 1902, and can claim seniority over the vast majority of other water owners in the state.
That kind of seniority means power and certainty for whoever owns it. And that has raised the hackles of Western Colorado water users, who worry that water users in other parts of Colorado might be interested in buying Shoshone’s water right.
Colorado’s Front Range – functionally the metro area from Fort Collins to Pueblo – only exists in its current capacity because of a complex network of canals, pipes, and tunnels cut through the mountains, carrying water against gravity to the places where it’s needed. About 80% of the state’s water falls on the west side of the mountains, but 80% of its people live on the east side.
Cities on the Front Range have been able to grow significantly over the past century, despite often having access to a finite supply of water. Their Western Colorado counterparts worry that future growth could lead those cities to spend big on more water from the West Slope and say securing Shoshone’s water blocks Eastern Colorado water users from the chance to snatch it up themselves.
Fish and farms
The Colorado River District’s plans to buy Shoshone’s water have rallied widespread support, largely because of the transfer’s widespread benefits.
Perhaps no constituency will benefit from the move as much as the one that lives in the river itself.
“Anything that results in more water in the river is good for fish,” said Dale Ryden, a biologist with the U.S. Fish and Wildlife Service.
Standing on the banks of the Colorado River in Grand Junction, Ryden looked out over a murky, meandering stretch of water. It’s part of the “15 mile reach,” a critical section of the river about 80 miles west of the Shoshone plant. The reach is filled partly by water exiting Shoshone’s turbines.
Ryden explained that this section of river is home to a variety of species, some of which are endangered, and some which are found nowhere else on earth besides the upper portions of the Colorado River.
Those species – with funky names like the flannelmouth sucker and the humpback chub – rely on this stretch of river for virtually every aspect of life.
“Back in the day, before there were people here and there was a lot of water and snowpack, the ’15 mile reach’ was kind of the place to be if you were an endangered Colorado pikeminnow or a razorback sucker,” Ryden said. “The adults live here, they spawn here, they feed here. It’s just a really highly-used and good section of river for the adult endangered fish.”
Fish biologist Dale Ryden holds a razorback sucker on Jan. 26, 2024. The endangered fish species lives in the Colorado River, and proponents of the Shoshone water right transfer say the fish will benefit from increased flows to a portion of its habitat. Photo: Alex Hager/KUNC
Because the fish are protected by the federal Endangered Species Act, people who use water from this section of the Colorado River are legally required to leave enough behind for fish. That means dry conditions and water shortages would force farmers and ranchers in the nearby Grand Valley to play a tricky balancing game between their own water needs and the legal protections afforded to endangered fish.
“We can’t have farming without taking care of those fish,” said Tina Bergonzini, manager of the Grand Valley Water Users Association, one of a handful of agricultural irrigation districts near Grand Junction. “They go hand in hand.”
Mesa County, which contains the Grand Valley, has an annual agricultural output of about $94 million. It’s the state’s top producer of fruits and berries, including the regionally-famous peaches from Palisade.
Bergonzini says the farmers and ranchers who contribute to that total will be able to depend on a steady water supply year after year once Shoshone’s water is guaranteed to keep flowing their way.
“I think peace of mind is the number one most important thing that it’s going to be able to bring to the Grand Valley,” she said.
The Grand Valley Water Users Association was among 21 groups that co-signed the river district’s plan to buy the Shoshone water right.
Other potential suitors
The river district describes the deal as ‘protecting’ the Shoshone water right, but hasn’t detailed who exactly they’re protecting it from. History provides more than a few examples of Front Range cities and agriculture looking West for new water supplies, but it’s unclear which diverters, exactly, would have wanted to buy Shoshone.
Denver Water, the state’s largest water utility, would have been a potential candidate to buy access to Shoshone’s water, but forfeited that opportunity in 2013 when the agency inked the “Colorado River Cooperative Agreement” along with the Colorado River District. In fact, Denver Water agreed to support the acquisition of the Shoshone water right by a West Slope entity.
Representatives from Denver Water, Aurora Water and Northern Water – which serves eight counties north and east of the Denver metro – declined to comment on the transfer of Shoshone’s water rights. A spokeswoman for Colorado Springs Utilities said the agency was “aware of the Colorado River District’s efforts to acquire the Shoshone water rights and would not oppose the transfer of those rights.”
This 1968 photo shows two large tubes, known as penstocks, which carry Colorado River water into the Shoshone hydropower facility from pipes within the canyon wall. Photo: Historic American Engineering Record/Library Of Congress
Mark Hermundstad, a retired water lawyer who helped craft the Colorado River Cooperative Agreement, said he was not aware of any particular water agency that was poised to buy the Shoshone right but that threats may have still existed. He even floated the idea that an East Coast hedge fund could theoretically attempt to buy Shoshone’s water.
“There’s always been a possibility that someone with a lot of money could come in and buy it and try to do something with it,” he said.
Following the funds, and what comes next
Almost all of the $98.5 million for the river district’s acquisition of Shoshone’s water will derive from public funds.
The vast majority of that money, about $49 million, is set to come from the federal government. The river district plans to request a chunk of money from a $4 billion pool given to the Department of the Interior in 2022 for Colorado River projects. The extraordinary infusion of federal money has so far been used to fund a number of incentive programs designed to pay water users — mostly farmers and ranchers — in exchange for reduced water use.
Twenty million dollars will come from the river district’s own coffers. The agency is funded by taxes from 15 counties in Western Colorado. In 2020, voters in those counties overwhelmingly approved a rate hike for payments to the river district, designed to bring in an extra $5 million each year.
Cattle graze in the Grand Valley on Jan. 25, 2024. Farm groups say the area’s growers will benefit from the Colorado River District’s acquisition of the Shoshone water right because it will help them have more predictability in the amount of water they can divert for farms and ranches each year. Photo: Alex Hager/KUNC
Another $20 million will come from the state of Colorado. The state’s water management arm, the Colorado Water Conservation Board, recently voted to approve that spending from its annual “water projects bill,” bringing the river district one step closer to its fundraising goals.
Besides wrangling the formidable sum, the main hurdles left for the river district concern permitting, regulation and a court hearing. Both the river district and state officials say they are optimistic that all the necessary paperwork will get stamped without issue.
“I don’t expect that there’s going to be entities or individuals that come out of the woodwork vocalizing any strong opposition to us moving forward in this way,” Lauren Ris, director of the Colorado Water Conservation Board, said.
Only one aspect of the transfer appears to present a potential wrinkle: the river district’s ability to own an “instream flow.” That designation refers to water that is owned but not used, in the traditional sense. Instead, it’s left in rivers and streams to “preserve the natural environment.” The state is usually the only entity allowed to own that type of water right.
In a recent Colorado Water Conservation Board (CWCB) meeting, Phil Weiser, the state’s attorney general, pointed out that it would be unusual for the river district—rather than the state board itself—to own Shoshone’s water and keep it as an instream flow.
In an interview with KUNC, Ris pointed to a short list of other times the board made exceptions to its usual policy about instream flow ownership. Ris said the Colorado River District’s takeover of Shoshone is big and important enough that it makes sense to “think creatively” and consider adding Shoshone’s water to that list.
“The easiest way to have an instream flow water, right, is for the CWCB to outright own it and operate it,” she said. “But that doesn’t mean that it’s the only way, and this is such an outlier unique situation.”
‘Long-term, permanent solutions’
The past few decades have seen the Colorado River governed by a patchwork of short-term agreements. The region’s top water policymakers have appeared reluctant to agree on more permanent measures to significantly correct a growing imbalance between supply and demand. Instead, they’ve put together temporary deals designed to stave off catastrophe at the nation’s largest reservoirs.
While the Shoshone water right transfer likely won’t change much for tense negotiations about water management between states that use the Colorado River, it’s a rare moment of durability and stability for at least one area that uses the river’s water.
“Now more than ever, there is a desire to look for long-term permanent solutions on the Colorado River,” said the Colorado River District’s Amy Moyer. “This is one that exists for Colorado.”
Across the Colorado River Basin, that imbalance and the growing harm of climate change have also compelled environmental groups to raise alarm about potential damage to ecosystems for plants and animals. Management decisions about the river’s water tend to prioritize cities and agriculture over the natural world.
Proponents of the Shoshone water right transfer say it will help push back on the harms of water shortages, at least on one stretch of the Colorado River.
“Being able to stabilize or make permanent existing rights is very helpful as we look at addressing and dealing with climate change and its impact on streams,” said Bart Miller, healthy rivers director at the conservation group Western Resource Advocates. Miller’s group receives funding from the Walton Family Foundation, which also supports KUNC’s Colorado River coverage.
Policymakers are struggling to make significant reductions to the amount of water used by cities and farms, and climate change means less water will enter the river system in the future. Environmental advocates say the Colorado River District’s ownership of the Shoshone water provides some insurance against those realities by adding predictability and protection to a stretch of the Colorado River.
This story is part of ongoing coverage of the Colorado River, produced by KUNC and supported by the Walton Family Foundation. It was produced in partnership with The Water Desk, an independent initiative of the University of Colorado Boulder’s Center for Environmental Journalism.
An atmospheric river event in January 2017. Source: NOAA.
A version of this post originally appeared on Snow News on February 1, 2024.
The term “atmospheric river” (AR) has become common in weather stories and media coverage, but the name for these age-old events is a relative newcomer in meteorological glossaries.
Coined by scientists in the 1990s, the term’s popularity has soared in recent years as researchers, forecasters, journalists, and others have publicized the outsized role of atmospheric rivers in producing rain, snow, wind, and severe weather in the American West (and other places).
The recent atmospheric rivers that struck California illustrate why they can be both harmful and helpful. The storms not only caused deadly flooding but also gave the state’s meager snowpack a major boost. The map below shows the total liquid precipitation from February 1 to February 8.
Source: Pivotal Weather
Here’s a quick primer on ARs, why they matter, and what the future might hold for ARs as the climate warms.
What are atmospheric rivers?
These plumes of moisture are sometimes likened to “rivers in the sky” because they transport so much water vapor from the tropics toward higher latitudes. In data visualizations, like the one below, they can resemble a fire hose dousing the West Coast.
Animation showing atmospheric river plumes in January 2012. Source: NOAA.
An AR is “a long, narrow, and transient corridor of strong horizontal water vapor transport that is typically associated with a low-level jet stream ahead of the cold front of an extratropical cyclone,” according to the American Meteorological Society’s Glossary of Meteorology.
“Atmospheric rivers are the largest ‘rivers’ of fresh water on Earth, transporting on average more than double the flow of the Amazon River.”
When ARs are forced upward by mountains or other forces, the water vapor cools, condenses, and precipitates, as shown in the graphic below. This NOAA figure says the amount of water vapor in a strong AR “is roughly equivalent to 7.5-15 times the average flow of water at the mouth of the Mississippi River.”
One type of AR has come to be known as the “Pineapple Express” because it taps moisture around Hawaii. The January 4 images below from the NASA Earth Observatory illustrate the connection: the top graphic depicts a measure of water vapor in the atmosphere and the bottom shows the view from a satellite.
ARs are critical for the West’s water and snowpack
Whether you compare ARs to the Amazon or the Mississippi, there’s no doubt they exude wetness, so they can have far-reaching effects on the West’s water resources, for better or worse.
On average, a few AR events contribute 30% to 50% of the annual precipitation in West Coast states, according to NOAA. A 2019 paper in Geophysical Research Letters concluded that AR storm days are responsible for about one-quarter of the snowpack in the Sierra Nevada and one-third of the snowpack in the Cascades of Oregon and Washington.
Even the Rocky Mountains benefit from ARs. A 2021 study in Geophysical Research Letters estimated that the snow produced by ARs accounts for 31% of the peak snow water equivalent in the Upper Colorado River Basin, where the majority of the river’s flow originates.
“Atmospheric river” is a relatively new term
ARs have been a big deal for eons—an average of about 11 are present on Earth at any time—but it wasn’t until the 21st century that the term entered into general circulation. The two graphics below, from NASA’s Jet Propulsion Laboratory and the Center for Western Weather and Water Extremes (CW3E) at the Scripps Institution of Oceanography, show the term’s growing use in news stories and peer-reviewed journal articles.
Some experts think the analogy to a terrestrial river is inappropriate, and some think the term is “duplicative of preexisting concepts, such as the warm conveyor belt,” according to this article in the Bulletin of the American Meteorological Society. Nevertheless, “atmospheric river” has jumped from peer-reviewed journals to water cooler conversations, not unlike “polar vortex,” “bomb cyclone,” and “heat dome.”
The AR Scale is based on two factors: the duration of the event and its “maximum vertically integrated water vapor transport,” a measure of its water content and the speed at which it’s moving. As shown in the graphic below, there are five categories, with the bottom two described as primarily beneficial.
One way to summarize AR forecasts is shown below in a set of maps from CW3E, which describe conditions along three locations—coastal, foothills, and inland—from January 30 to February 6.
The forecast shows the southern Oregon coast is expected to reach Category 5, the most severe level, while other areas along the Pacific Ocean will reach Categories 3 and 4. Farther inland, conditions are expected to be less extreme, but at higher elevations, it’ll definitely be dumping.
ARs can end droughts but also cause major flooding
As noted by the AR Scale, these events can be both helpful and hazardous. On the positive side, ARs can be effective drought busters. A 2013 study in the Journal of Hydrometeorology concluded that about one-third of persistent droughts in California have been erased by AR storms, with 60% to 74% of droughts in the Pacific Northwest ending this way.
On the negative side of the ledger, ARs have been responsible for some of the worst floods on the West Coast, including nearly 90% of California’s flood damage. Even this week’s weather prompted some internet rumors that California would be subject to a “megaflood” of biblical proportions, according to this Los Angeles Times story, which noted that experts don’t think this is “the big one.”
One doomsday scenario, known as “ARkStorm,” is a deluge featuring wave after wave of ARs flooding large portions of California, displacing up to 10 million people, and causing a $1 trillion disaster. For more on this potential nightmare, check out “The Trillion-Gallon Question,” a 2023 story by Christopher Cox in The New York Times Magazine about the potential fragility of California’s water infrastructure.
And let’s not forget about the wind. “Atmospheric rivers are among the most damaging storm types in the middle latitudes, especially with regard to the hazardous wind they produce,” according to NASA. Researchers at the Jet Propulsion Laboratory found that ARs were to blame for up to half of the most destructive windstorms over the last two decades. In a 2017 study in Nature Geoscience, scientists concluded: “Landfalling atmospheric rivers are associated with about 40–75% of extreme wind and precipitation events over 40% of the world’s coastlines. Atmospheric rivers are associated with a doubling or more of the typical wind speed compared to all storm conditions, and a 50–100% increase in the wind and precipitation values for extreme events.”
Climate change will intensify ARs
As the planet continues warming, scientists expect ARs to strengthen. A warmer atmosphere can hold more water, so climate change is projected to boost the intensity of downpours. NASA scientists predict that by the end of the 21st century, climate change will make ARs about 25% wider and longer while increasing the global frequency of AR conditions, such as heavy rain and strong winds, by around 50%.
A 2021 paper focused on the West concluded that for every 1◦C of additional warming, annual average flood damages will rise by about $1 billion. Because warming is causing the snow level to rise, atmospheric rivers are more likely to drop rain, so they may not be as helpful to the snowpack, and when rain falls on snow, that can cause huge problems with flooding and debris flows.
The odds of an ARkStorm have doubled due to climate change and “runoff in the future extreme storm scenario is 200 to 400% greater than historical values in the Sierra Nevada because of increased precipitation rates and decreased snow fraction,” according to a 2022 paper in Science Advances.
For a great overview of climate change and ARs, see this recent Washington Post story from Kasha Patel. And check out this fascinating piece from Ian James at The Los Angeles Times to learn how scientists are using a hurricane-reconnaissance jet to study ARs.
Snow News is a free multimedia newsletter that covers the science of snow and the state of the snowpack.
The Water Desk’s mission is to increase the volume, depth and power of journalism connected to Western water issues. We’re an initiative of the Center for Environmental Journalism at the University of Colorado Boulder.
A satellite image shows a powerful atmospheric river hitting the Pacific Northwest in December 2023. Darker greens are more water vapor. Lauren Dauphin/NASA Earth Observatory
A series of atmospheric rivers is bringing the threat of heavy downpours, flooding, mudslides and avalanches to the Pacific Northwest and California this week. While these storms are dreaded for the damage they can cause, they are also essential to the region’s water supply, particularly in California, as Qian Cao, a hydrologist at the University of California, San Diego, explains.
What are atmospheric rivers?
An atmospheric river is a narrow corridor or filament of concentrated water vapor transported in the atmosphere. It’s like a river in the sky that can be 1,000 miles long. On average, atmospheric rivers have about twice the regular flow of the Amazon River.
When atmospheric rivers run up against mountains or run into local atmospheric dynamics and are forced to ascend, the moisture they carry cools and condenses, so they can produce intense rainfall or snowfall.
A satellite view of atmospheric rivers.
Atmospheric rivers occur all over the world, most commonly in the mid-latitudes. They form when large-scale weather patterns align to create narrow channels, or filaments, of intense moisture transport. These start over warm water, typically tropical oceans, and are guided toward the coast by low-level jet streams ahead of cold fronts of extratropical cyclones.
Along the U.S. West Coast, the Pacific Ocean serves as the reservoir of moisture for the storm, and the mountain ranges act as barriers, which is why the western sides of the coastal ranges and Sierra Nevada see so much rain and snow.
Why are back-to-back atmospheric rivers a high flood risk?
The first heavy downpours saturate the ground. As consecutive storms arrive, their precipitation falls on soil that can’t absorb more water. That contributes to more runoff. Rivers and streams fill up. In the meantime, there may be snowmelt due to warm temperatures, further adding to the runoff and flood risk.
California experienced a historic run of nine consecutive atmospheric rivers in the span of three weeks in December 2022 and January 2023. The storms helped bring most reservoirs back to historical averages in 2023 after several drought years, but they also produced damaging floods and debris flows.
Atmospheric rivers forming over the tropical Pacific Ocean head for the U.S. West Coast. NOAA
The cause of AR families is an active area of research. Compared with single atmospheric river events, AR families tend to be associated with lower atmospheric pressure heights across the North Pacific, higher pressure heights over the subtropics, a stronger and more zonally elongated jet stream and warmer tropical air temperatures.
Large-scale weather patterns and climate phenomena such as the Madden-Julian Oscillation, or MJO, also play an important role in the generation of AR families. An active MJO shift occurred during the early 2023 events, tilting the odds toward increased atmospheric river activity over California.
An aerial view shows a flooded neighborhood in the community of Pajaro in central California on March 11, 2023, after a series of atmospheric rivers. Josh Edelson/AFP via Getty Images
A recent study by scientists at Stanford and the University of Florida found that storms within AR families cause three to four times more economic damage when the storms arrive back to back than they would have caused by themselves.
How important are atmospheric rivers to the West Coast’s water supply?
I’m a research hydrologist, so I focus on hydrological impacts of atmospheric rivers. Although they can lead to flood hazards, atmospheric rivers are also essential to the Western water supply. Atmospheric rivers have been responsible for ending more than a third of the region’s major droughts, including the severe California drought of 2012-16.
They also contribute to the snowpack, which provides a significant portion of California’s year-round water supply.
In an average year, one to two extreme atmospheric rivers with snow will be the dominant contributors to the snowpack in the Sierra Nevada. Together, atmospheric rivers will contribute about 30% to 40% of an average season’s total snow accumulation there.
After several winter storms brought record snowfall to California’s Sierra Nevada in early 2023, Lake Oroville, California’s second-largest reservoir, was at 100% capacity. The previous year, much of the state had faced water restrictions. Justin Sullivan/Getty Images
That’s why my colleagues at the Center for Western Weather and Water Extremes at the Scripps Institution of Oceanography, part of the University of California, San Diego, work on improving atmospheric river forecasts and predictions. Water managers need to be able to regulate reservoirs and figure out how much water they can save for the dry season while still leaving room in the reservoirs to manage flood risk from future storms.
How is global warming affecting atmospheric rivers?
My research also shows that more atmospheric rivers are likely to occur concurrently during already wet conditions. So, the chance of extreme flooding also increases. Another study, by scientists from the University of Washington, suggests that there will be a seasonal shift to more atmospheric rivers earlier in the rainy season.
There will likely also be more year-to-year variability in the total annual precipitation, particularly in California, as a study by my colleagues at the Center for Western Weather and Water Extremes projects.
The Water Desk’s mission is to increase the volume, depth and power of journalism connected to Western water issues. We’re an initiative of the Center for Environmental Journalism at the University of Colorado Boulder.
On this episode of Water Buffs, we examine how drought can harm human health, specifically how dramatic fluctuations in water availability can lead to increasingly toxic water supplies.
Dr. James is an award-winning epidemiologist and engineer specializing in environmental and climate risk factors and their connection to health in vulnerable populations. She is an associate professor at the University of Colorado Anschutz Medical Campus, one of three institutions that make up the Colorado School of Public Health.
Kathy James, PhD, MSPH, MSCE Dr. James is an epidemiologist and engineer at the Colorado School of Public Health who specializes in environmental and climate risk factors and health in vulnerable populations. Starts at 1:05
Study findings A recent KFF Health News story supported by the Water Desk explored research by Dr, James finding that drought conditions have been intensifying the levels of metals in drinking water in southwestern Colorado. Starts at 4:38
Why the San Luis Valley? The area is one of the oldest agricultural communities in the state, with residents going back as many as eight or nine generations. It is the highest mountain plain desert in the western hemisphere and is a leading producer of potatoes, lettuce and alfalfa. It also experienced a megadrought from 2002 to 2012. Starts at 10:47
Water Words: “Hard Water” The “hardness” of water can be traced to its level of dissolved calcium and magnesium. Hard water can be harmful to piping and household appliances but can be beneficial to ecosystems. Starts at 25:31
How can people keep healthy and safe? With research partners at ASU, Dr. James is exploring low-cost and environmentally low-impact filtration systems for removing harmful substances from well water. Starts at 36:07
Is well testing too expensive? Currently, private well owners are responsible for the cost of testing. More important, says Dr. James, is helping them address problems that the tests find. Starts at 40:00
If you’re interested in appearing on the show, please contact Water Desk Director Mitch Tobin at mitchtobin@colorado.edu. If you’d like to share your comments and questions, you can reach us at waterdesk@colorado.edu, or on Twitter and Facebook.
Snowmaking at Purgatory ski area in southwest Colorado in December. A dry, warm start to winter left many ski resorts in the West with thin cover. Photo by Mitch Tobin.
A version of this post originally appeared on Snow News on January 4, 2024.
There’s no shortage of websites with maps and graphics visualizing snow forecasts and the state of the snowpack.
In fact, information overload is the real challenge.
Starting up Snow News, I felt like a skier in whiteout conditions, trying to find my bearings through foggy goggles in a dense cloud of data, models, analytics, predictions, and other weather wonkery.
Lift 9 at Colorado’s Loveland ski area climbing to nearly 13,000 feet and the Continental Divide in March 2015. Photo by Mitch Tobin.
In an earlier post, I explained how the Winter Storm Severity Index provides an accessible overview of expected impacts from snow, ice, and wind. But that’s just one of many products from the government, universities, and other sources that offer a wealth of information about what’s happening with both near-term weather and seasonal trends.
Below, I describe some of the other sites I find most useful for tracking storms and keeping tabs on the snowpack. I’m not a snow scientist, so I’m focusing on resources that make it easy for a lay audience to catch the drift.
The sites below are all free, but there are also paid services worth looking into if you’re a total snow nerd. In my opinion, OpenSnow is by far the best source for snow forecasts, especially for skiers and snowboarders, and I’ve been a paid member for a decade (its wildfire smoke projections and other maps are also useful in summer). If you want to see tons of data and the output from weather models, WeatherBELL Analytics and Pivotal Weather are good choices.
1) Use iMap to visualize SNOTEL data
First, the bad news. Three months into the water year, which starts October 1, the West’s snowpack remains significantly below average in nearly every watershed. The image below is from the Natural Resources Conservation Service’s iMap interactive, which illustrates January 1 data from automated SNOTEL stations and other sources.
The iMap tool provides a great overview of conditions in the West and lets you see data for individual watersheds or SNOTEL stations. In the images below, I’ve shown that switching from basins to stations allows you to click on a specific SNOTEL site to chart how the snowpack has fared this season. For example, the Columbus Basin station, located at 10,781 feet in the La Plata Range near me, is at 49% of the median level for 1991-2020, with current conditions shown with a black line and the median in green.
At this station, the snowpack has flatlined recently, and with 104 days to go until the median peak date of April 15, it was at the 7th percentile. Ugh. On the bright side, the forecast calls for snow to fall around here tonight, with a bigger storm expected to hit on Sunday.
If you’re monitoring conditions in California, check out that state’s own snowpack website. The summary below from the California Department of Water Resources visualizes the grim picture in the Sierra Nevada, with the statewide average at 25%.
2) Explore forecasts with a map from The New York Times
One of my favorite sites for tracking incoming storms is an interactive map from The New York Times that excels at visualizing data from the National Weather Service’s National Digital Forecast Database. For example, the November 30 map below shows the “most likely” snow amounts in Utah’s Wasatch Range, but the map can also depict the low- and high-end chances so you can get your hopes up or down, depending on your personal preference.
It’s easy to navigate this tool and drill down to see how the snow forecast can vary dramatically across just a few miles in the West’s undulating topography. This data viz also generates probabilistic snowfall forecasts for specific locations and zip codes, using National Weather Service data to calculate the likelihood that a place will receive a specific amount of snow, such as less than one inch, four to six inches, greater than 18 inches, etc.
3) Track snowfall with NOHRSC
It’s a mouthful, but NOAA’s National Operational Hydrologic Remote Sensing Center is an essential source for snow data. NOHRSC’s interactive map offers a variety of snow-related data, including depth, temperature, density, and melting. You can also select data for any day since 2002. Below is an example of the snowfall during 72 hours in mid-December in southern Colorado and northern New Mexico.
As is common with federal websites, this interactive map is kinda clunky and cumbersome. The paid sites I mentioned above use NOHRSC’s data to produce more user-friendly maps, like the one below from WeatherBELL Analytics showing how much snow fell from October 1 to January 1.
4) Keep tabs on the outlook at the Climate Prediction Center
The truth is that modern science has very little skill in predicting where and how much it’ll snow many weeks or months from now. But as I’ve noted in an earlier post, there are products by federal forecasters and other reputable sources that take a stab at long-term outlooks.
I think the best source is the federal government’s Climate Prediction Center. For what it’s worth, below are the CPC’s most recent outlooks for precipitation and drought in the first three months of 2024.
5) Gauge the probability of snow at the Weather Prediction Center
My favorite feature of this site is the map that depicts the probability of snowfall exceeding certain thresholds. For example, the December 1 image below shows the odds of at least four inches of snow falling over the subsequent 72 hours.
See this page for WPC’s winter weather forecasts, which go out to seven days and also address freezing rain.
6) See local reports from the Community Collaborative Rain, Hail and Snow Network (CoCoRaHS)
CoCoRaHS is a citizen-science effort that describes itself as “a unique, non-profit, community-based network of volunteers of all ages and backgrounds working together to measure and map precipitation (rain, hail and snow).”
Measurements from volunteers are plotted on an interactive map that has data available back to 1998. The image below shows 24-hour snowfall around Durango and Pagosa Springs on November 25.
Below is the output from one of their weather models, showing the expected snowfall during a late October storm.
See this page on avalanche.org for links to other avalanche centers, and this map for a national overview of conditions.
8) Consult dashboards that pull from multiple sources
Finally, several helpful websites aggregate data, maps, and graphics from various sources, offering a quick overview of what’s happening with snowfall and the snowpack.
The Intermountain West Ski Dashboard, created by the Colorado Climate Center at Colorado State University, pulls together data on recent snowfall, short-term forecasts, weather hazards, snow depth, drought, and more. Here’s an example of a graphic showing that the vast majority of SNOTEL sites in Colorado were below the 50th percentile on January 1, with the vertical axis showing elevation and the different colors corresponding to different river basins:
Snow water equivalent at Colorado SNOTEL sites on January 1. Source: Colorado Climate Center.
Below is a forecast for the next seven days, showing the expected precipitation “anomaly,” with green indicating wetter than average conditions and brown showing drier (this map shows inches of liquid precipitation, rather than snow amounts).
The Intermountain West Climate Dashboard, created by the Western Water Assessment at the University of Colorado Boulder, is another useful round-up that focuses on Colorado, Utah, and Wyoming. This is a great source for maps depicting recent temperature/precipitation data; measures of drought and soil moisture; current and forecasted streamflow; reservoir storage; and the status of the El Niño-Southern Oscillation. The site offers regular briefings on climate trends and significant weather events, including a helpful annual summary of the preceding water year. Below is a gallery of some images showing precipitation, soil moisture, and reservoir storage.
Snow News is a free multimedia newsletter that covers the science of snow and the state of the snowpack.
The Water Desk’s mission is to increase the volume, depth and power of journalism connected to Western water issues. We’re an initiative of the Center for Environmental Journalism at the University of Colorado Boulder.
WSSI is a helpful, pragmatic, and relatively new forecast product that’s meant to communicate weather-related risks to the general public and illustrate the threat that snow, ice, and wind pose for transportation, infrastructure, homes, and businesses.
Created by the Weather Prediction Center (WPC), part of the National Weather Service, WSSI is designed to convey the “societal impacts” of winter weather. Epic snowstorms not only make for fun powder days but also can kill and injure people while disrupting life across an entire region.
While winter storms usually can’t compete with flooding, tropical cyclones, and other severe storms in terms of the havoc they wreak, it’s worth remembering that damages sometimes exceed $1 billion.
WSSI “highlights regions and localities with the forecasted potential of damaging and life-threatening effects brought on by winter weather,” according to a helpful story map from WPC. The effects include “tree damage, school closures, transportation issues like flight cancellations, traffic accidents, and road closures.”
To get a sense of the potential problems, check out this November story from the Los Angeles Times about last year’s catastrophic winter, which left some residents with “PTSD for snow.”
“For weeks last winter, many San Bernardino Mountains residents remained trapped in their homes, buried under as much as 12 feet of snow, some without power for as long as six days,” according to the story. “Almost 350 residences and businesses were damaged or destroyed — including one of the area’s largest grocery stores, whose roof collapsed, and several houses that exploded because of buried gas meters. An estimated $143 million in losses to private property was tallied.”
Below is an example of a WSSI map that I snagged on November 30 while the Pacific Northwest was getting pounded by an atmospheric river.
The index has five categories, as shown in the legend below, ranging from the ho-hum “winter weather area” to “extreme impacts” where driving may be impossible and the public is urged not to travel. At this level—a sort of nivean DEFCON 1 but not quite an impending nuclear winter—the storm may disrupt infrastructure, knock out power, and produce life-threatening conditions.
WSSI’s goal is to create easy-to-understand visuals that translate wonky weather forecasts into something that ordinary citizens can quickly grasp.
“Meteorologists may produce an accurate forecast, but the public will not take appropriate action unless there is successful communication between both parties,” WPC says. “Visuals are just as important as verbal communication when conveying hazards, which is where the WSSI product becomes an effective tool for weather personnel.” Here’s a video explaining the basics:
WSSI components
The WSSI maps show impacts over the next 72 hours, and for Day 1, Day 2, and Day 3 of a storm.
The index is based on six equally weighted components:
1) Snow amount: This component depends on both the amount and rate of snowfall while also accounting for local conditions and the social dimension. “Those areas of the country less accustomed to snowfall will be less prepared to deal with snow, resulting in higher levels of impacts than the same amount of snow in a snowier part of the country,” WPC says.
2) Snow load: This forecast is calculated using snow water equivalent, a measure of snow’s liquid content. “This component is significant because the weight of the snow creates a threat to the structural integrity of residential and commercial buildings, as well as tree and powerline damage,” WPC notes.
3) Blowing snow: This component is calculated by combining snowfall, maximum wind gusts, and the snow-to-liquid ratio, a measure of the snow’s density and susceptibility to fly around. Blowing snow, which you’ll typically find in open areas rather than in a dense forest, can wreck visibility and create whiteout conditions. “It takes just under 20 mph of wind to start to move snow around,” according to WPC.
4) Ground blizzard: This component is similar to blowing snow since it highlights places where visibility issues may impact transportation, but the measure is based on winds mobilizing pre-existing snow, rather than flakes falling from the sky. In fact, you can experience a ground blizzard even when the sun is shining. A blizzard, by the way, requires sustained or frequent gusts to at least 35 mph, according to the National Weather Service.
5) Flash freeze: It sounds like a method for producing TV dinners in a factory, but flash freezing is unappetizing because it can create the dreaded black ice, a transparent glaze on a road that can be treacherous since it’s so hard to detect while driving. “Flash freeze occurs when the air temperature starts above freezing, then falls below freezing in a short period of time, and there is remnant moisture/precipitation occurring at the same time,” WPC says. Bridges and overpasses are hot spots for black ice because cold air flows underneath the roadway and lowers its temperature, hence all the warning signs. Bridges and overpasses also are susceptible to black ice because they’re usually made of concrete and steel, which don’t retain heat as well as asphalt.
6) Ice accumulation: This element is based on the forecast for ice and maximum wind gusts. Ice storms can cause “tree damage, transportation shutdowns and utility problems,” according to WPC. To that list, I might add the vast number of people who take a tumble on the ice. At least in Denver, where I used to live, you could theoretically be fined $150 by the city if you didn’t clear your sidewalk in a timely manner.
WSSI versus other forecasts
The WSSI website lets you see the overall threat or check the severity of each of the six components. Although WSSI is a great way to gauge a storm’s punch, the National Weather Service says that it should be used in conjunction with the more familiar watches, advisories, and warnings issued by the agency, adding that WSSI “does not account for conditions that have occurred prior to the creation time.”
Winter storm watches are a heads-up issued “when hazardous winter storm conditions are possible within the next 3 to 4 days, but the timing, intensity, or occurrence may still be uncertain,” according to my local forecast office in Grand Junction.
The criteria for issuing winter storm advisories and warnings vary across the nation, and even within a single forecast office’s geographic purview. For example, the Grand Junction office covers Colorado’s Western Slope and Eastern Utah, which ranges from 14ers down to the red rock country of the Colorado Plateau—more than 10,000 feet in elevation difference. Here’s how the Grand Junction office handles winter storm warnings and advisories in different areas:
I’m all about fun in the snow and shredding the gnar, but winter weather can also make for a costly, deadly disaster. Statistically, driving to and from the trailhead or ski resort can be one of the most dangerous parts of the day. WSSI is a useful tool for forecasting a storm’s strength and making risk/reward calculations.
Snow buries a vehicle in the parking lot at Purgatory ski area on February 23, 2022. Photo by Mitch Tobin.
Snow News is a free multimedia newsletter that covers the science of snow and the state of the snowpack.
The Water Desk’s mission is to increase the volume, depth and power of journalism connected to Western water issues. We’re an initiative of the Center for Environmental Journalism at the University of Colorado Boulder.


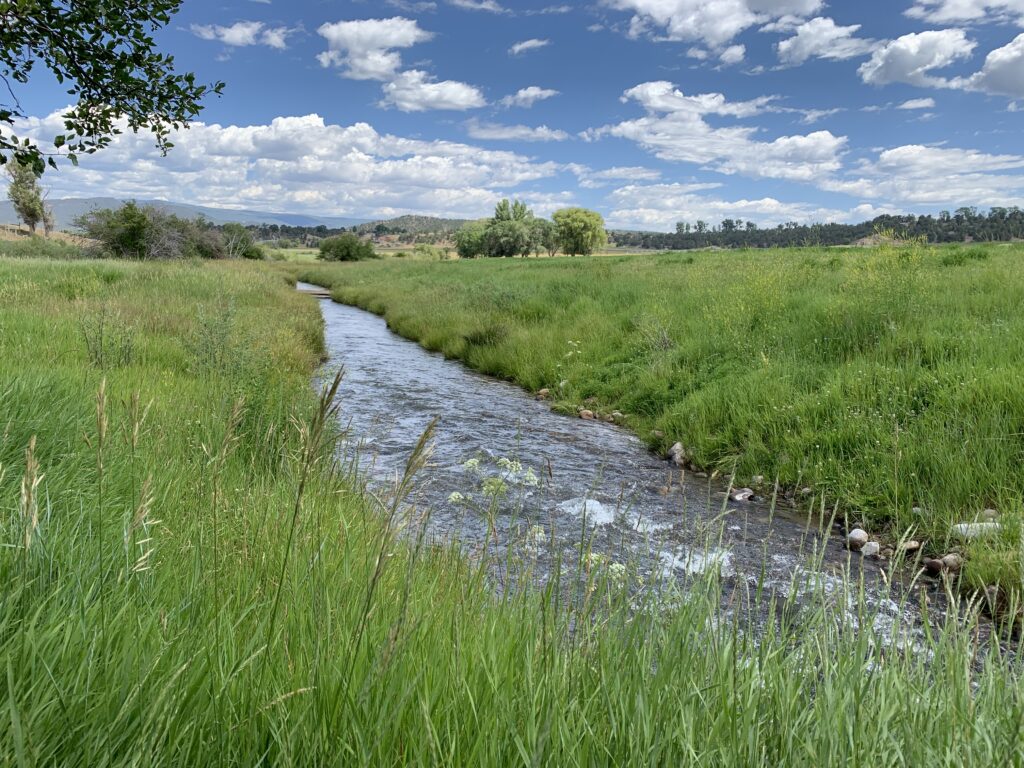
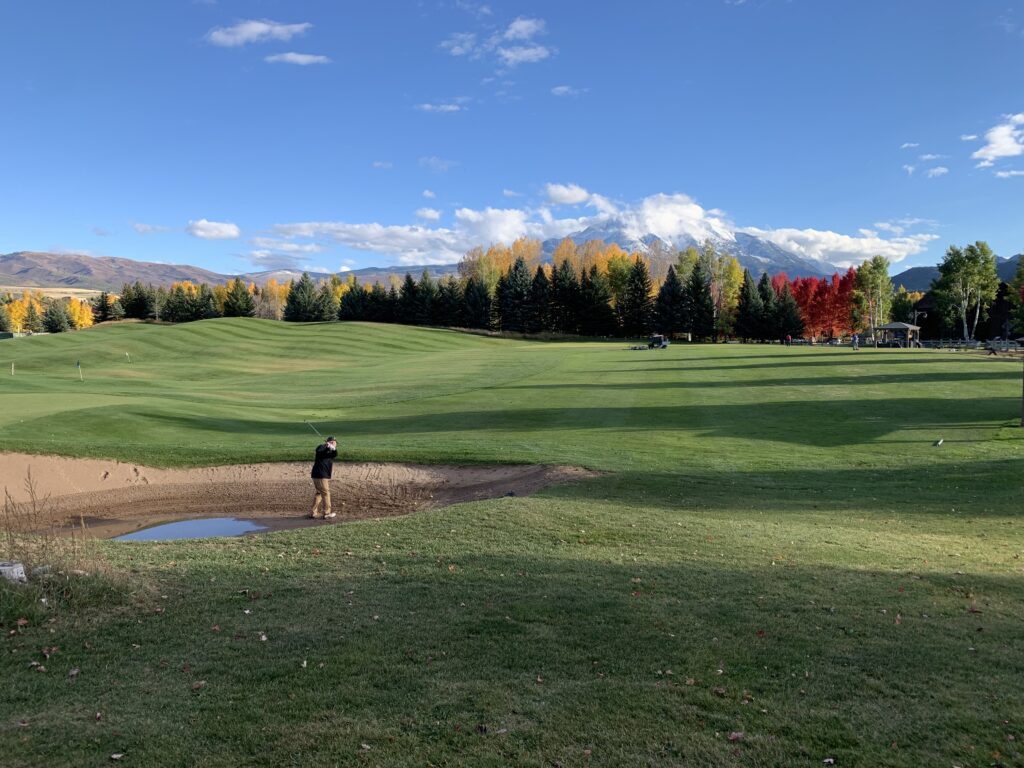
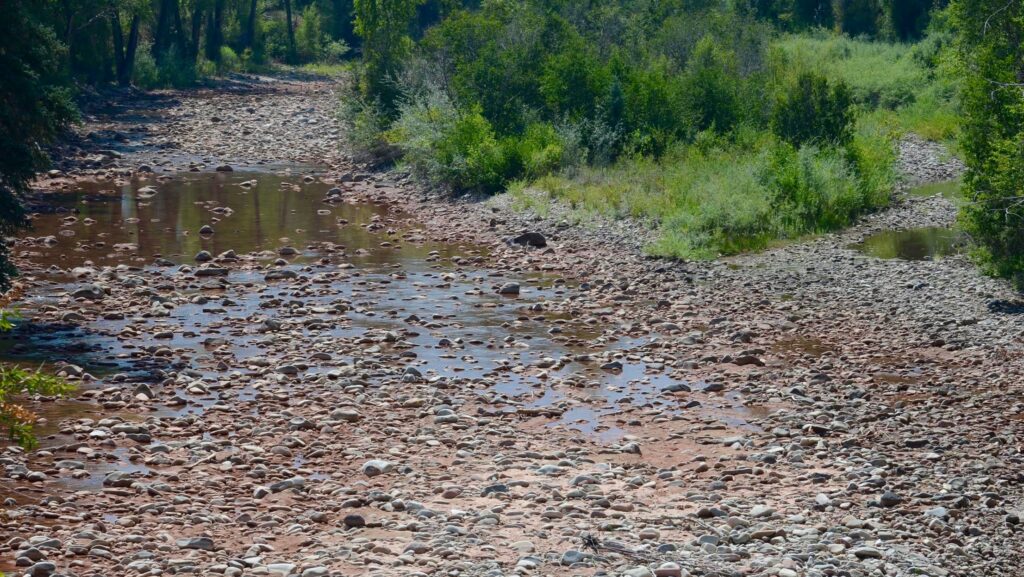
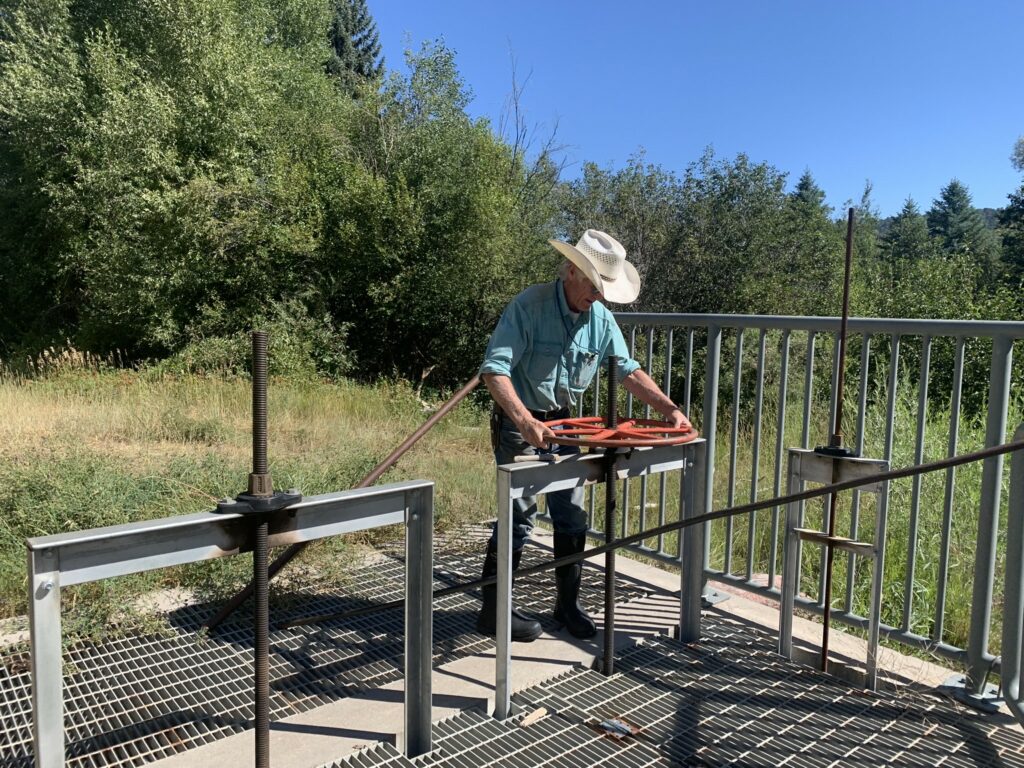

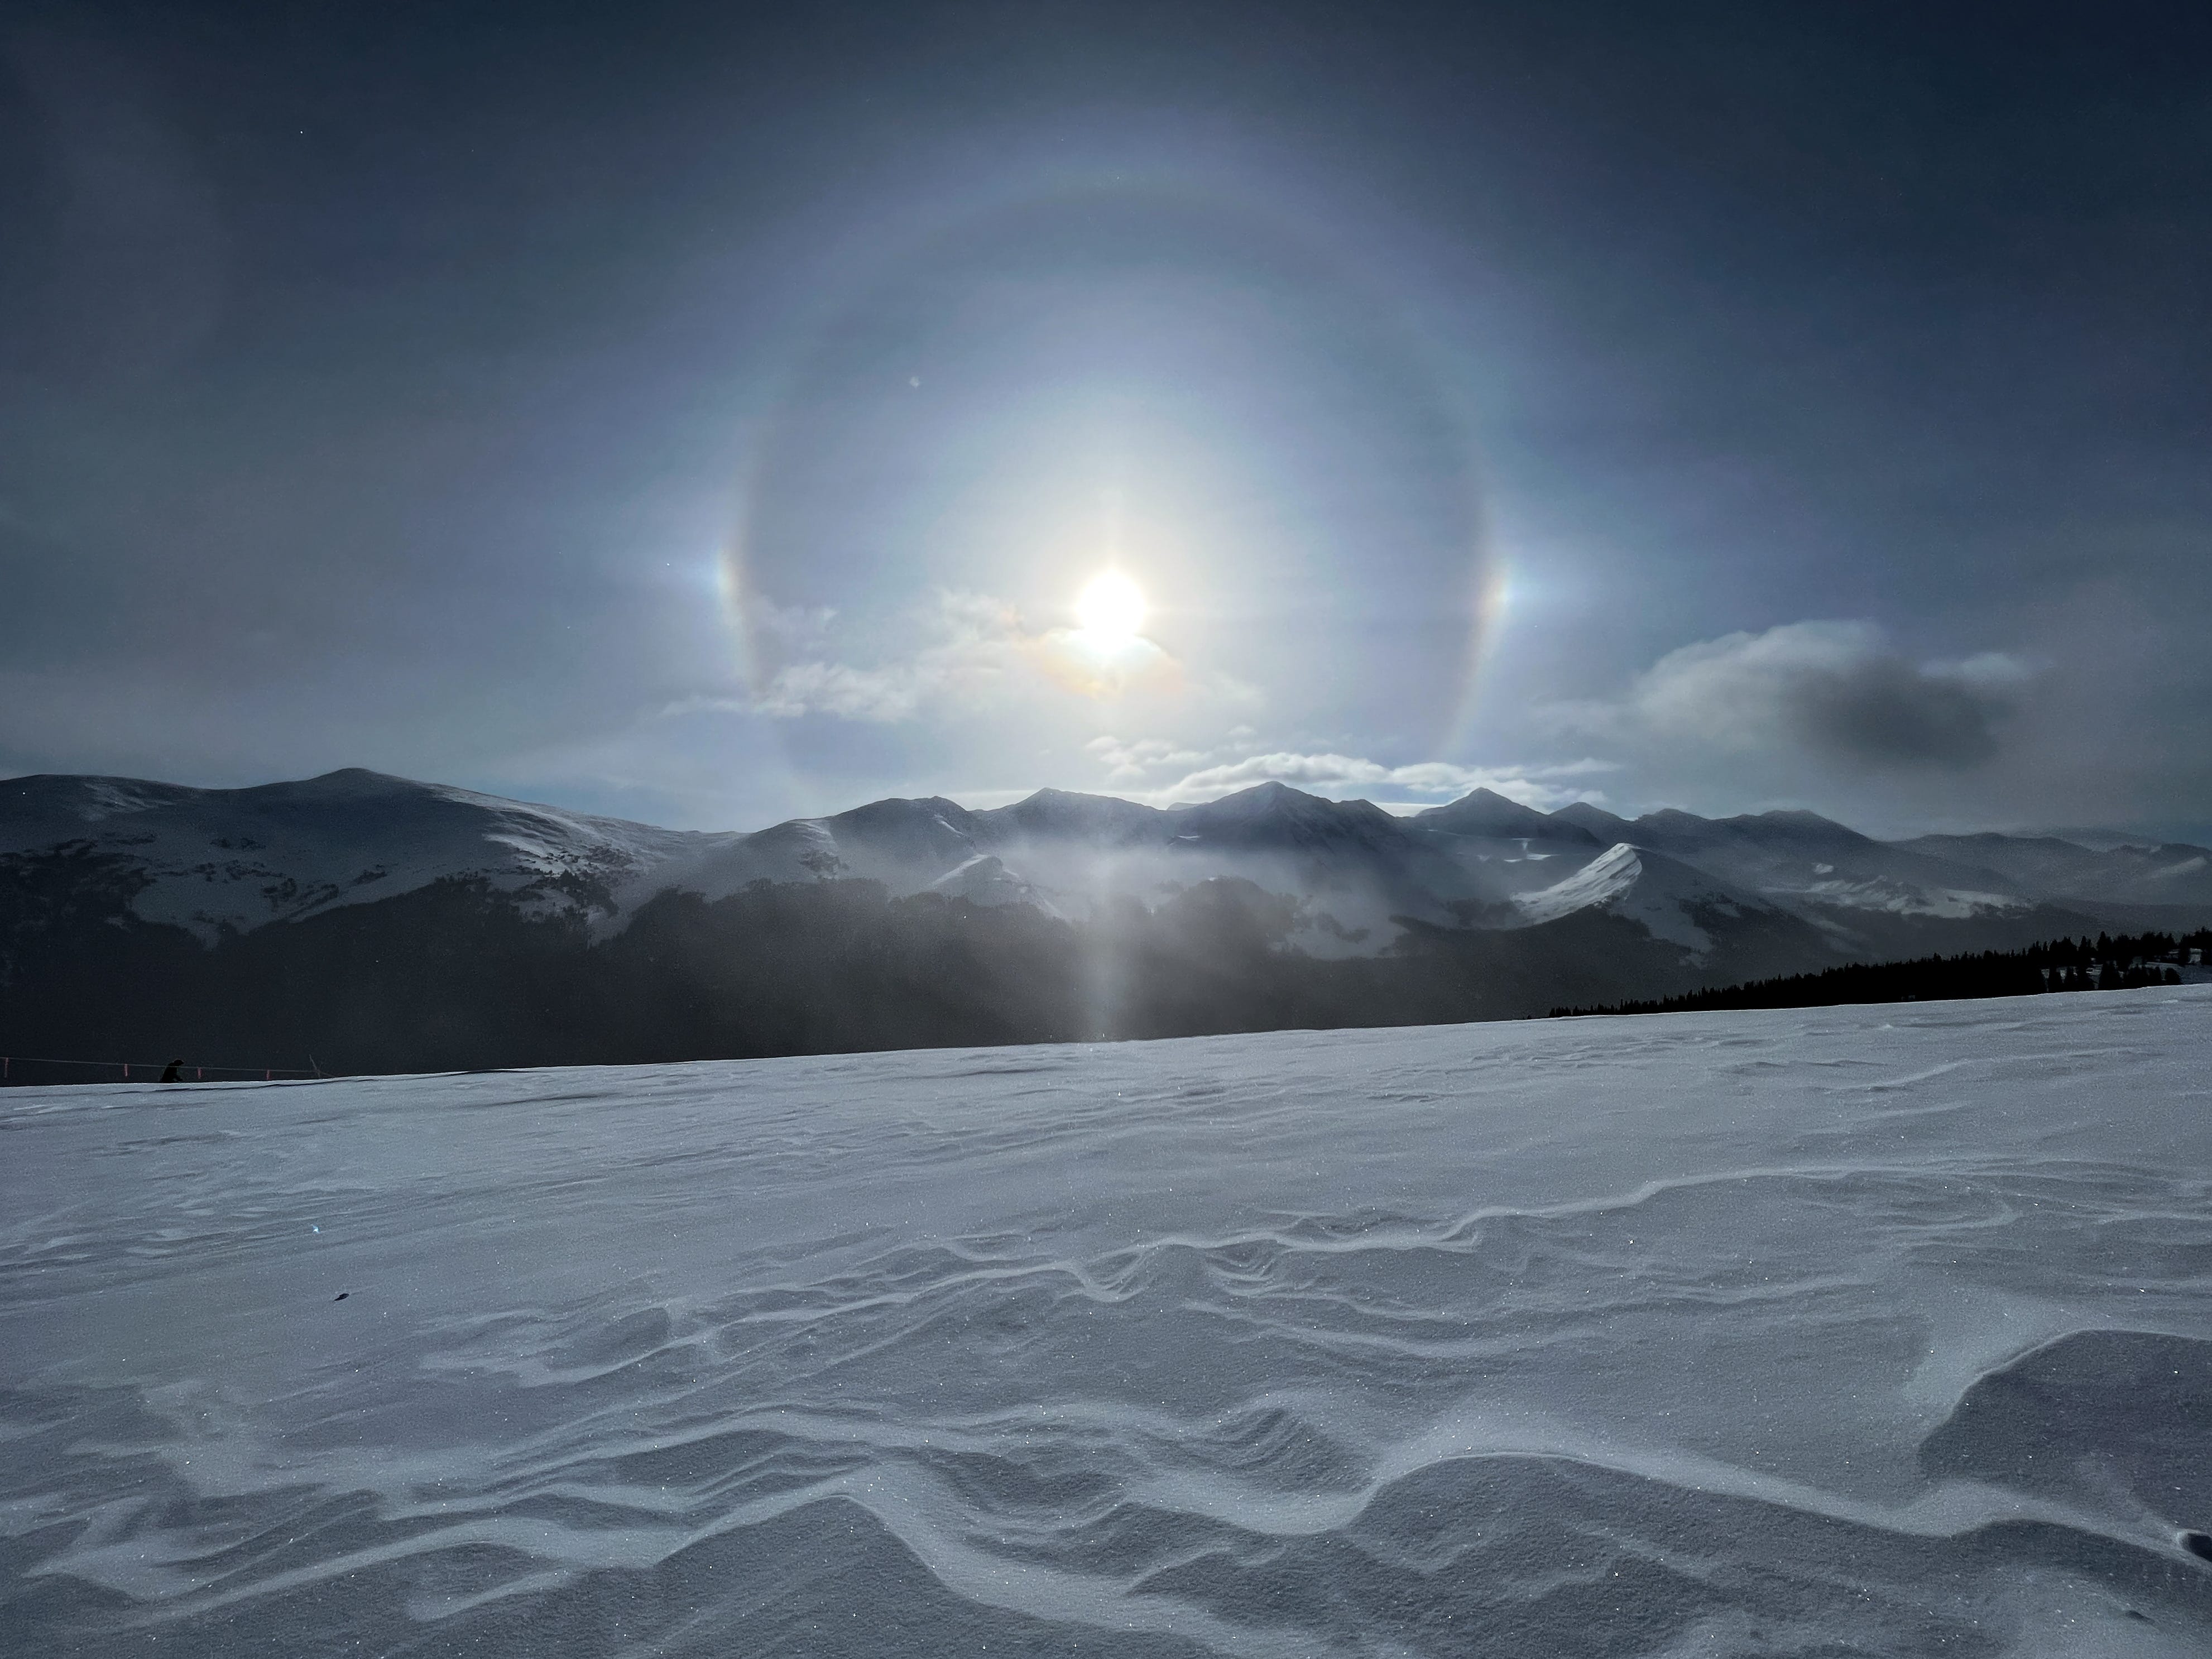
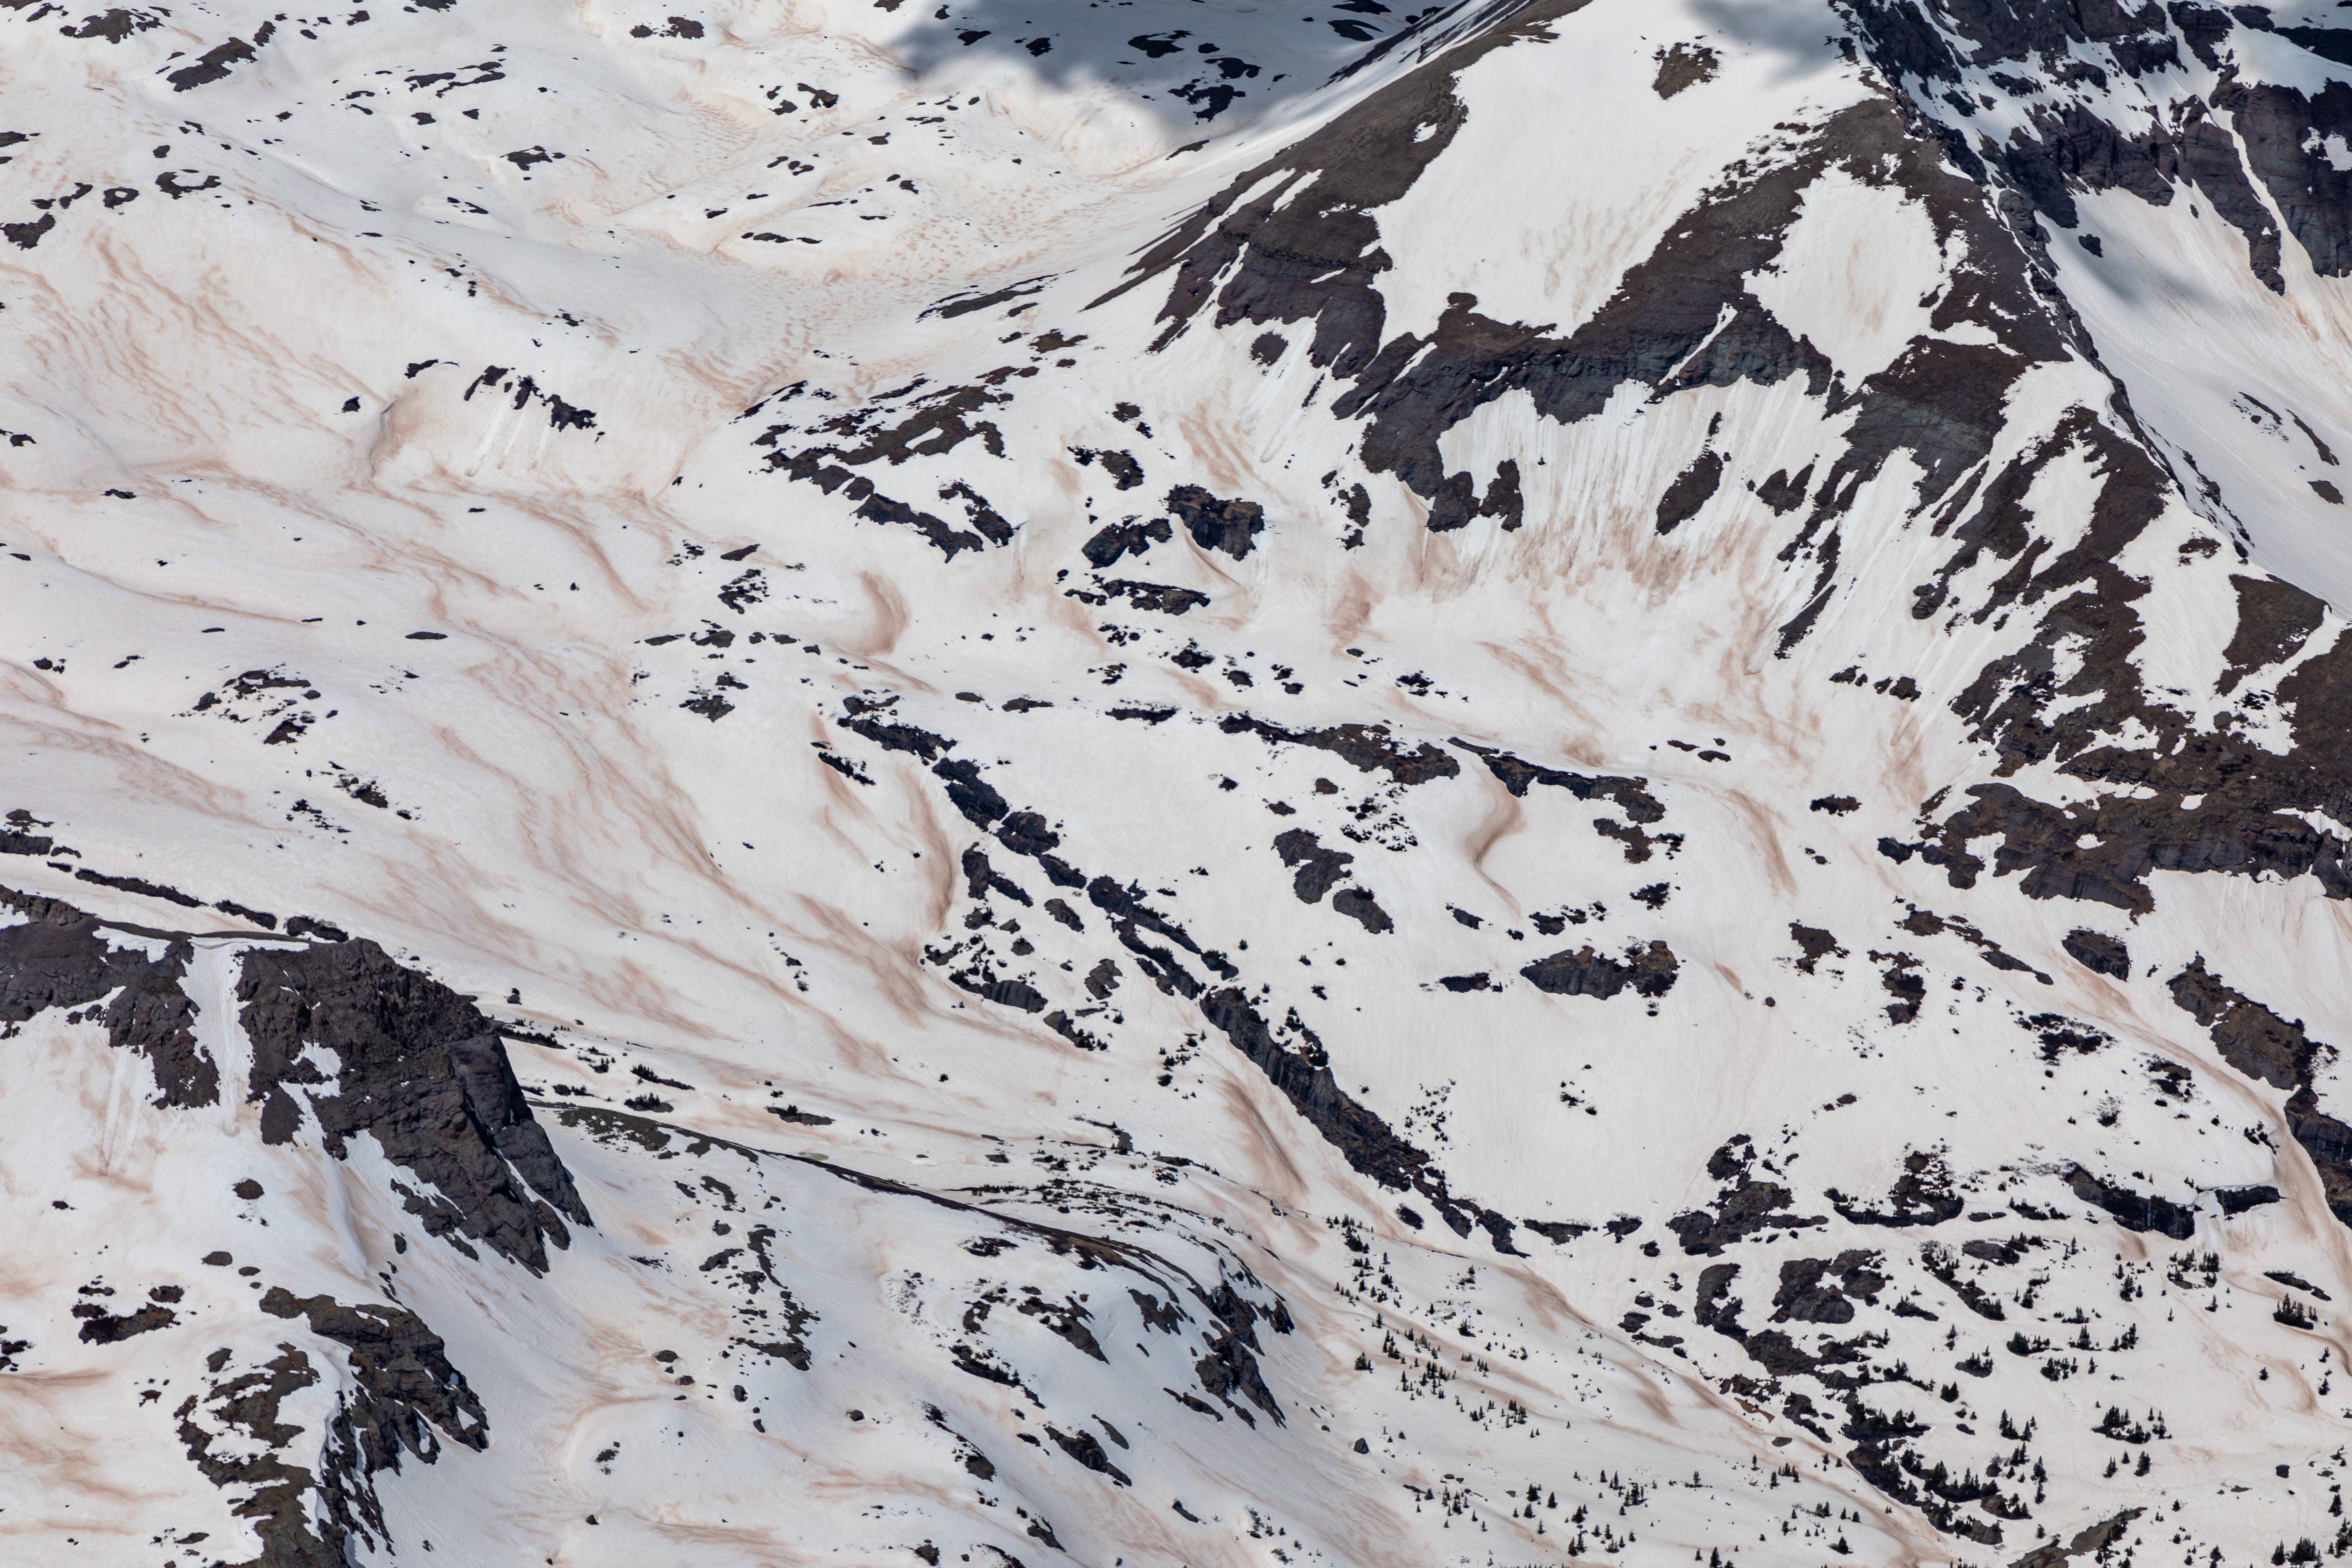
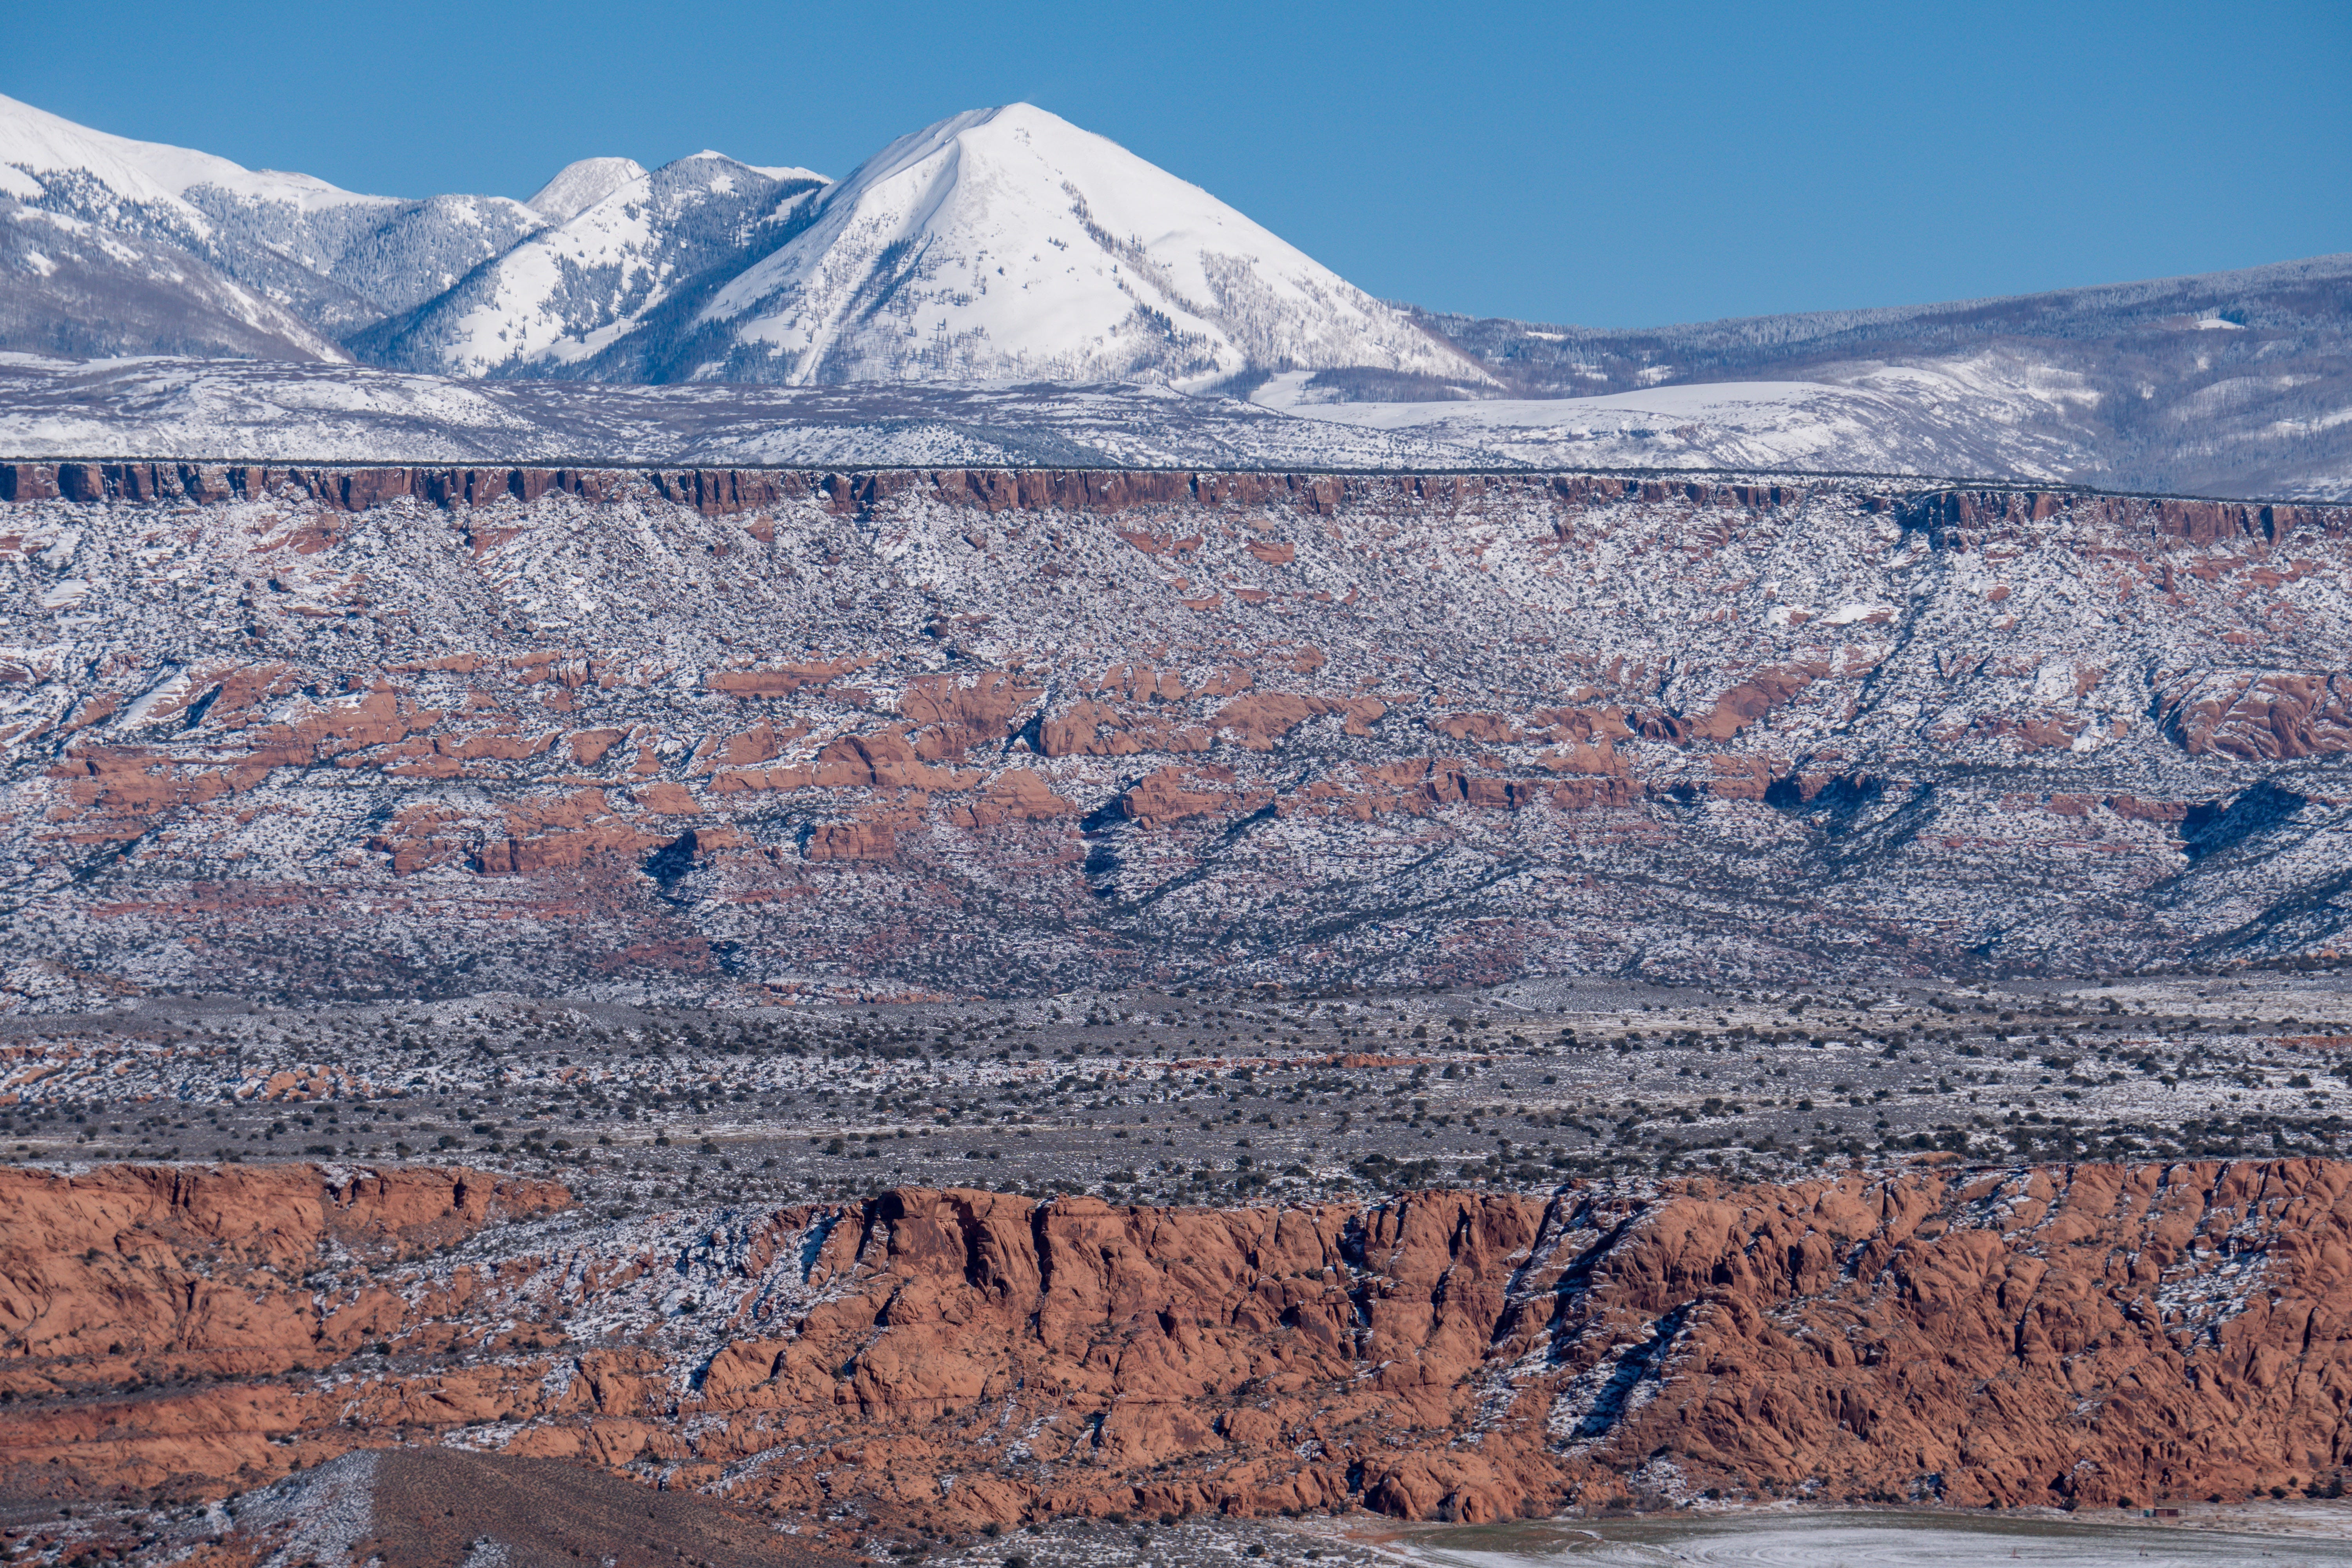


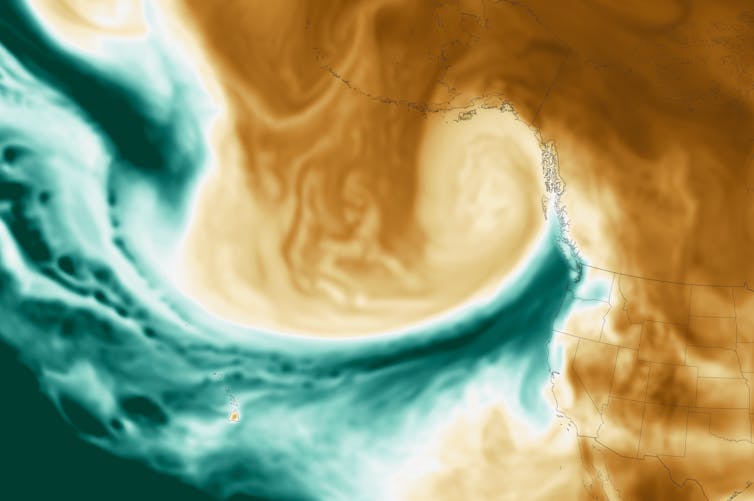

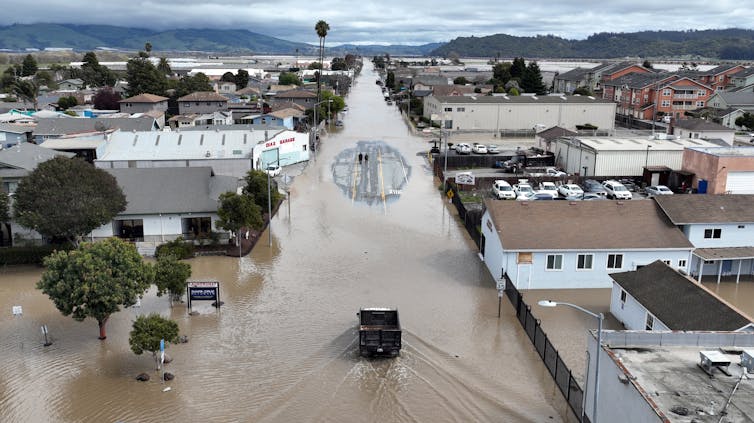
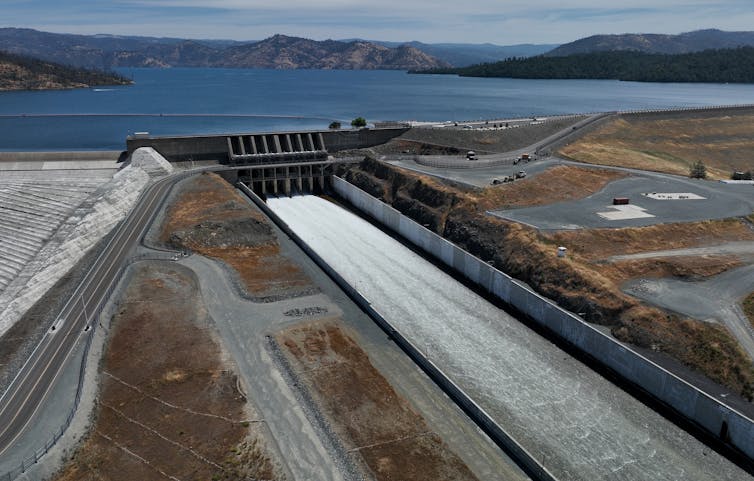


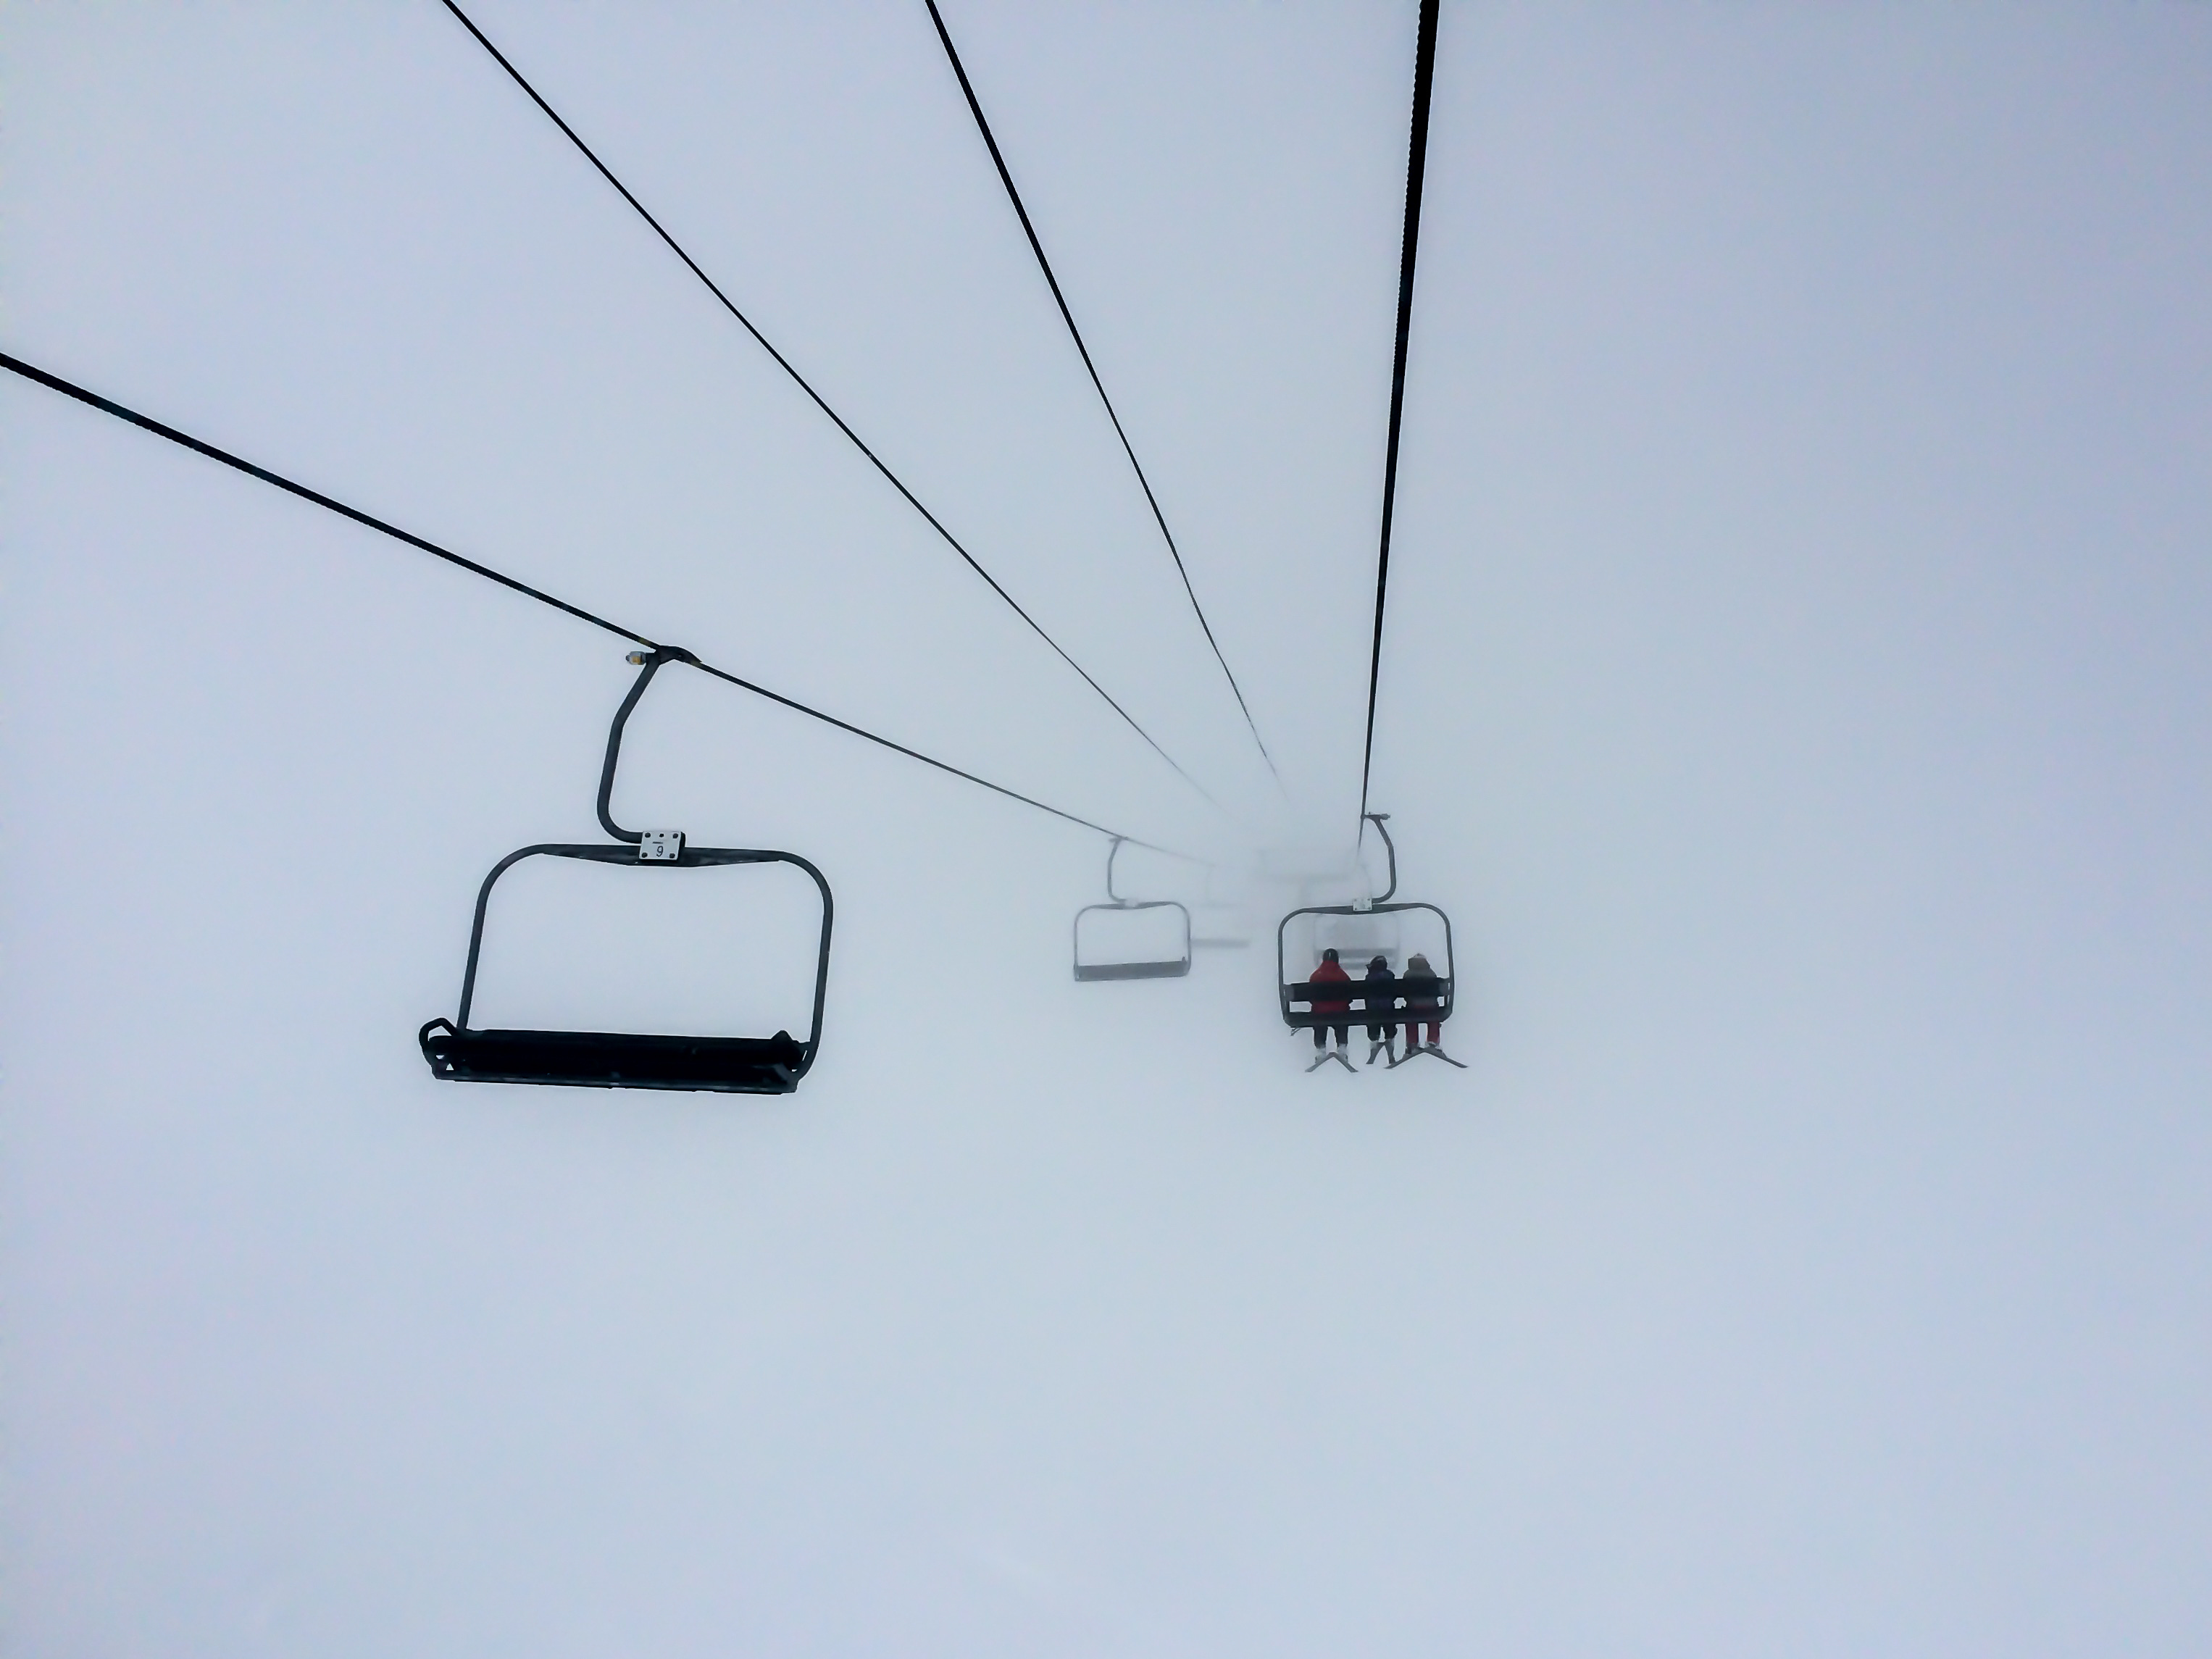

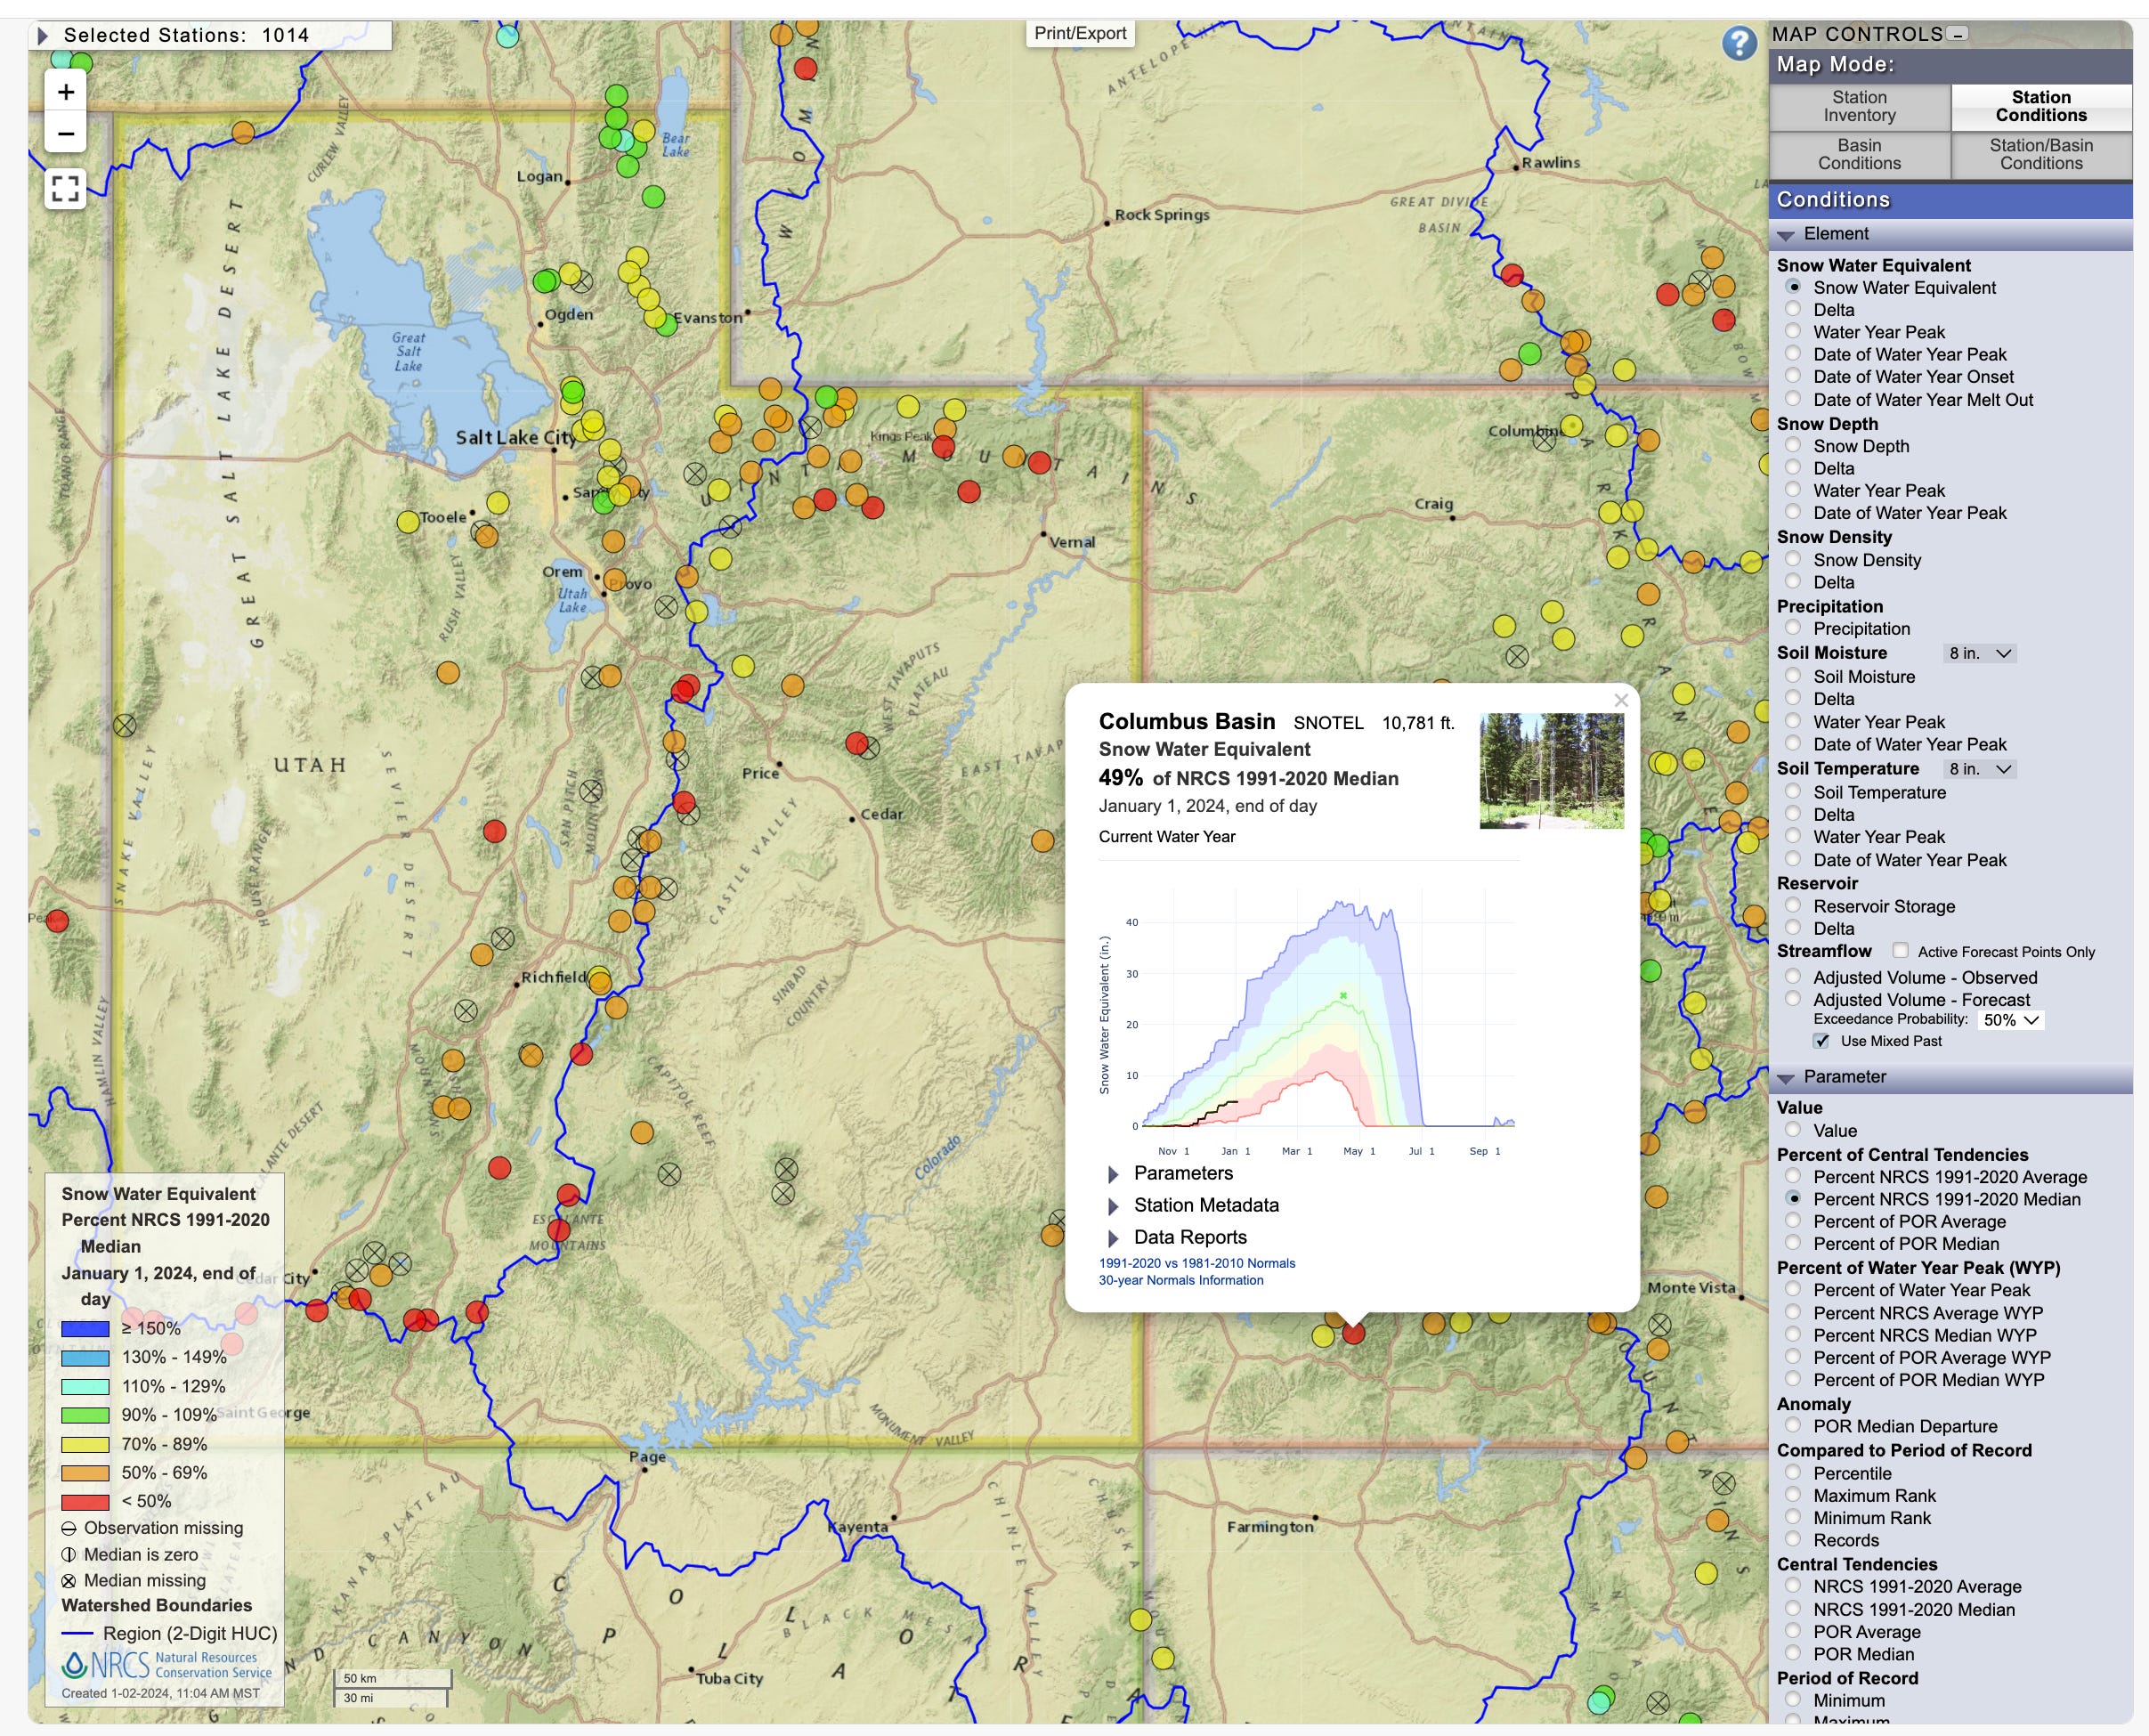
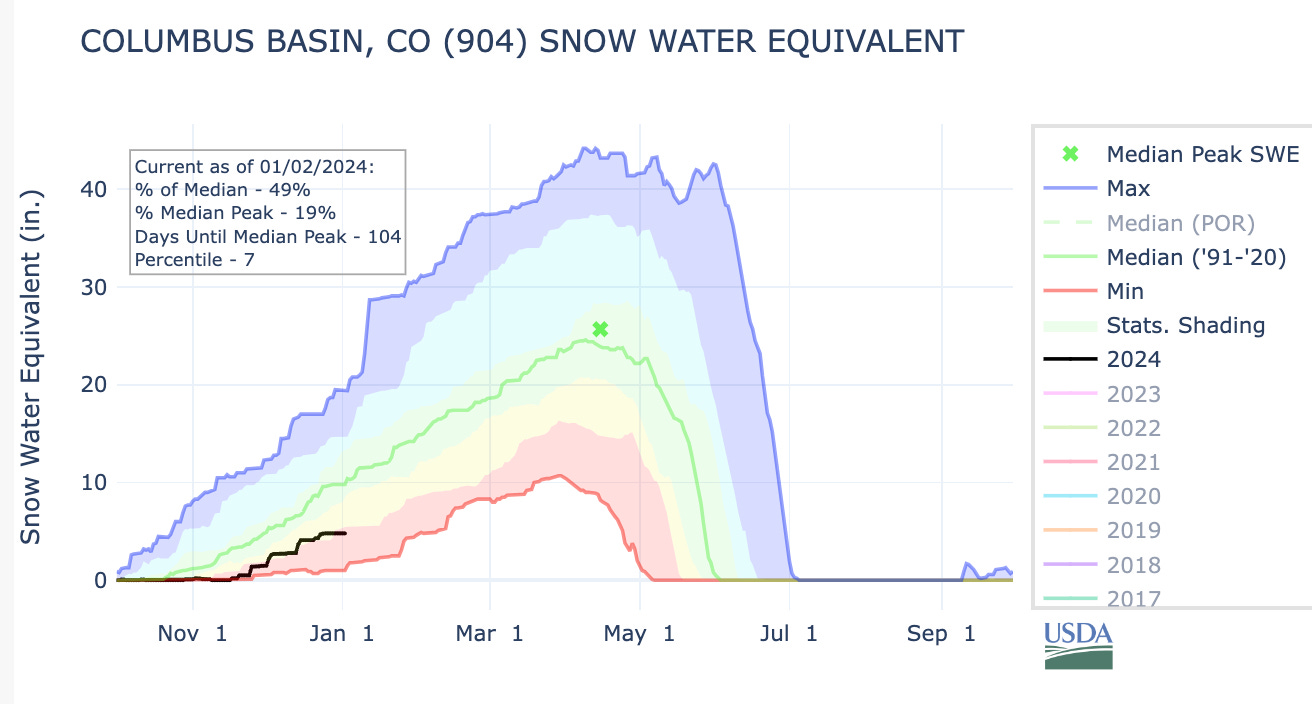

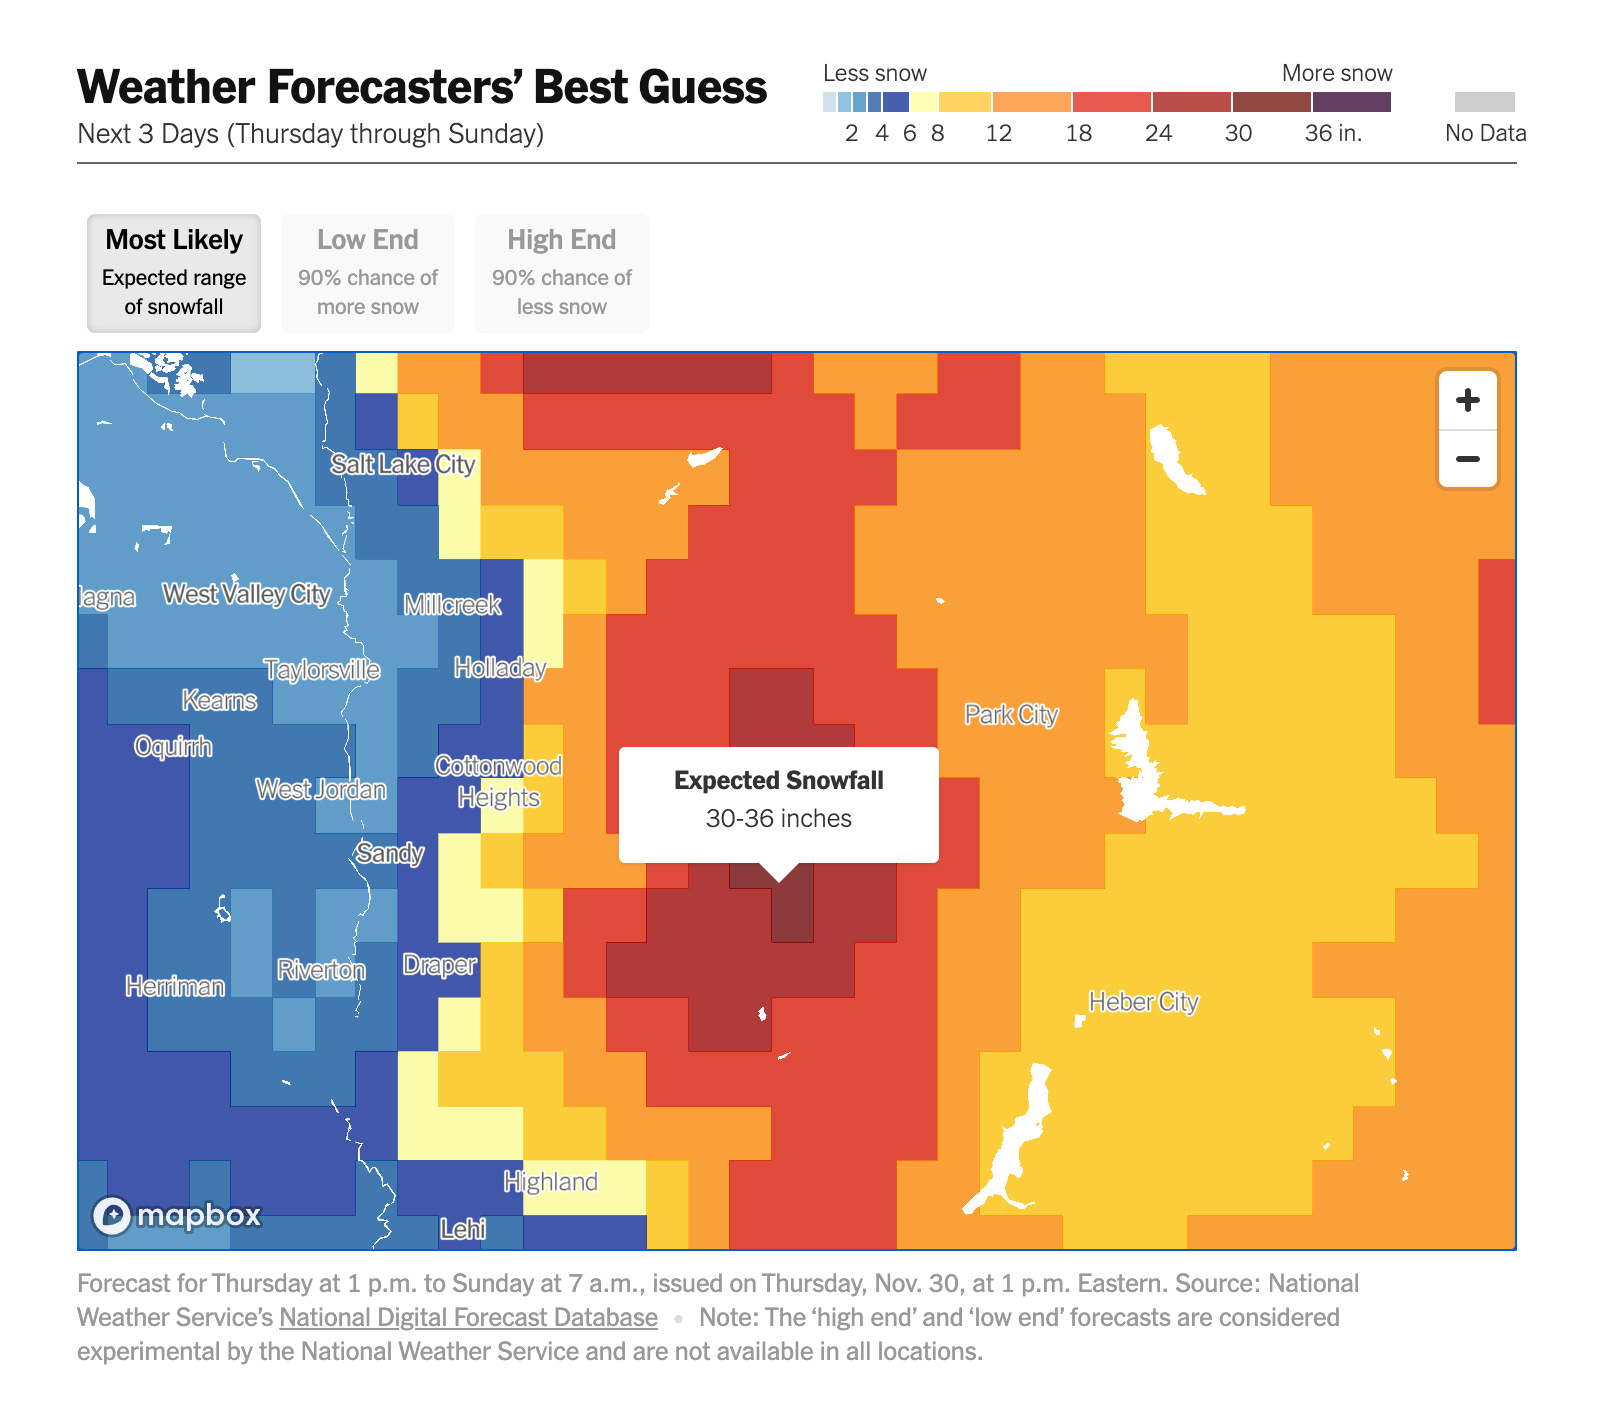


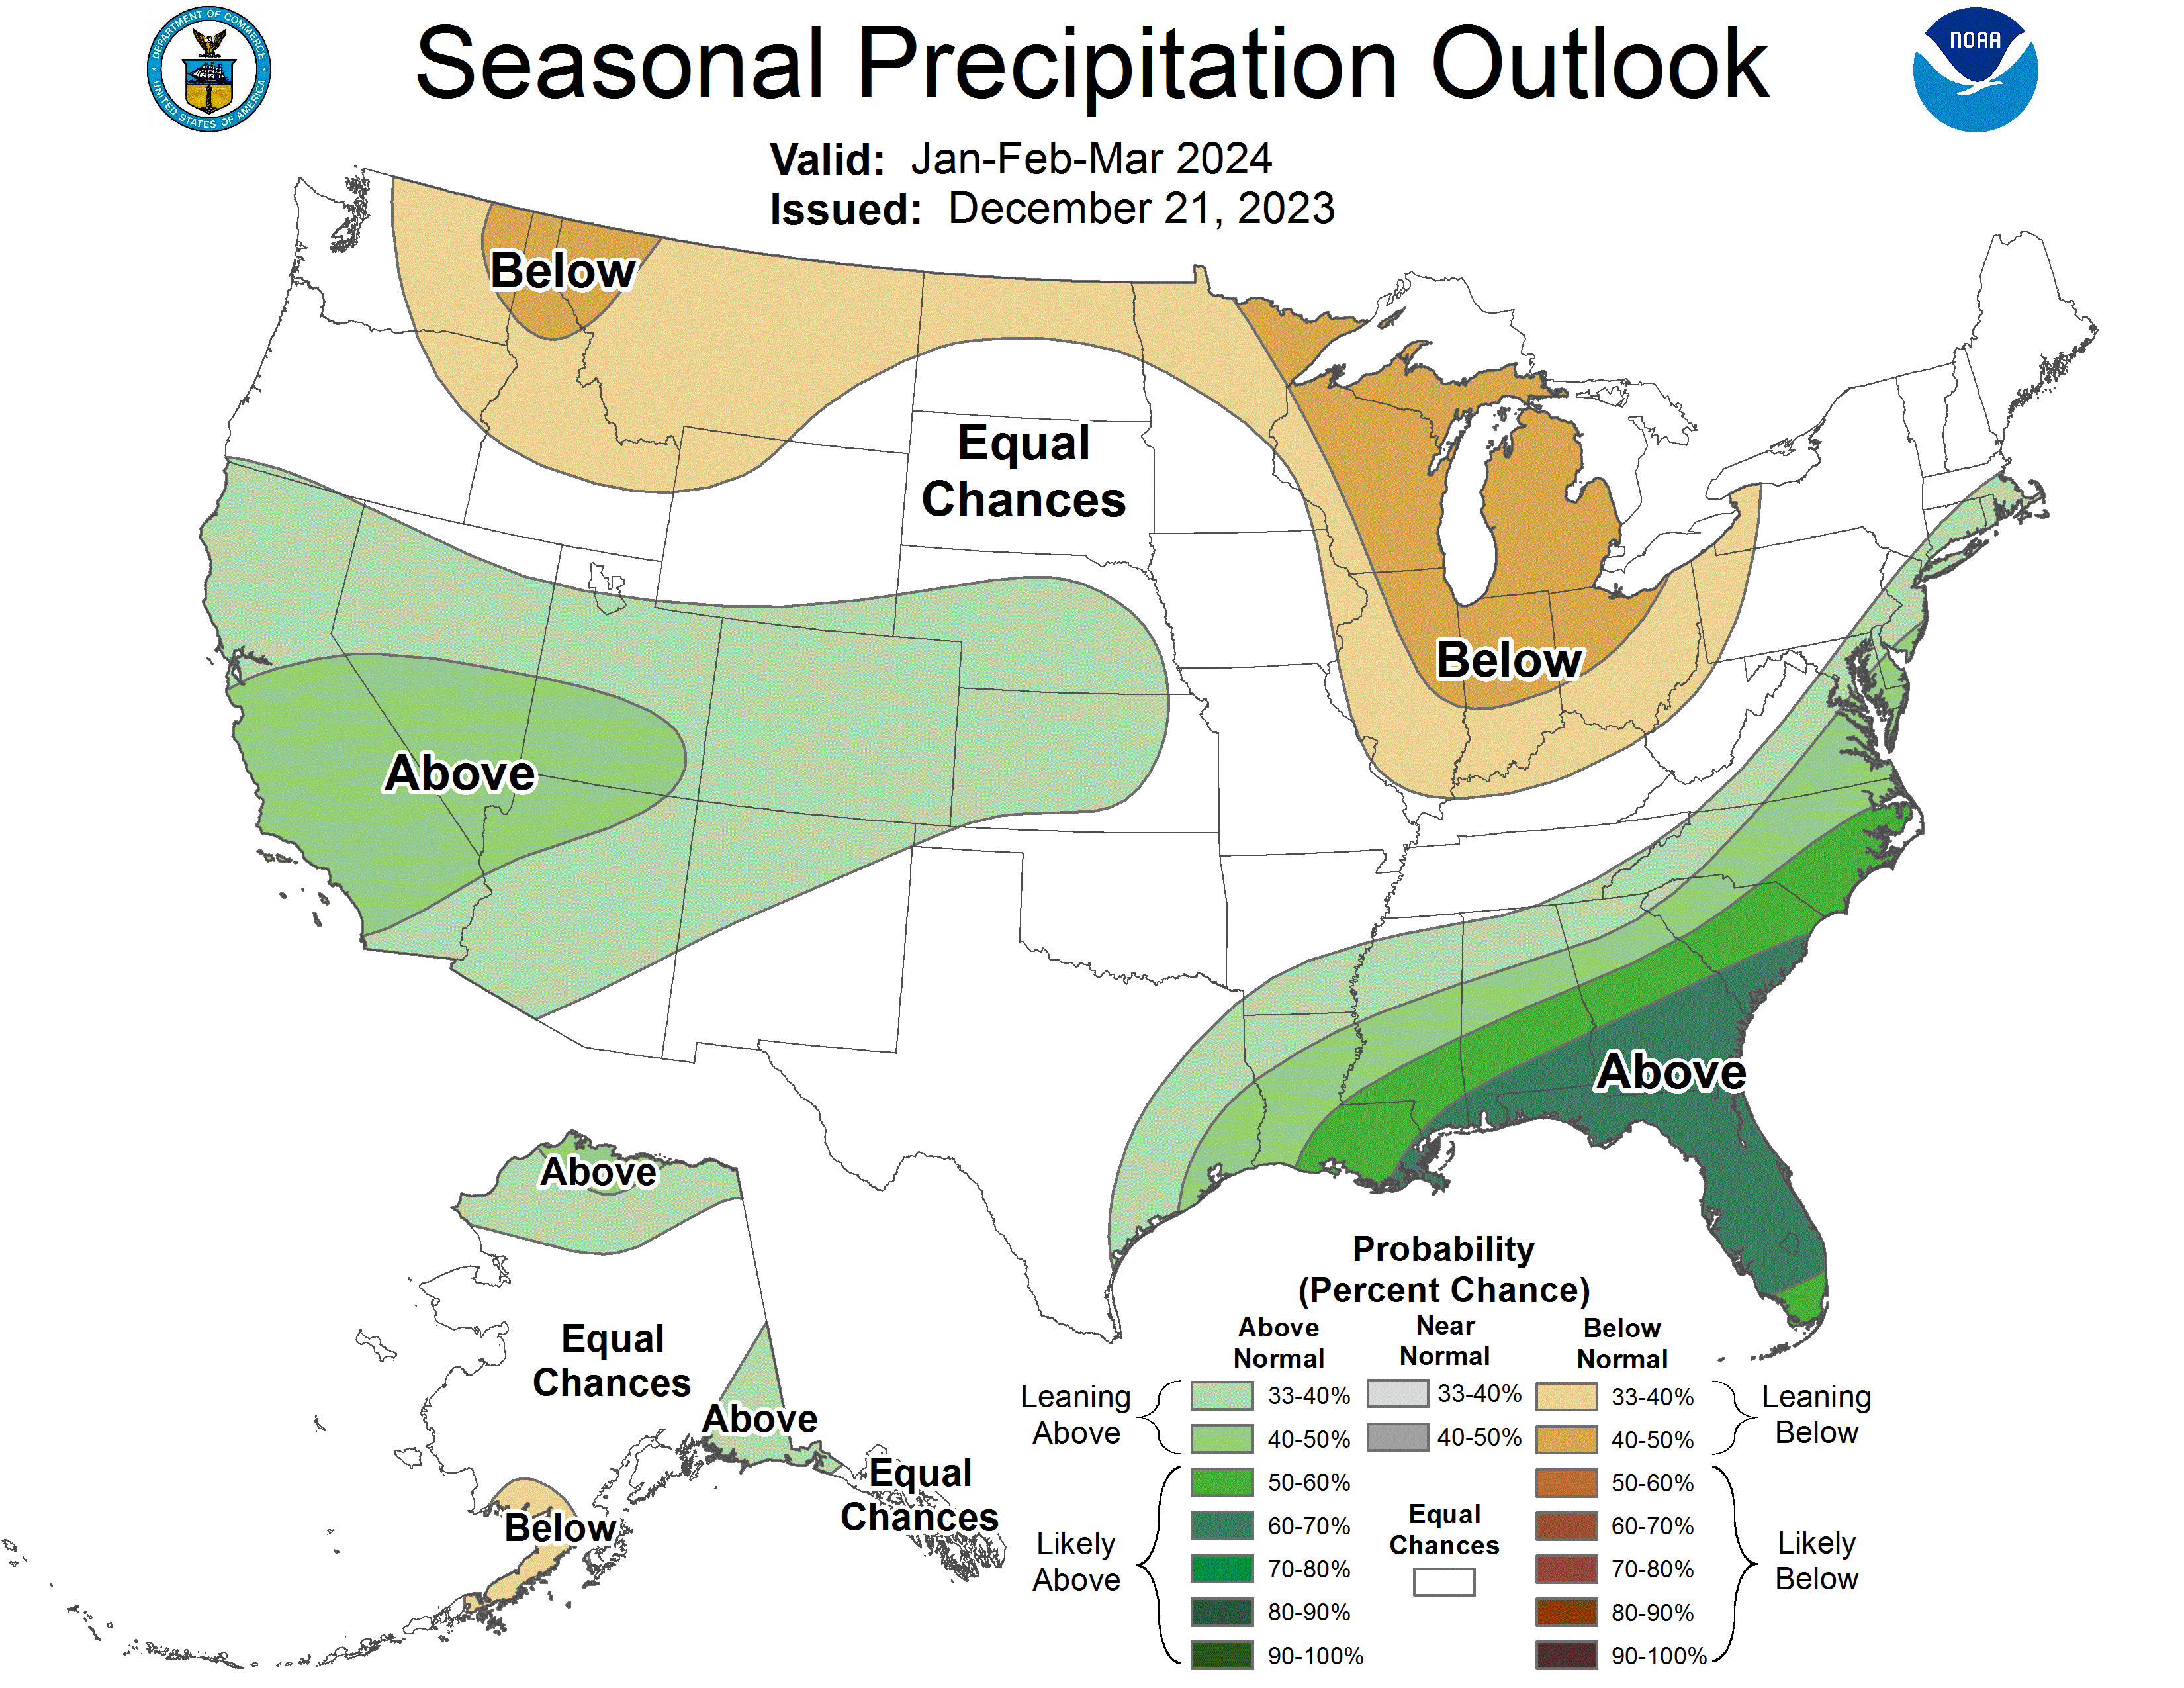

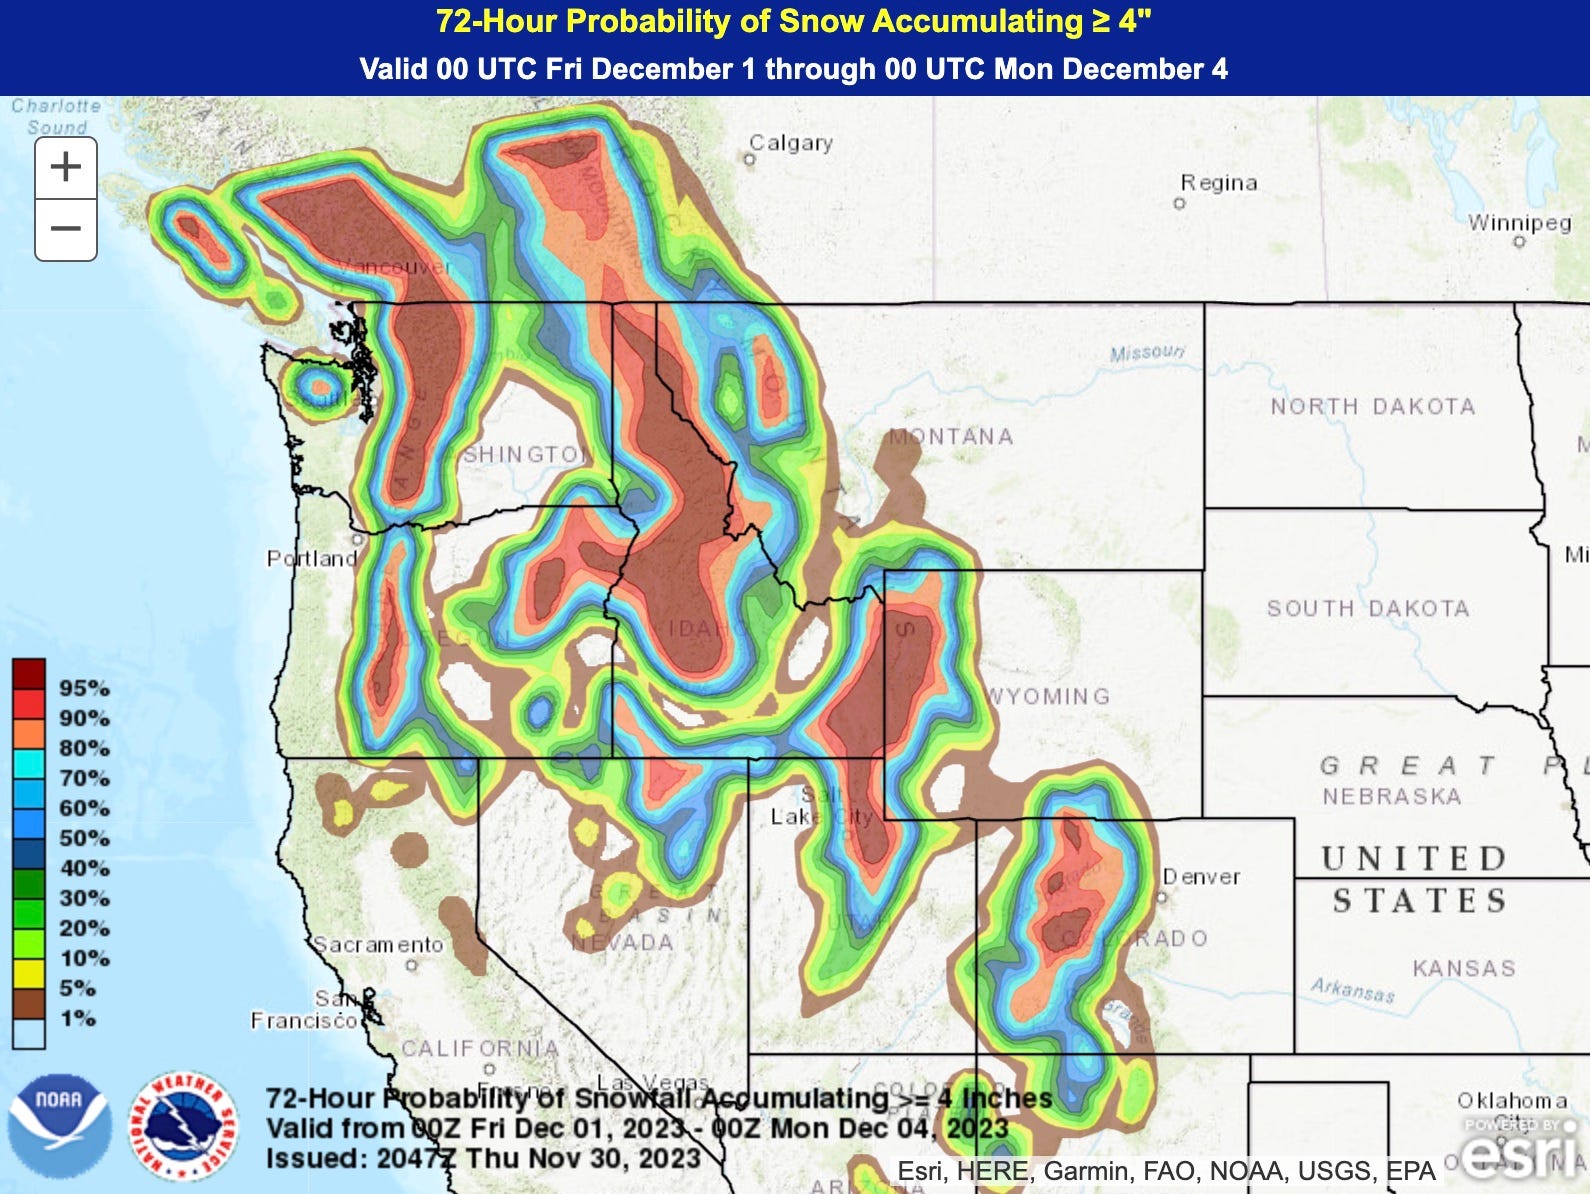
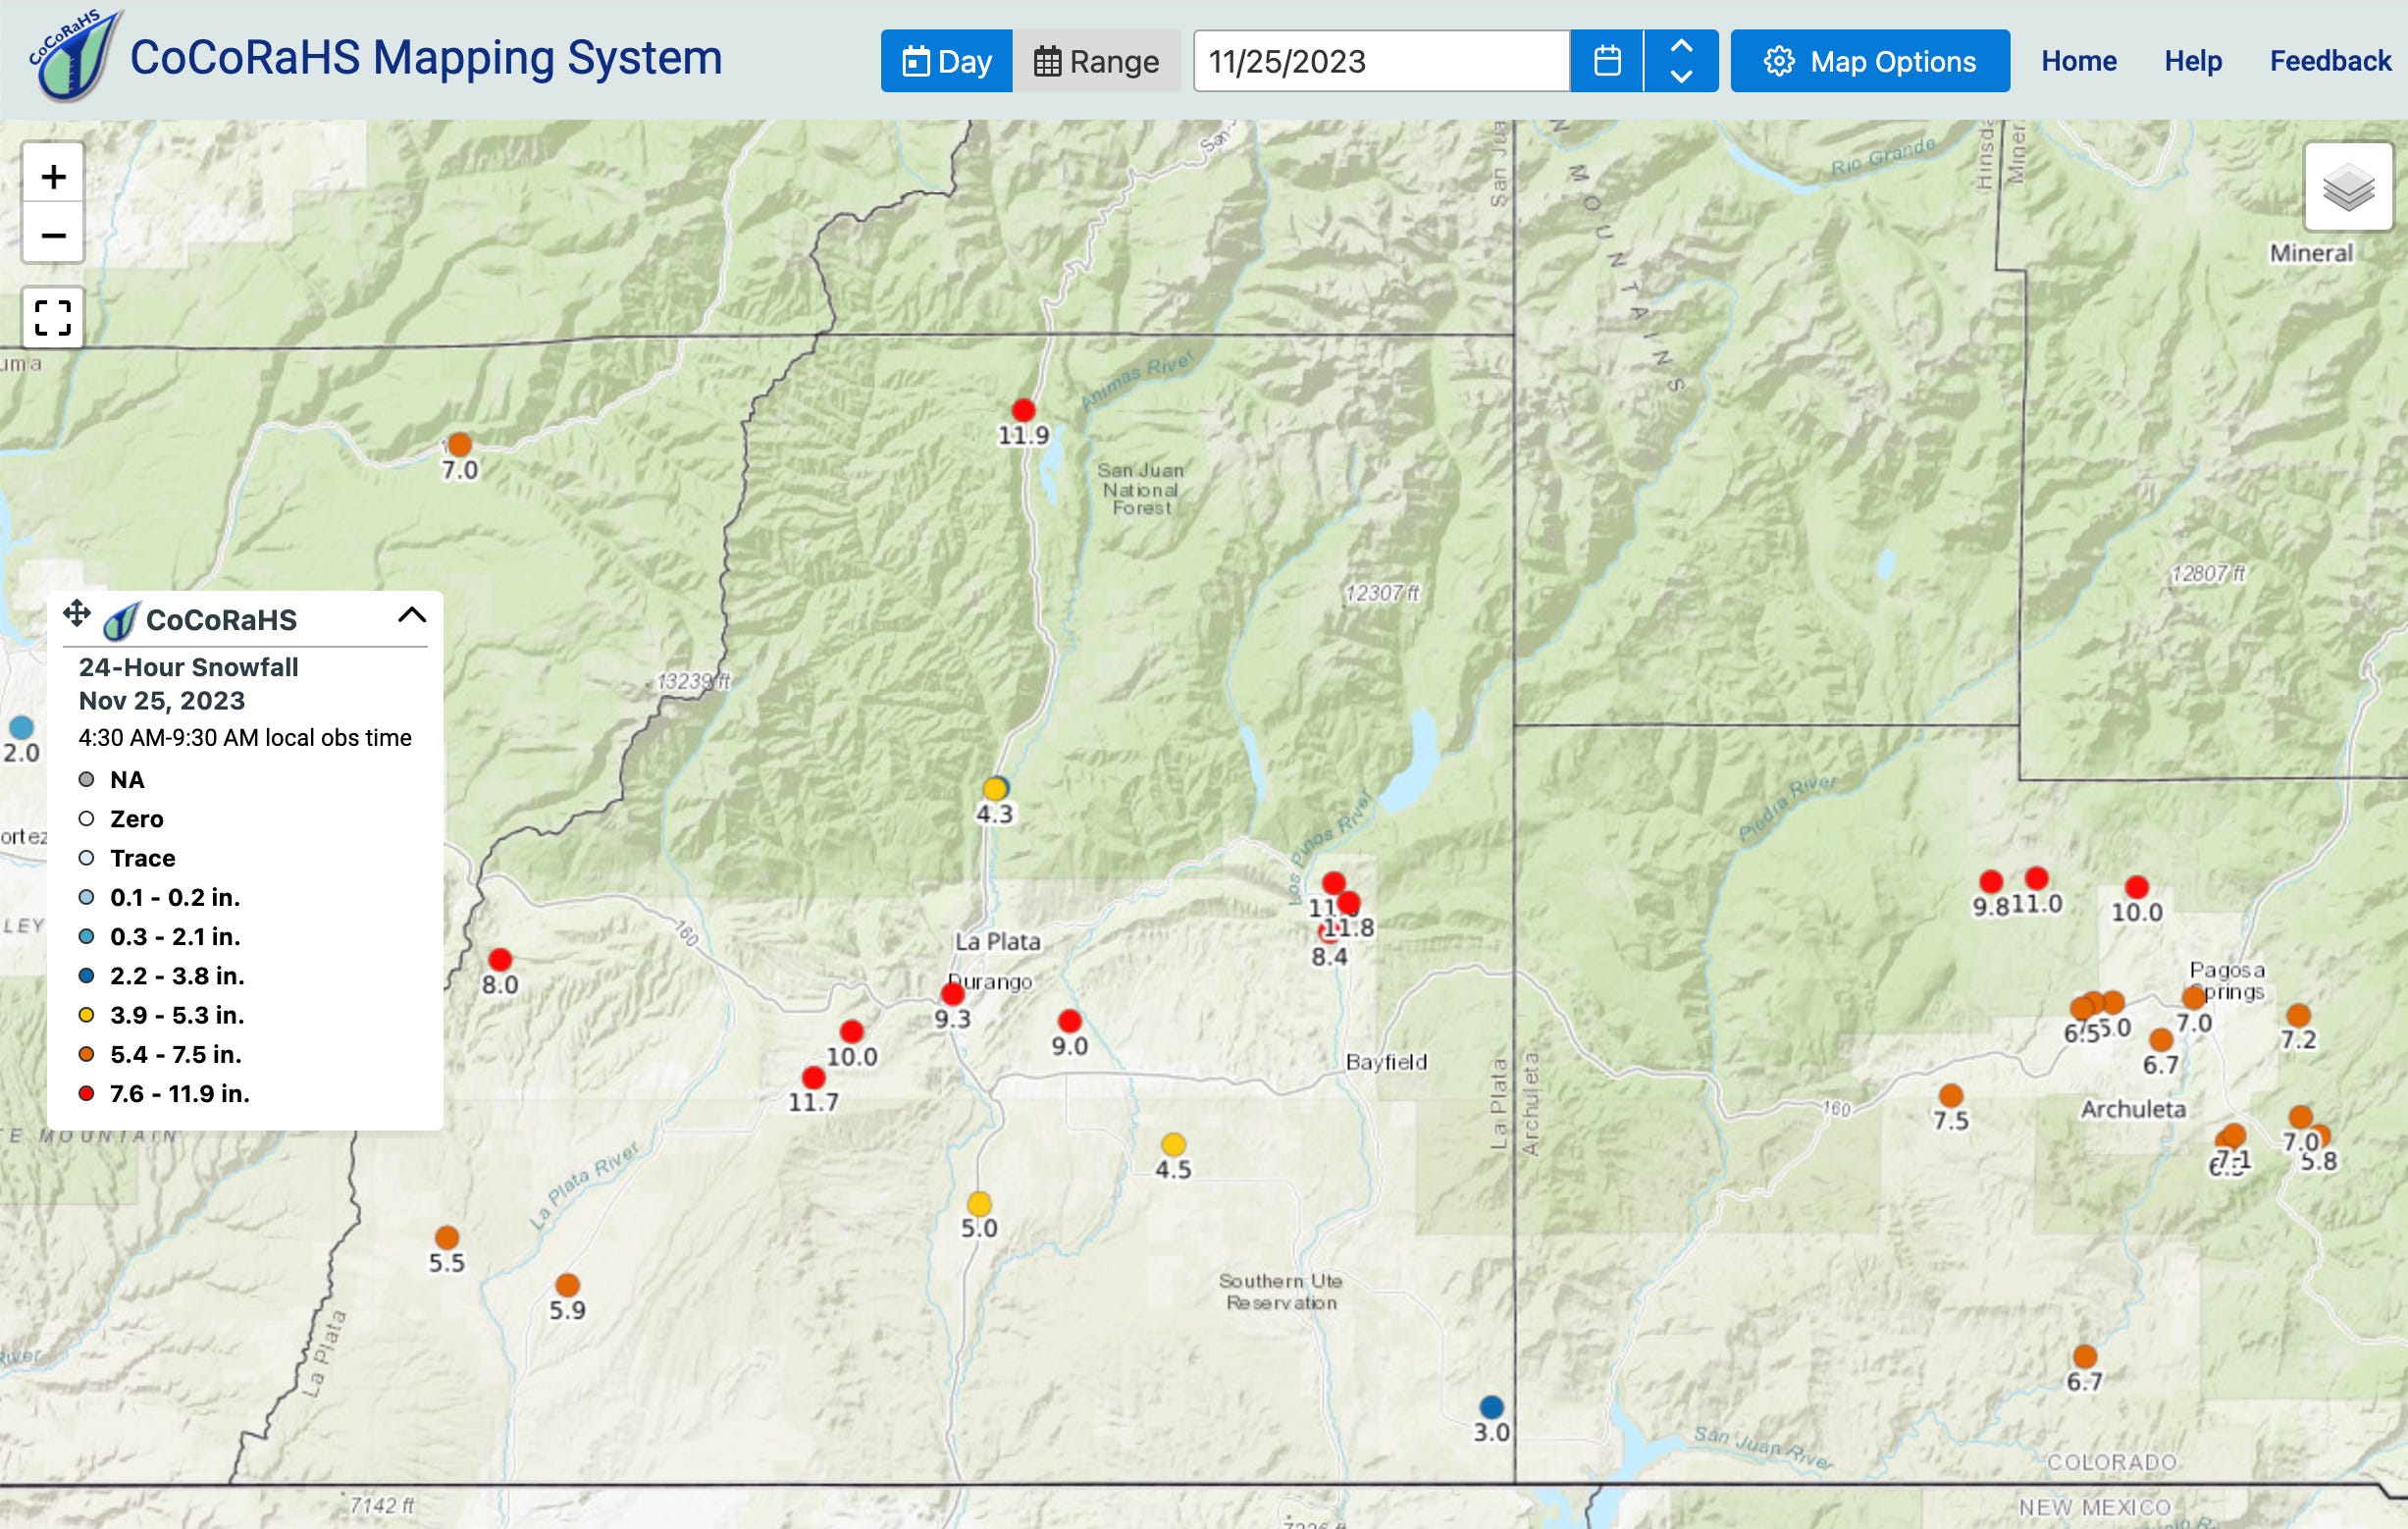

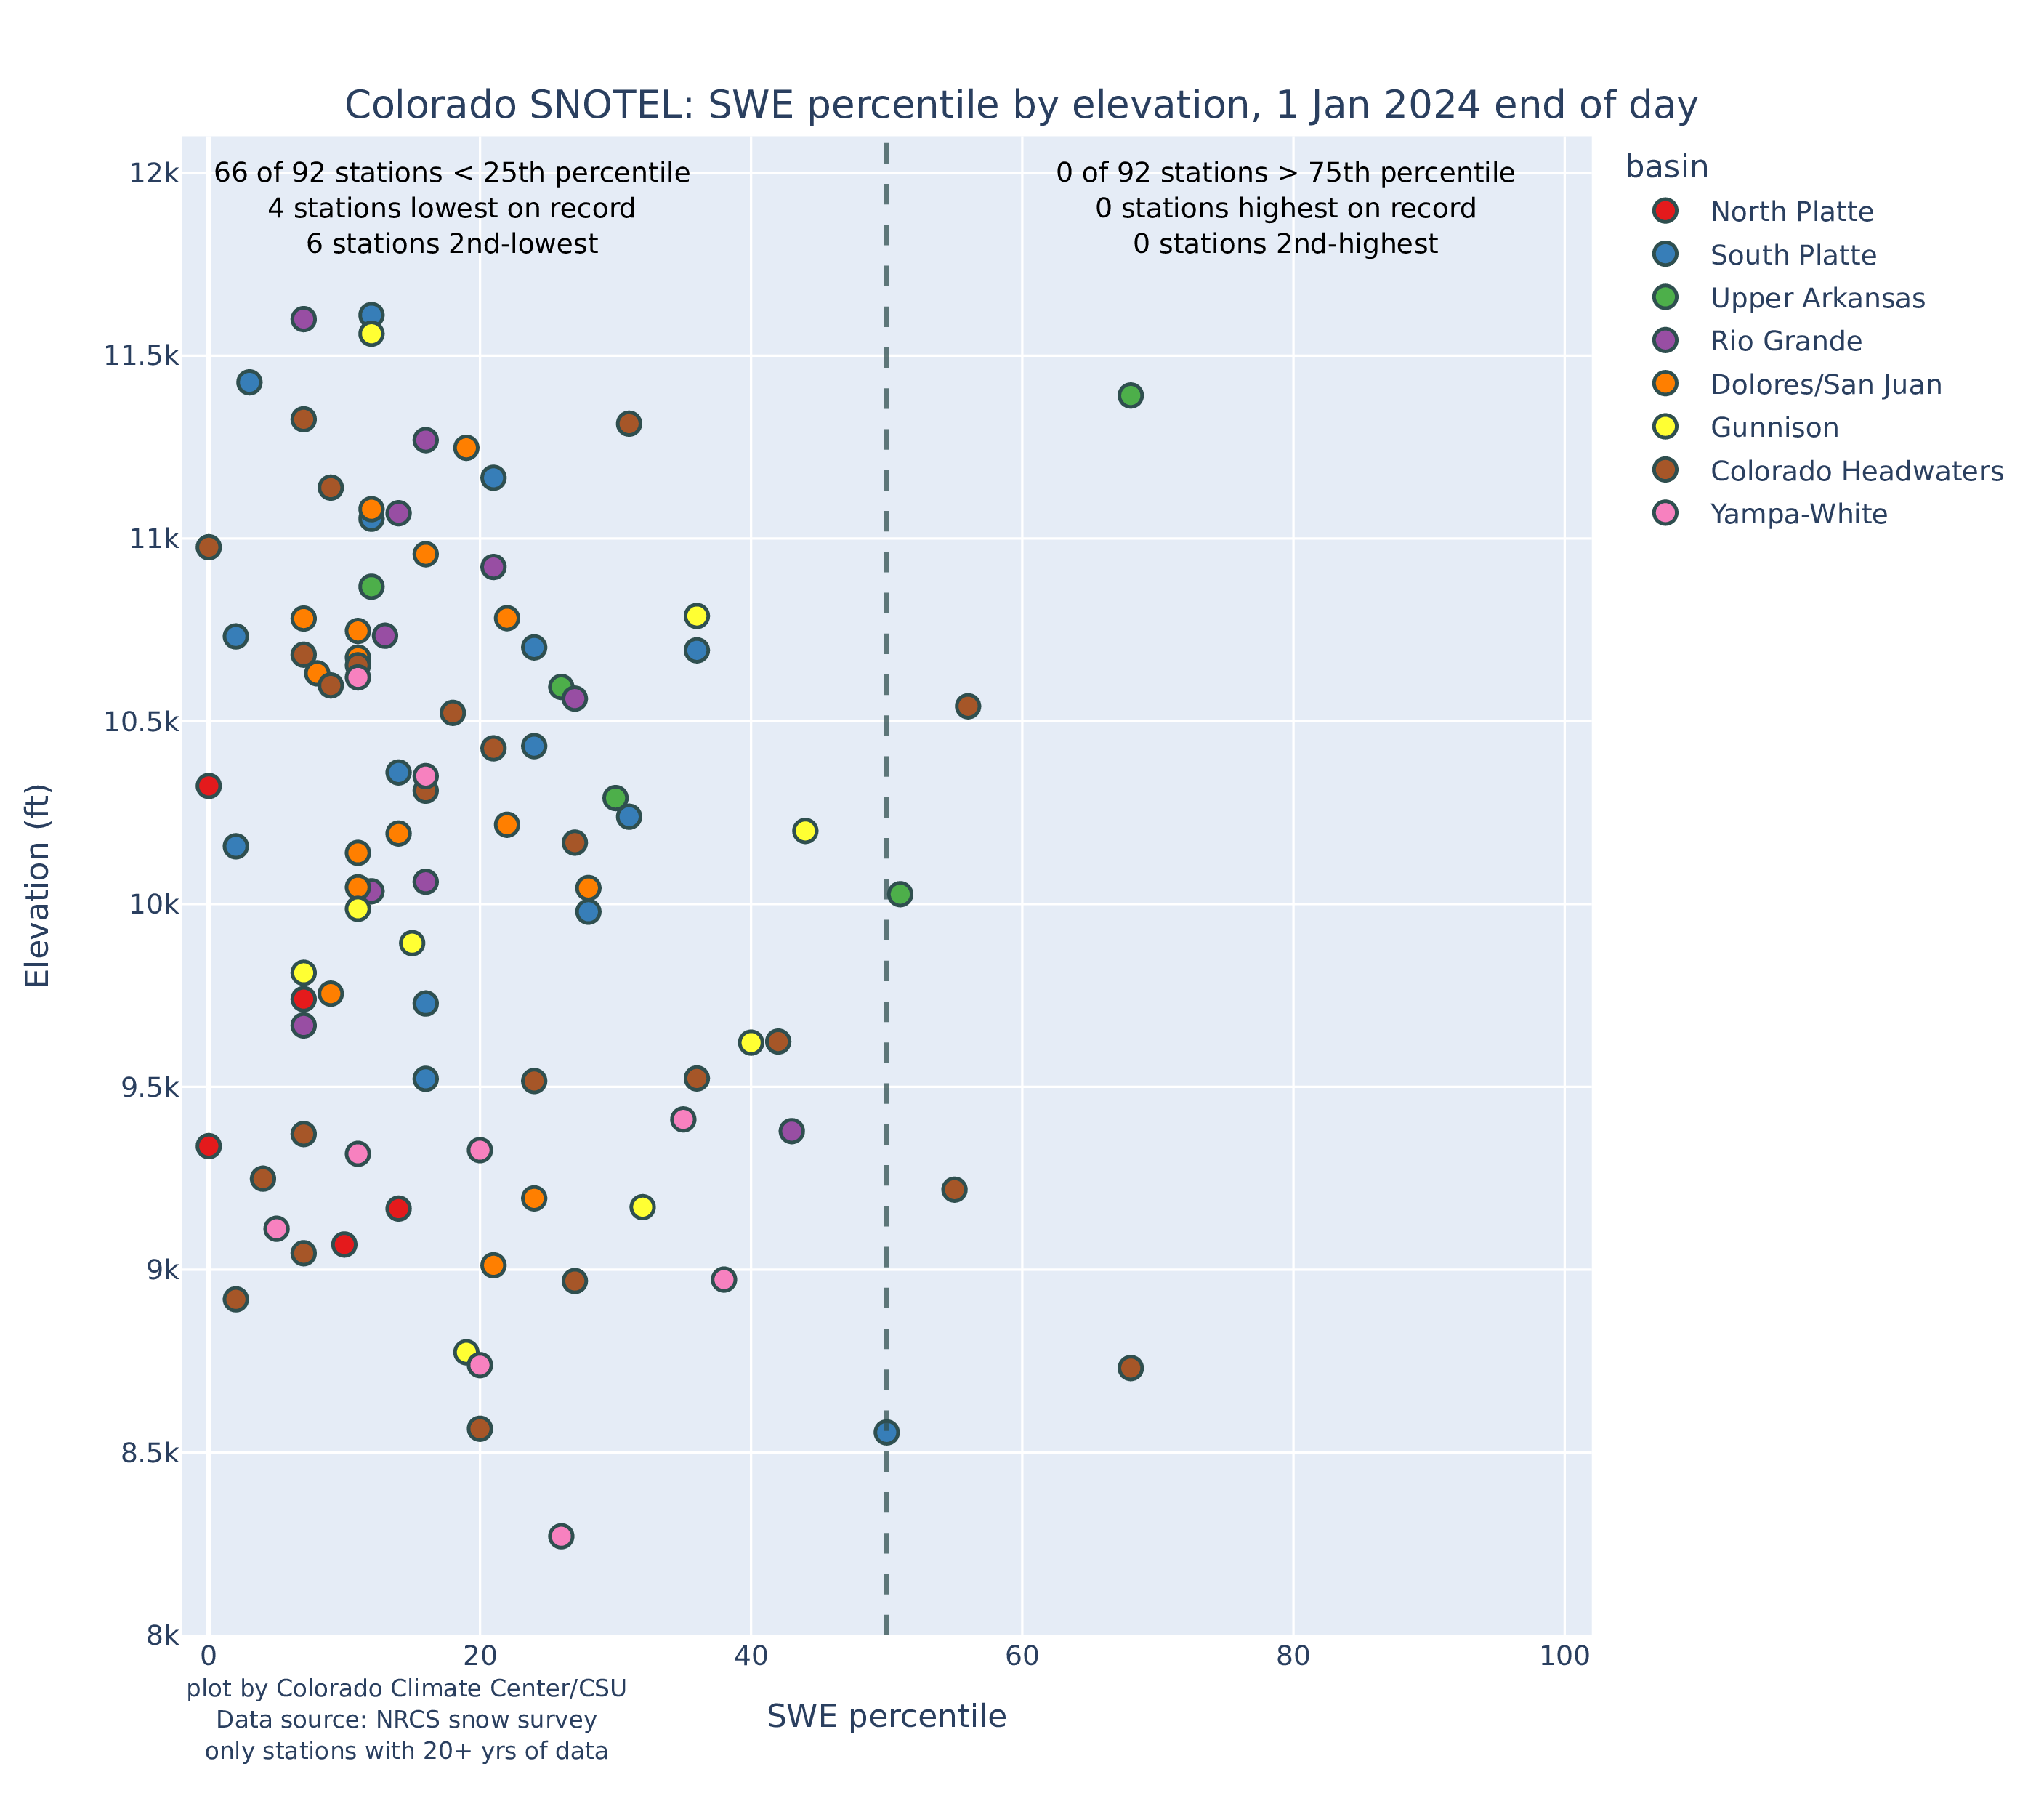
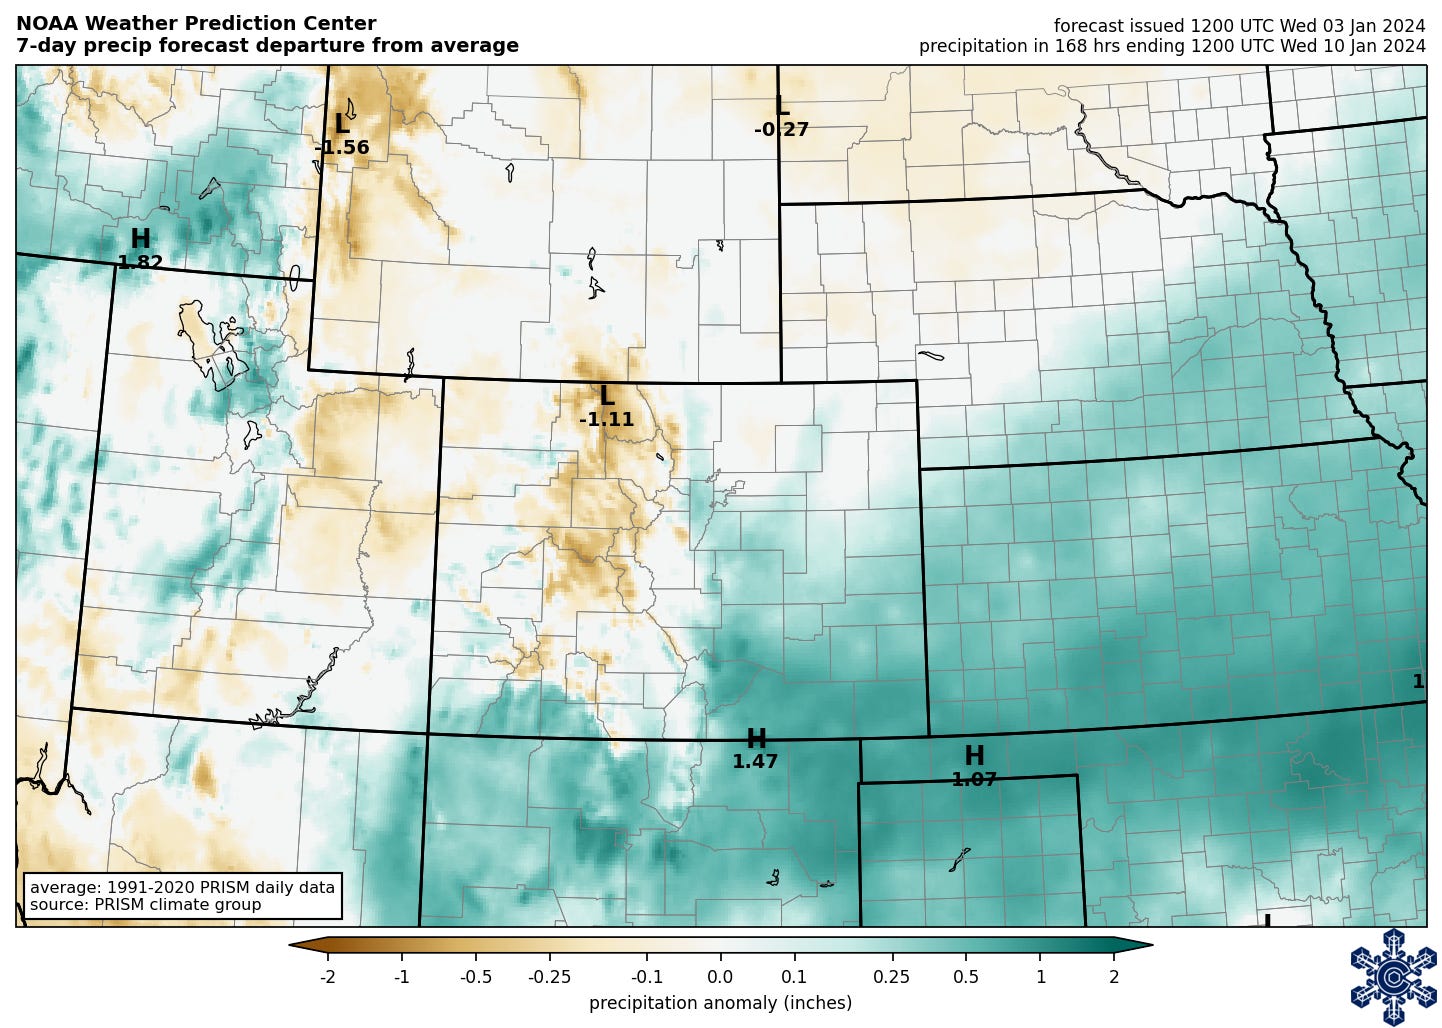


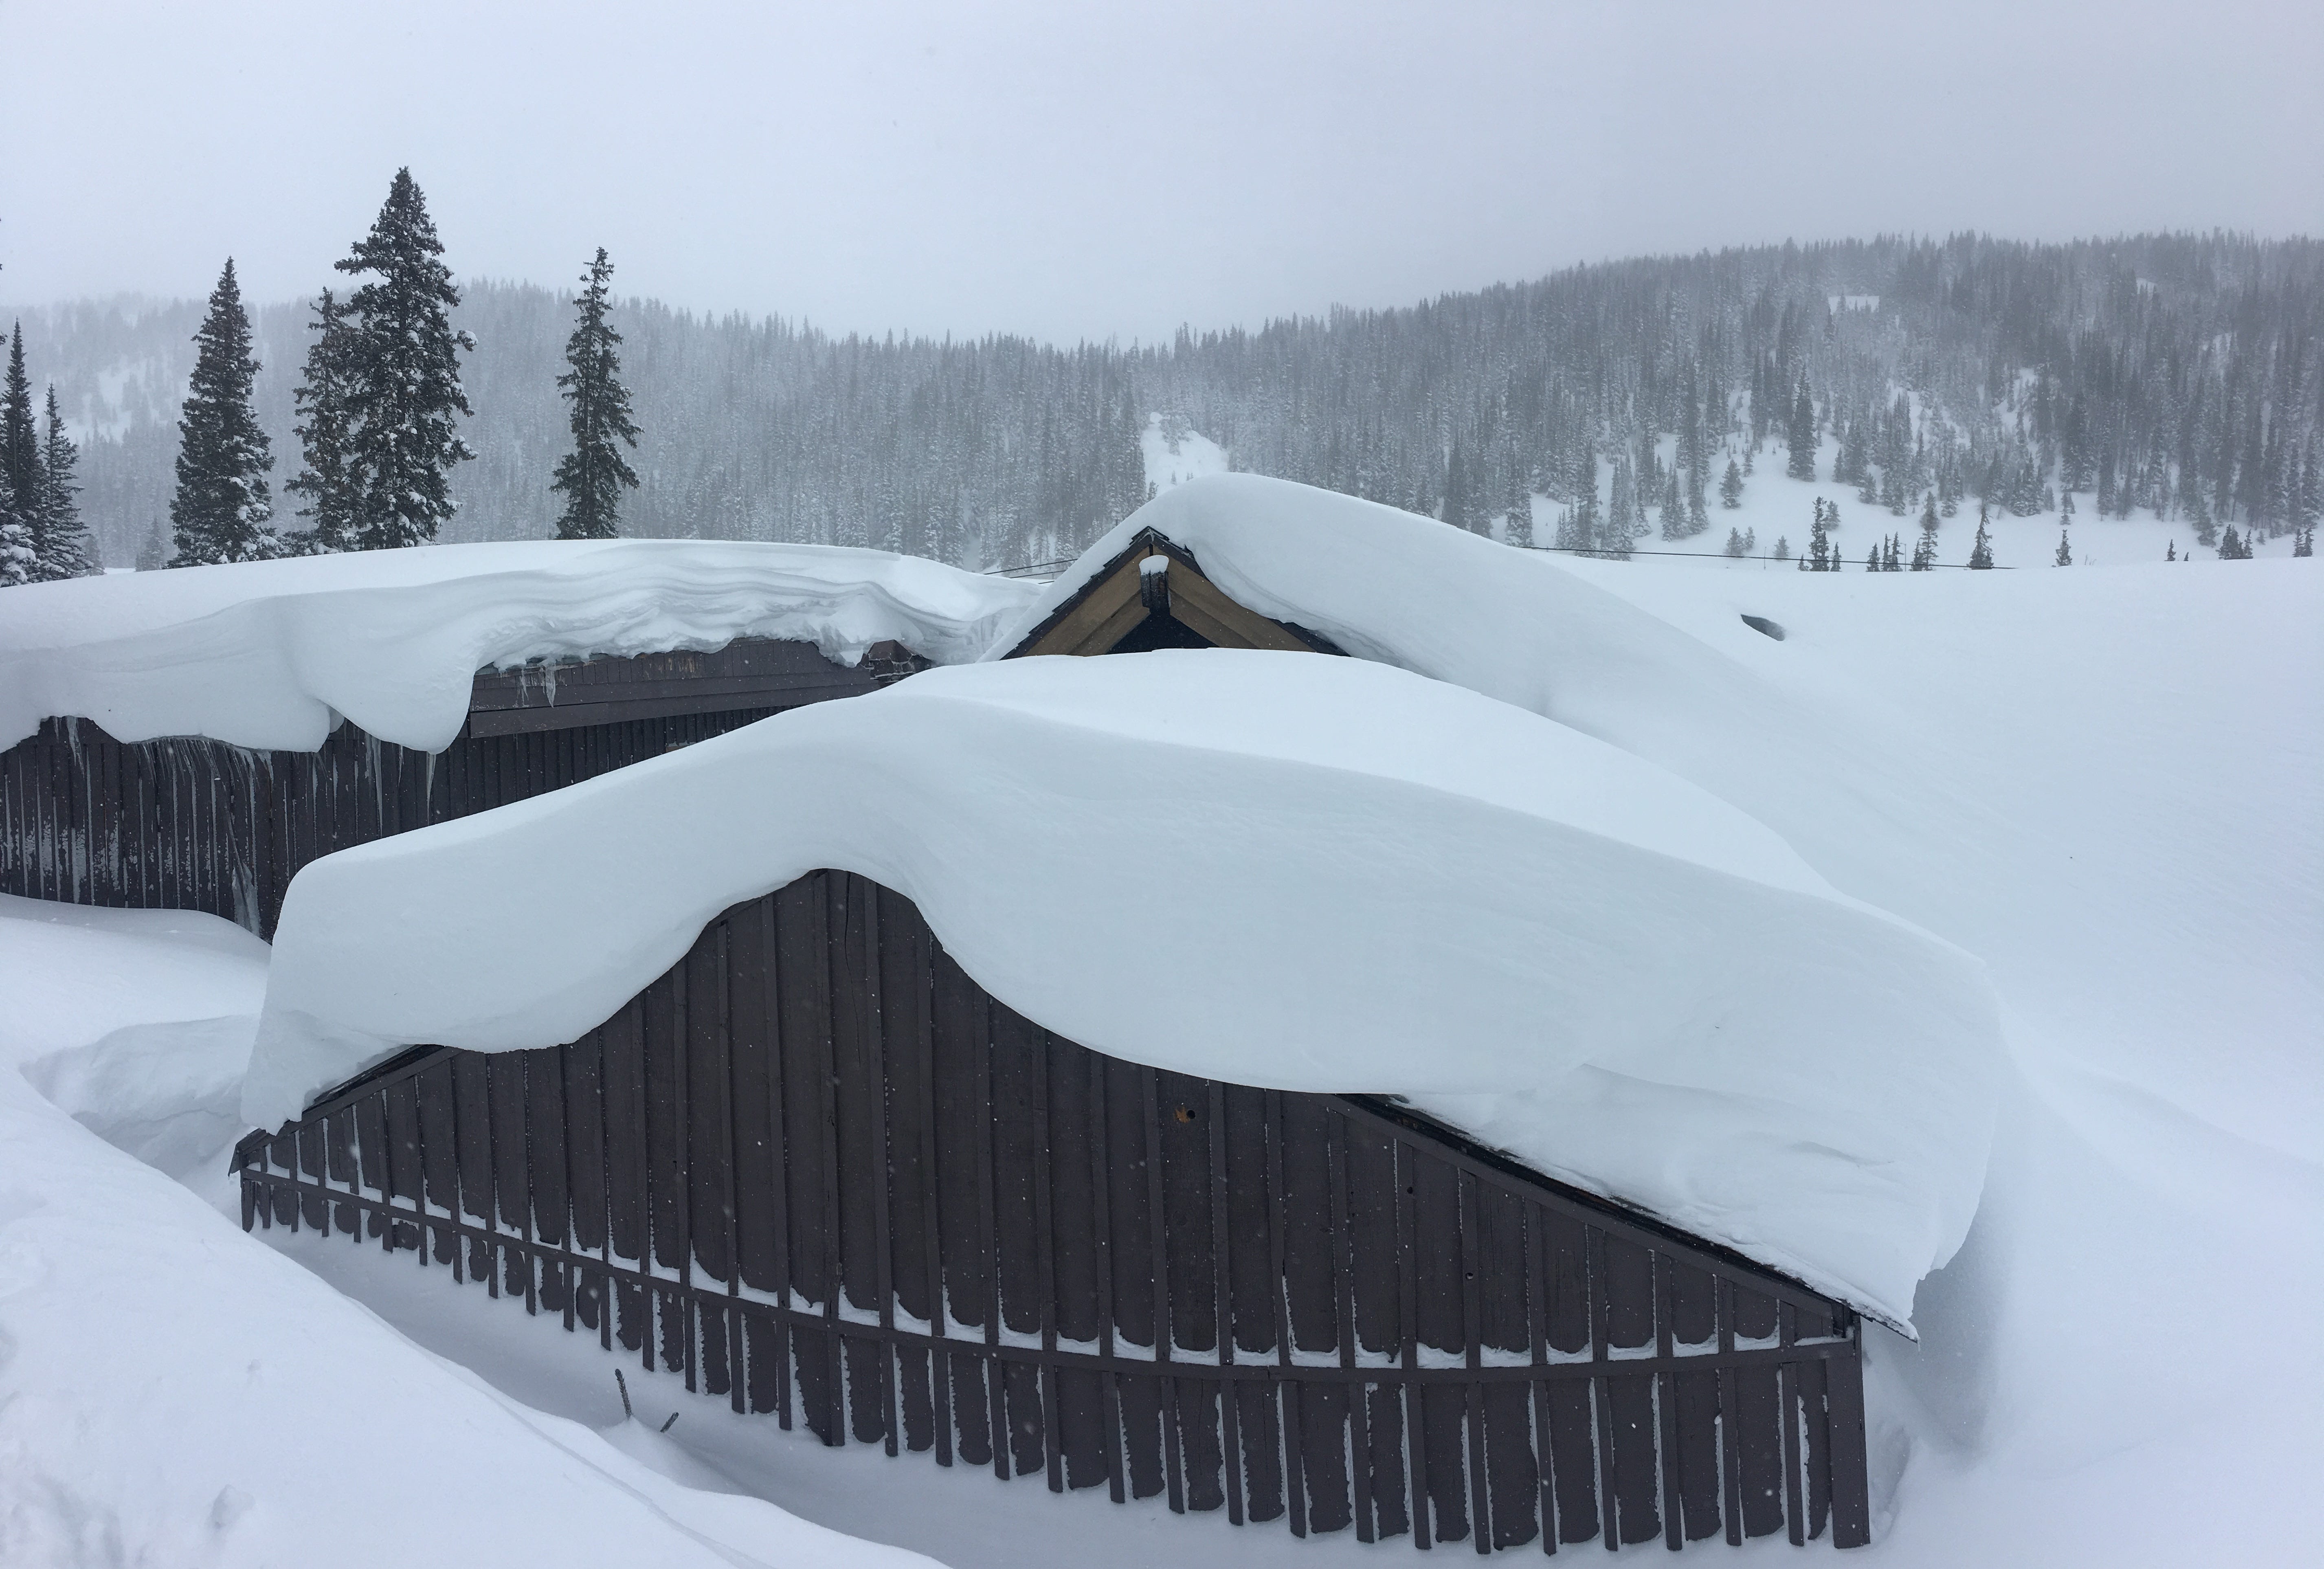

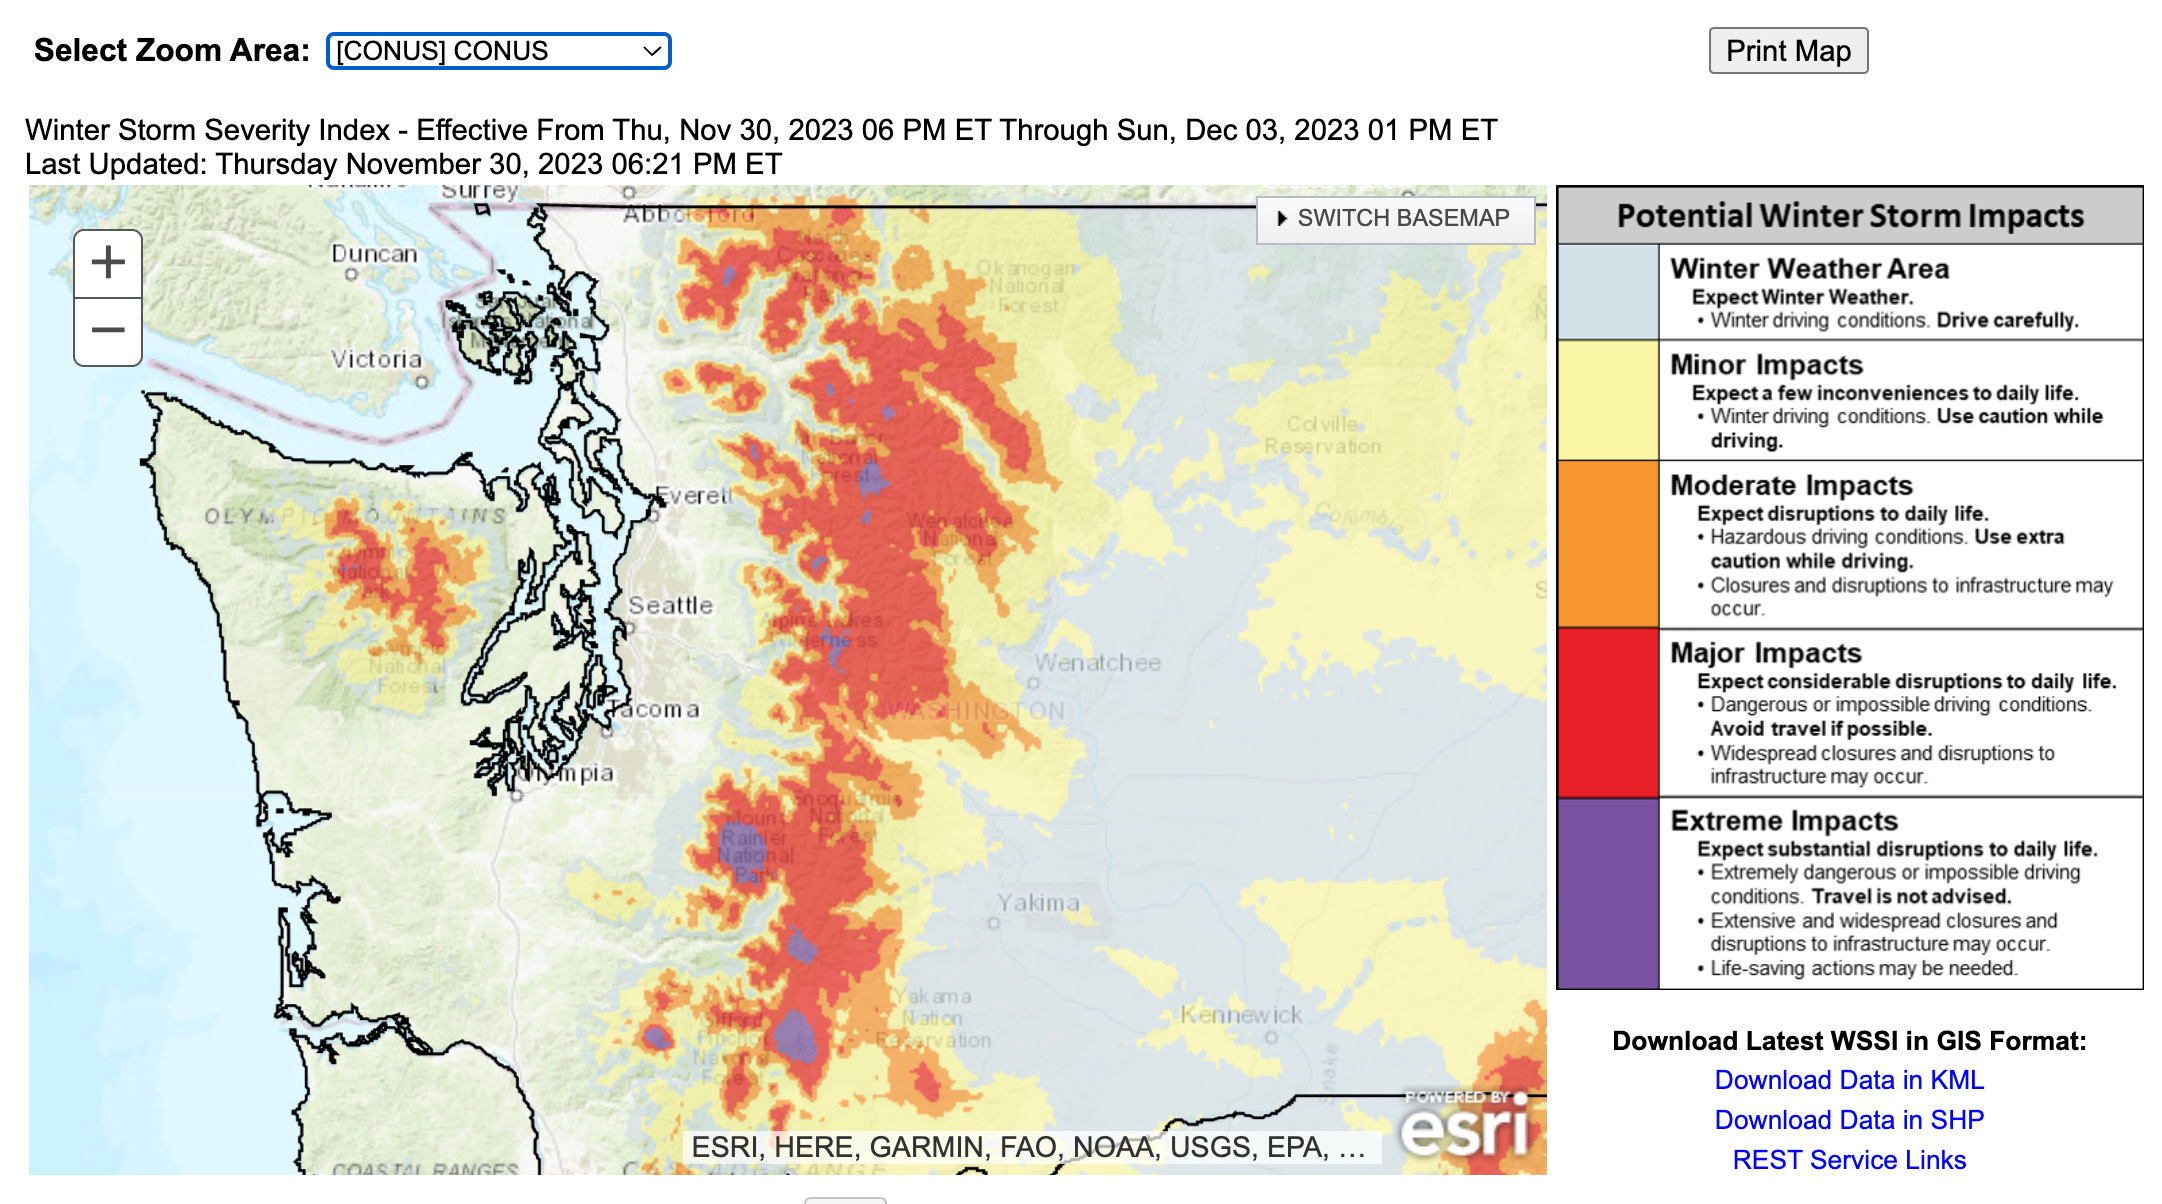
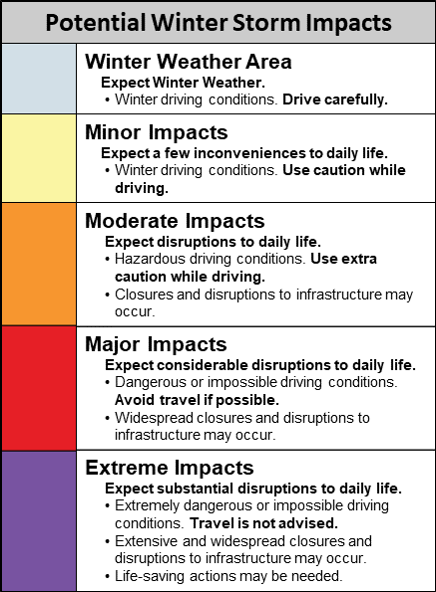
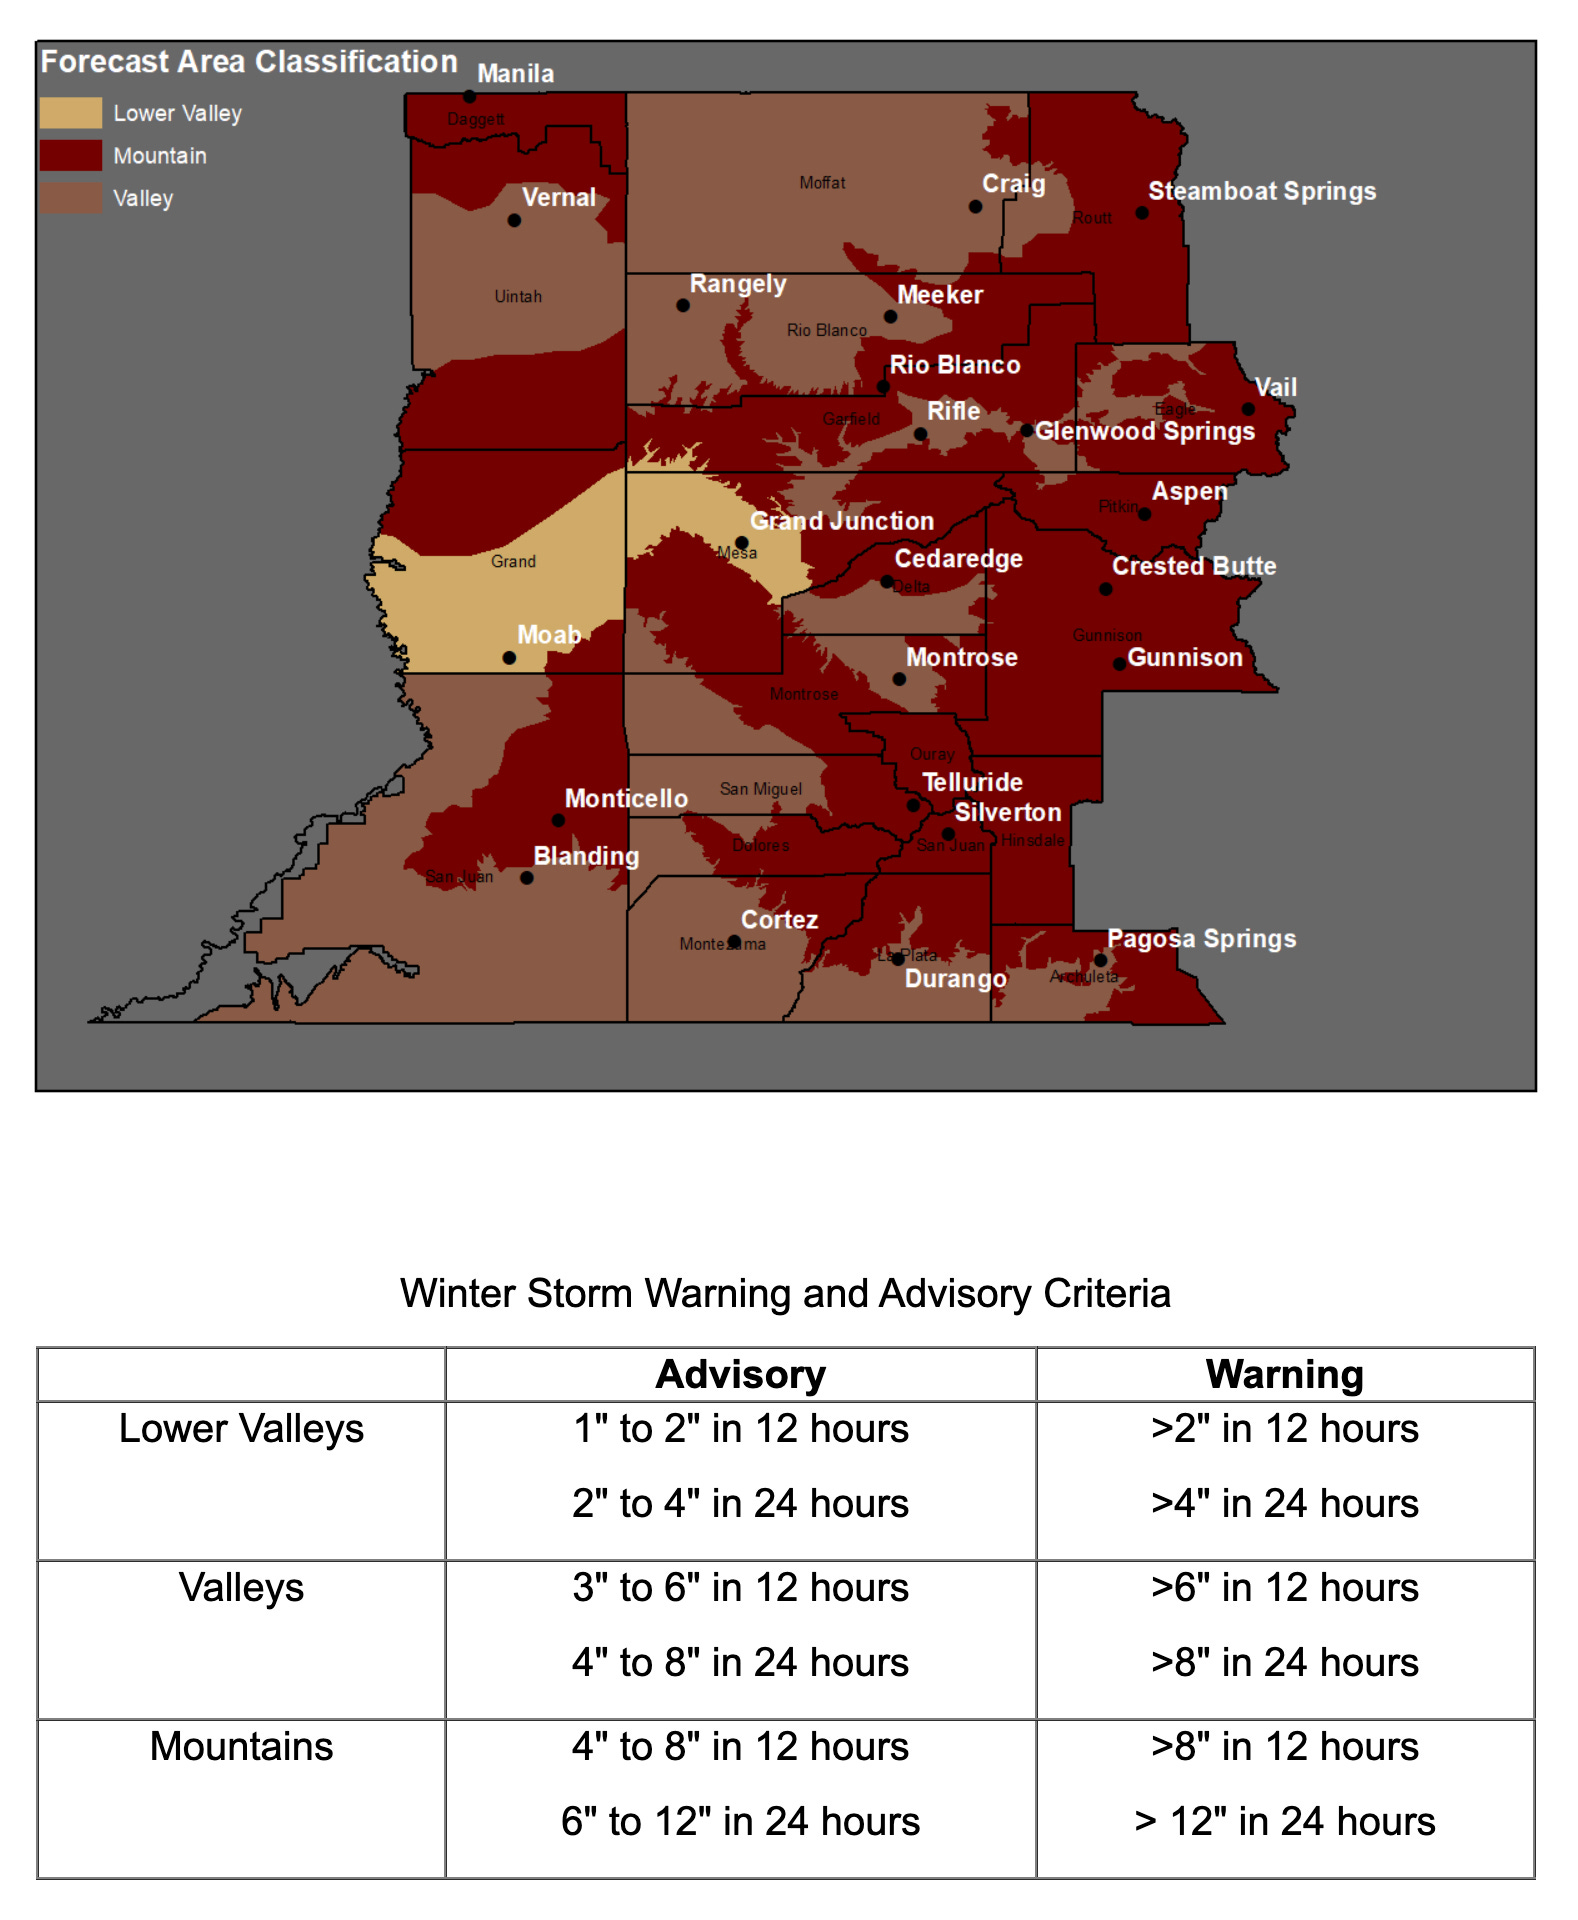


